. 2021 Oct 20;31(43):2103955.
doi: 10.1002/adfm.202103955. Epub 2021 Aug 6.

Multimodal Label-Free Monitoring of Adipogenic Stem Cell Differentiation Using Endogenous Optical Biomarkers

Affiliations

Multimodal Label-Free Monitoring of Adipogenic Stem Cell Differentiation Using Endogenous Optical Biomarkers

Nishir Mehta et al. Adv Funct Mater. .

Abstract

Stem cell-based therapies carry significant promise for treating human diseases. However, clinical translation of stem cell transplants for effective treatment requires precise non-destructive evaluation of the purity of stem cells with high sensitivity (<0.001% of the number of cells). Here, a novel methodology using hyperspectral imaging (HSI) combined with spectral angle mapping-based machine learning analysis is reported to distinguish differentiating human adipose-derived stem cells (hASCs) from control stem cells. The spectral signature of adipogenesis generated by the HSI method enables identifying differentiated cells at single-cell resolution. The label-free HSI method is compared with the standard techniques such as Oil Red O staining, fluorescence microscopy, and qPCR that are routinely used to evaluate adipogenic differentiation of hASCs. HSI is successfully used to assess the abundance of adipocytes derived from transplanted cells in a transgenic mice model. Further, Raman microscopy and multiphoton-based metabolic imaging is performed to provide complementary information for the functional imaging of the hASCs. Finally, the HSI method is validated using matrix-assisted laser desorption/ionization-mass spectrometry imaging of the stem cells. The study presented here demonstrates that multimodal imaging methods enable label-free identification of stem cell differentiation with high spatial and chemical resolution.

Keywords: MALDI; Raman microscopy; hyperspectral imaging; label-free stem cell imaging; second harmonic generation.


Conflict of interest statement

Conflict of Interest The authors declare no conflict of interest.

Figures

Figure 1.
Figure 1.
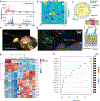
Schematic overview of quantitative label-free imaging implemented at the single-cell level. a) Label-free monitoring of human adipose-derived stem cell (hASCs) differentiation to adipogenic stem cells using Raman spectroscopy; b) Metabolic imaging using second harmonic generation (SHG) of stem cells to detect differentiated stem cells from control cells; c) MALDI-mass spectrometry imaging of lipid in differentiated stem cells; d) Schematic arrangement showing the hyperspectral imaging (HSI) system. The HSI system captures the spatial and spectral signature at each pixel of the image to form the data cube.
Figure 2.
Figure 2.
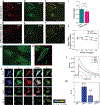
Representative cytochemical image of hASCs and gene expression profile. Confocal fluorescence images of cells cultured in adipogenic media for a) 1, b) 3, c) 6, and d) 9 days. The sub-cellular component of each images (scale = 20 μm) are shown for (i) cytoplasm, (ii) nucleus, and (iii) merged. The matured adipocytes (globular lipid droplets) are clearly seen on day 9 with the Nile red-stained cells; e) Relative gene expression profiles of adiponectin, leptin, and PPARg for stem cells incubated in adipogenic media for 6, and 9 days. Relative expression was normalized to cyclophilin B. The results show the average of three independent donor samples, and the error bars represent standard deviation. *P < 0.05, calculated using two-tailed Student’s t-test.
Figure 3.
Figure 3.
Confirmation of differentiation of hASCs using Oil Red O staining. Comparison of bright field images of Oil Red O staining assay of hASCs for a–c) control (with stromal media) and d–f) differentiated (with adipogenic media) cells. The cells cultured in stromal and adipogenic media for 3, 6, and 9 days are shown; g) Comparison of the number of lipid droplets in differentiated and control cells on days 3, 6, and 9. All the experiments were performed in triplicate. *P < 0.05, **P < 0.01, ***P < 0.001, two-tailed Student’s t-test.
Figure 4.
Figure 4.
Representative dark-field images showing the morphology of single hASCs cell. Comparison of dark-field images of stem cells in a–c) stromal, d–f) adipogenic media for 3, 6, and 9 days. A progressive increase in the number of larger lipid droplets is visible in the differentiated cells with time compared to control stem cells; g) Comparison of size of lipid droplets on different days in differentiated cells. The lipid droplets increased in size with time; h) The distribution of number of lipid droplets for the control and differentiated cells on day 3, 6, and 9. The inset shows that the lipid droplets found in the control cells are primarily of size < 2 μm2.
Figure 5.
Figure 5.
Representative hyperspectral imaging (HSI) of the differentiated hASCs and analysis of their optical biomarkers. a) HSI of differentiated stem cells (day 9) with the mapped spectral endmembers using spectral angle mapper (SAM) analysis. The spectral library was composed of 6 end members (EM-1 to 6). b–g) The zoomed-in images of each endmember are shown. The colored area in the images is indicative of the match with the spectral profiles. The spectral signature of the end members in the wavelength range 450 – 950 nm is shown next to the respective end member images; h) Schematic figure showing the location inside the cells from which the spectral signature corresponding to each endmembers is originating; i) Comparison of the spectral signature of the six end members; j) Principal component analysis (PCA) score plot of the six endmembers for the first two principal components (PC1 vs PC2). For each endmember, 10 different HSI images were analyzed. Images were acquired using 100x, image size 75 μm × 75 μm, number of samples, n = 3 corresponding to three separate donors.
Figure 6.
Figure 6.
Comparison of Spectral Angle Mapper (SAM) analysis of the control and differentiated hASCs. Representative hyperspectral images on day 9 showing the SAM analysis of control and differentiated cells for a) end member 1 (EM-1), b) EM-2, c) EM-3, d) EM-4, e) EM-5, and f) EM-6. Histogram showing the relative percentage classification (number of matched pixels) for the control and differentiated hASCs on days 3, 6, and 9 are shown for each endmembers. The number of analyzed images was 15 for each data point, and the error bar represents the standard deviation. *P < 0.05, **P < 0.01, ***P < 0.001, calculated using two-tailed student’s t-test.
Figure 7.
Figure 7.
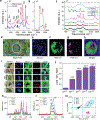
MALDI-MS analysis of hASCs. a) Representative MALDI-mass spectra of differentiated and control stem cells on day 9. The inset image shows peaks obtained for the control cells (m/z = 1300 – 1800), which are absent in the differentiated cells; b) A representative MALDI image of the differentiated cell at m/z = 553.48; c) schematic showing a lipid droplet and the components of the lipid droplet of the differentiated adipocytes; d) dark-field optical image of stem cell on the MALDI substrate. The inset shows the zoomed image of the cells; e) MALDI-MS image of the differentiated hADSC shown in (d), and overlaid on the respective bright-field optical image; f) schematic showing the cell membrane of a typical differentiated adipogenic stem cell. The lipid raft and the lipids found from the MALDI-MS analysis are shown in the image; g) Heatmap and cluster analysis showing top 25 lipid species that distinguishes early adipogenesis (Days 0–3) from late adipogenesis (Days 6–12) in positive ion mode; h) Partial Least Squares Discriminant Analysis (PLS-DA) showing the Variable Importance in Projection (VIP) values > 1.5 in positive ion mode at various differentiation time points (days 0–12). The colored box indicates the relative concentration of the top 15 lipid species in each group whose levels have significantly changed.
Figure 8.
Figure 8.
Metabolic imaging of the hASCs using multimodal two-photon fluorescence (TPF) and second harmonic generation (SHG) microscopy. a) TPF, b) SHG, and c) merged image of the hASCs in stromal media on day 9; d) TPF, e) SHG, and f) merged images of the hASCs in adipogenic media on day 9. The zoomed-in SHG images are shown for g) control cell (blue box in b), and h) differentiated cells (red box in e); i) comparison of optical redox ratio [FAD/(NADH+FAD)] between control and differentiated cells; j) redox ratio calculated for 5 different images corresponding to control and differentiated hASCs is shown. **P < 0.01, calculated using two-tailed Student’s t-test; k) Emission is captured between 584 to 622 nm. τ1, τ2, τ3 represent fluorescence emissions spectrum decay components measured in nanoseconds. Pixels are pseudo-colored with R G B channel colors based on their decay times measured by the detector. The fastest component is colored blue, while the longest is colored red, as shown in a scale bar; l) photon counts of τmean (amplitude weighted) components of different differentiation days (3, 6, 9, and 12) plotted against time in nanoseconds, and m) represents amplitude ratio of fluorescence-lifetime redox ratios of amplitude-1 (A1) and amplitude-2 (A2).
Figure 9.
Figure 9.
Raman spectroscopy and imaging of hASCs. The average Raman spectra of control and differentiated stem cells from a) 400–2000 cm−1, and b) 2700–3200 cm−1; c) the representative spectral signature from the sub-cellular component of a differentiated (D), and control (C) hADSC on day 9. The corresponding d) bright field image and Raman image of a single cell at specific vibrational peaks are shown in e–h; i) representative mapping data comparing bright-field images to Raman image of a single cell at specific vibrational peaks at 794 cm−1 (nucleic acid), 1002 cm−1 (amino acid), 1450 cm−1 (lipids). This is the low-wavenumber range; j) Represents I2855(Lipid)/I2925(− CH3) ratio of the differentiated cells. The average Raman spectra of the differentiated stem cells from k) 200 to 2000 cm−1 and l) 2500 to 3200 cm−1, while m) PCA analysis of 10 spectrum collected at each differentiation day.
Figure 10.
Figure 10.
Ex vivo imaging of adipocytes using HSI. a) Schematic showing the experimental design to study ex vivo implant in transgenic mice. Second harmonic generation (SHG) and hyperspectral imaging (HSI) of adipocytes in the ex vivo tissue sample. b,c) SHG and two-photon (λex = 800 nm) image of the tissue sample containing the adipocytes. The extracellular matrix (green), non-adipocytes or adipogenic cells of the recipient (circular structures), and adipocytes (circular structure with red color identifying tdTomato) are clearly visible. To excite is tdTomato, we used a single photon laser with λex = 561 nm. d) FACS results showing the fraction of cells containing tdTomato (adipose stem cells). e,f) HSI image showing the adipose stem cells in the tissue sample. g) Classification of differentiated and control cells in the tissue sample using the HSI spectral angle mapping algorithm.

References

    1. Caplan AI, J. Orthop. Res 1991, 9, 641. - PubMed
    1. Baksh D, Yao R, Tuan RS, Stem Cells 2007, 25, 1384. - PubMed
    1. Gimble JM, Guilak F, Cytotherapy 2003, 5, 362. - PubMed
    1. a) Wu L, Wang T, Ge Y, Cai X, Wang J, Lin Y, Cell Proliferation 2012, 45, 311; - PMC - PubMed
    2. b) Greenberg AS, Obin MS, Am. J. Clin. Nutr 2006, 83, 461S; - PubMed
    3. c) Fantuzzi G, J. Allergy Clin. Immunol 2005, 115, 911; - PubMed
    4. d) Shaik S, Wu X, Gimble J, Devireddy R, Sci. Rep 2018, 8, 8162. - PMC - PubMed
    1. Suhito IR, Han Y, Min J, Son H, Kim T-H, Biomaterials 2018, 154, 223. - PubMed

LinkOut - more resources