

Multi-Omics Analysis of Microglial Extracellular Vesicles From Human Alzheimer's Disease Brain Tissue Reveals Disease-Associated Signatures
- PMID: 34925024
- PMCID: PMC8675946
- DOI: 10.3389/fphar.2021.766082
Multi-Omics Analysis of Microglial Extracellular Vesicles From Human Alzheimer's Disease Brain Tissue Reveals Disease-Associated Signatures
Abstract
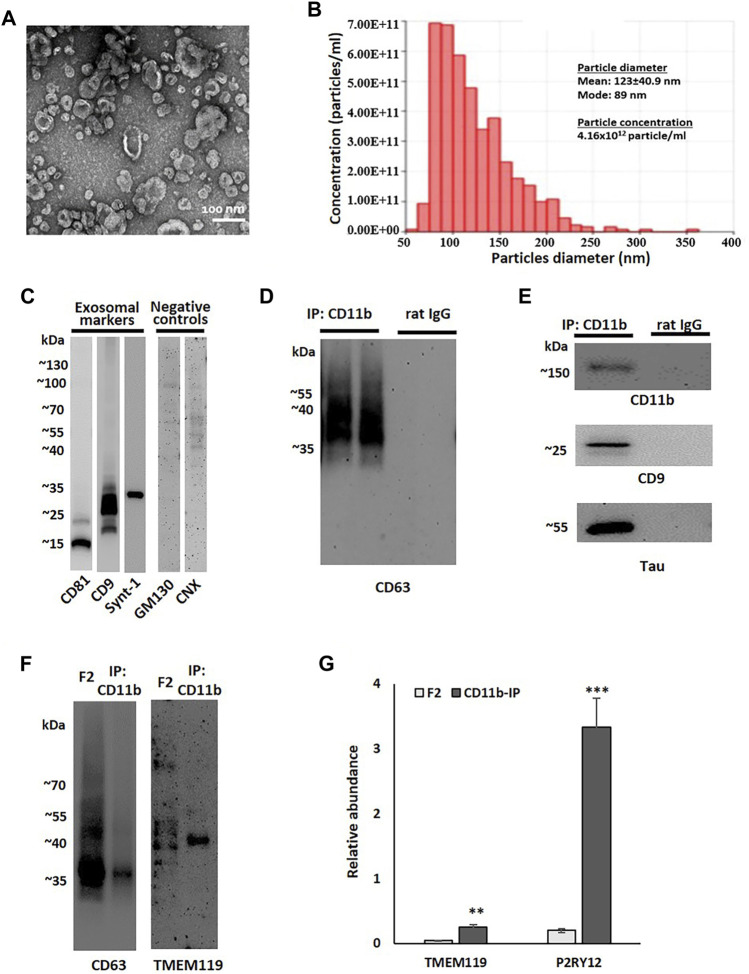
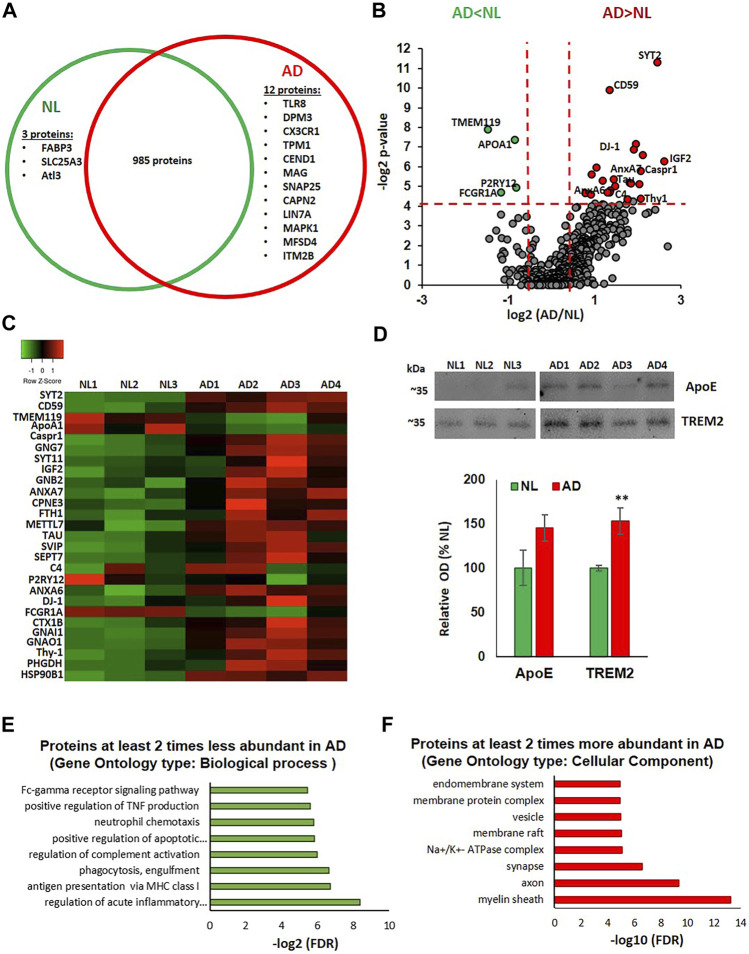
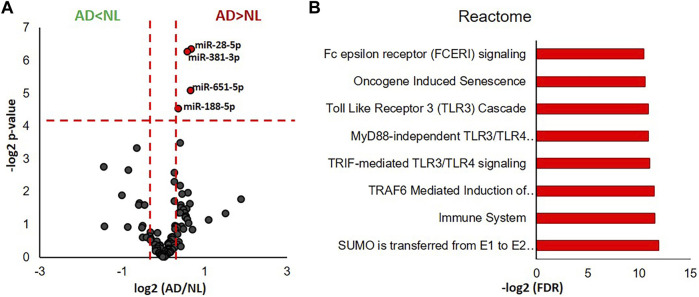
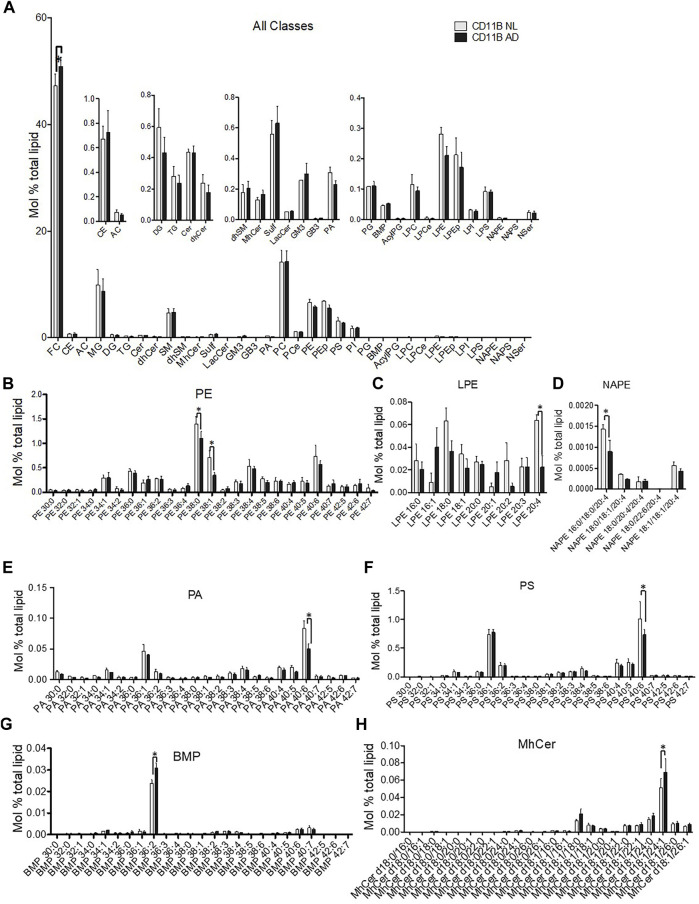
Alzheimer's disease (AD) is the most common cause of dementia, yet there is no cure or diagnostics available prior to the onset of clinical symptoms. Extracellular vesicles (EVs) are lipid bilayer-delimited particles that are released from almost all types of cell. Genome-wide association studies have linked multiple AD genetic risk factors to microglia-specific pathways. It is plausible that microglia-derived EVs may play a role in the progression of AD by contributing to the dissemination of insoluble pathogenic proteins, such as tau and Aβ. Despite the potential utility of EVs as a diagnostic tool, our knowledge of human brain EV subpopulations is limited. Here we present a method for isolating microglial CD11b-positive small EVs from cryopreserved human brain tissue, as well as an integrated multiomics analysis of microglial EVs enriched from the parietal cortex of four late-stage AD (Braak V-VI) and three age-matched normal/low pathology (NL) cases. This integrated analysis revealed 1,000 proteins, 594 lipids, and 105 miRNAs using shotgun proteomics, targeted lipidomics, and NanoString nCounter technology, respectively. The results showed a significant reduction in the abundance of homeostatic microglia markers P2RY12 and TMEM119, and increased levels of disease-associated microglia markers FTH1 and TREM2, in CD11b-positive EVs from AD brain compared to NL cases. Tau abundance was significantly higher in AD brain-derived microglial EVs. These changes were accompanied by the upregulation of synaptic and neuron-specific proteins in the AD group. Levels of free cholesterol were elevated in microglial EVs from the AD brain. Lipidomic analysis also revealed a proinflammatory lipid profile, endolysosomal dysfunction, and a significant AD-associated decrease in levels of docosahexaenoic acid (DHA)-containing polyunsaturated lipids, suggesting a potential defect in acyl-chain remodeling. Additionally, four miRNAs associated with immune and cellular senescence signaling pathways were significantly upregulated in the AD group. Our data suggest that loss of the homeostatic microglia signature in late AD stages may be accompanied by endolysosomal impairment and the release of undigested neuronal and myelin debris, including tau, through extracellular vesicles. We suggest that the analysis of microglia-derived EVs has merit for identifying novel EV-associated biomarkers and providing a framework for future larger-scale multiomics studies on patient-derived cell-type-specific EVs.
Keywords: Alzheimer’s disease; exosomes; extracellular vesicles; microglia; omics analysis.
Copyright © 2021 Cohn, Melnik, Huang, Teter, Chandra, Zhu, McIntire, John, Gylys and Bilousova.
Conflict of interest statement
The authors declare that the research was conducted in the absence of any commercial or financial relationships that could be construed as a potential conflict of interest.
Figures
Similar articles
-
Characterization of brain-derived extracellular vesicle lipids in Alzheimer's disease.J Extracell Vesicles. 2021 May;10(7):e12089. doi: 10.1002/jev2.12089. Epub 2021 May 11. J Extracell Vesicles. 2021. PMID: 34012516 Free PMC article.
-
Plasma neuronal exosomes serve as biomarkers of cognitive impairment in HIV infection and Alzheimer's disease.J Neurovirol. 2019 Oct;25(5):702-709. doi: 10.1007/s13365-018-0695-4. Epub 2019 Jan 4. J Neurovirol. 2019. PMID: 30610738 Free PMC article. Review.
-
Microglia-derived extracellular vesicles in Alzheimer's Disease: A double-edged sword.Biochem Pharmacol. 2018 Feb;148:184-192. doi: 10.1016/j.bcp.2017.12.020. Epub 2018 Jan 3. Biochem Pharmacol. 2018. PMID: 29305855 Review.
-
Multiomics from Alzheimer's Brains and Mesenchymal Stem Cell-Derived Extracellular Vesicles Identifies Therapeutic Potential of Specific Subpopulations to Target Mitochondrial Proteostasis.J Cent Nerv Syst Dis. 2025 Apr 23;17:11795735251336302. doi: 10.1177/11795735251336302. eCollection 2025. J Cent Nerv Syst Dis. 2025. PMID: 40297324 Free PMC article.
-
Enrichment of Neurodegenerative Microglia Signature in Brain-Derived Extracellular Vesicles Isolated from Alzheimer's Disease Mouse Models.J Proteome Res. 2021 Mar 5;20(3):1733-1743. doi: 10.1021/acs.jproteome.0c00934. Epub 2021 Feb 3. J Proteome Res. 2021. PMID: 33534581 Free PMC article.
Cited by
-
Extracellular vesicles from microglial cells activated by abnormal heparan sulfate oligosaccharides from Sanfilippo patients impair neuronal dendritic arborization.Mol Med. 2024 Nov 4;30(1):197. doi: 10.1186/s10020-024-00953-1. Mol Med. 2024. PMID: 39497064 Free PMC article.
-
Pathogenesis, therapeutic strategies and biomarker development based on "omics" analysis related to microglia in Alzheimer's disease.J Neuroinflammation. 2022 Sep 4;19(1):215. doi: 10.1186/s12974-022-02580-1. J Neuroinflammation. 2022. PMID: 36058959 Free PMC article. Review.
-
Early Diagnosis of Brain Diseases Using Artificial Intelligence and EV Molecular Data: A Proposed Noninvasive Repeated Diagnosis Approach.Cells. 2022 Dec 26;12(1):102. doi: 10.3390/cells12010102. Cells. 2022. PMID: 36611896 Free PMC article.
-
Extracellular Vesicle-Mediated Neuron-Glia Communications in the Central Nervous System.J Neurosci. 2024 Oct 2;44(40):e1170242024. doi: 10.1523/JNEUROSCI.1170-24.2024. J Neurosci. 2024. PMID: 39358029 Free PMC article. Review.
-
Primary cilia-mediated regulation of microglial secretion in Alzheimer's disease.Front Mol Biosci. 2023 Oct 23;10:1250335. doi: 10.3389/fmolb.2023.1250335. eCollection 2023. Front Mol Biosci. 2023. PMID: 37942288 Free PMC article.
References
-
- Abdullah L., Evans J. E., Emmerich T., Crynen G., Shackleton B., Keegan A. P., et al. (2017). APOE ε4 Specific Imbalance of Arachidonic Acid and Docosahexaenoic Acid in Serum Phospholipids Identifies Individuals with Preclinical Mild Cognitive Impairment/Alzheimer's Disease. Aging (Albany NY) 9, 964–985. 10.18632/aging.101203 - DOI - PMC - PubMed
Grants and funding
LinkOut - more resources
Full Text Sources
Research Materials
Miscellaneous