. 2021 Dec 1:12:777689.
doi: 10.3389/fphar.2021.777689. eCollection 2021.

Integrated Network Pharmacology and Lipidomics to Reveal the Inhibitory Effect of Qingfei Oral Liquid on Excessive Autophagy in RSV-Induced Lung Inflammation

Affiliations

Integrated Network Pharmacology and Lipidomics to Reveal the Inhibitory Effect of Qingfei Oral Liquid on Excessive Autophagy in RSV-Induced Lung Inflammation

Lili Lin et al. Front Pharmacol. .

Abstract

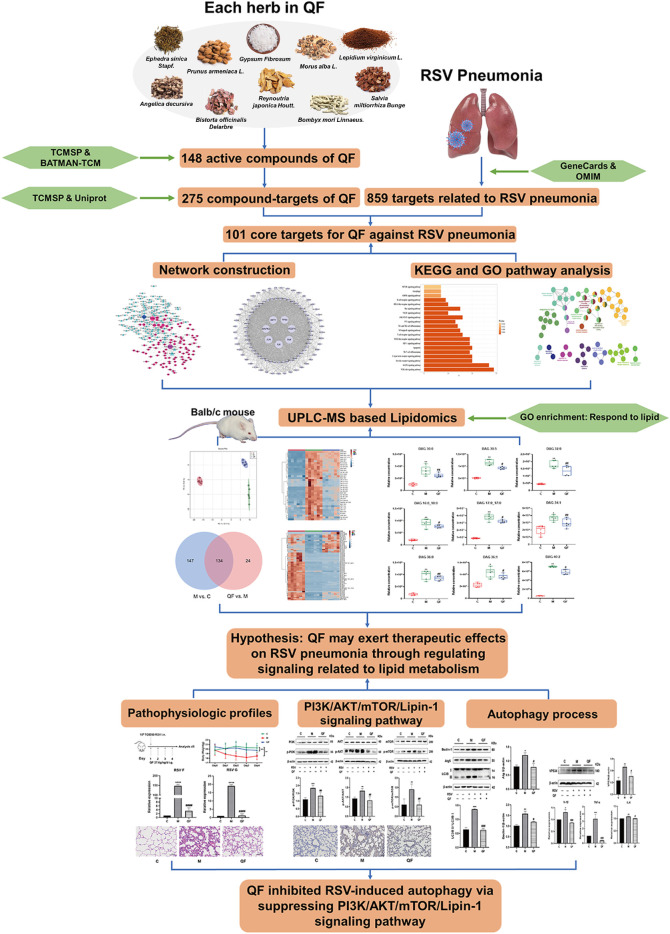
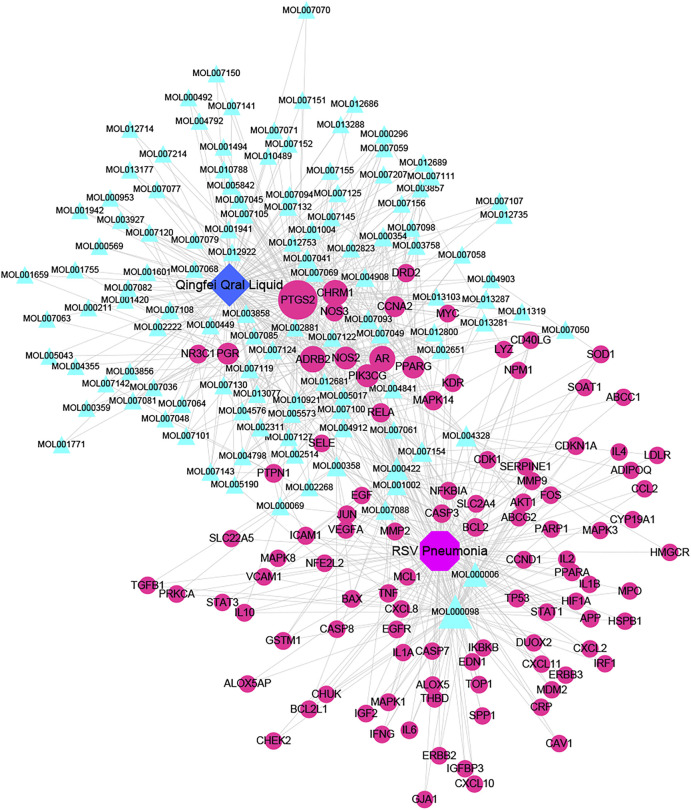
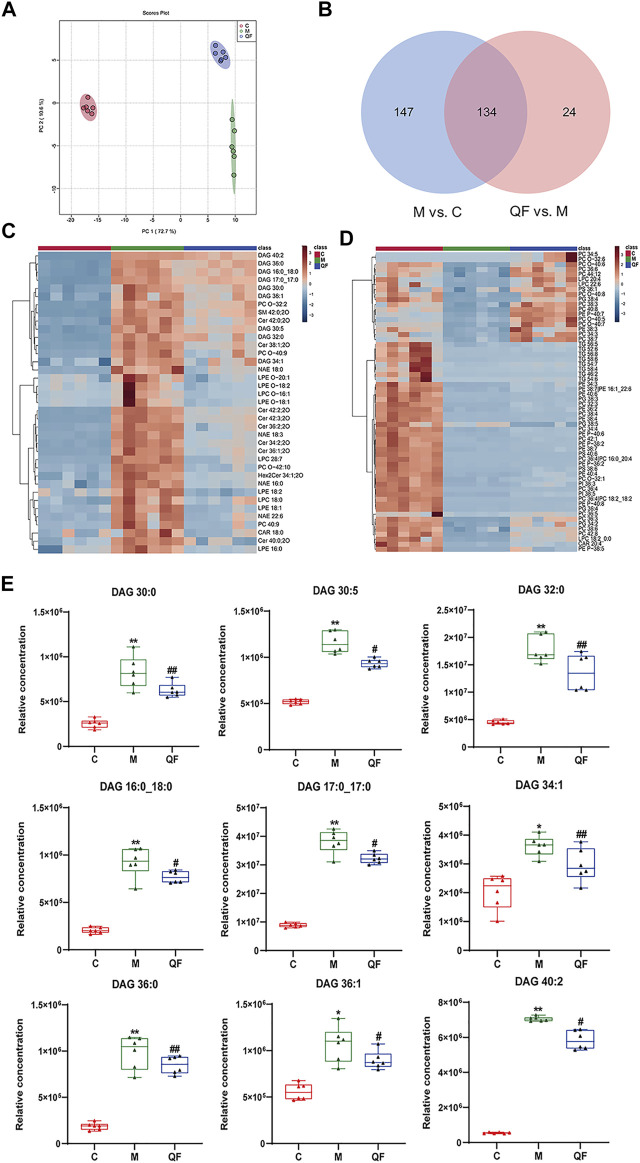
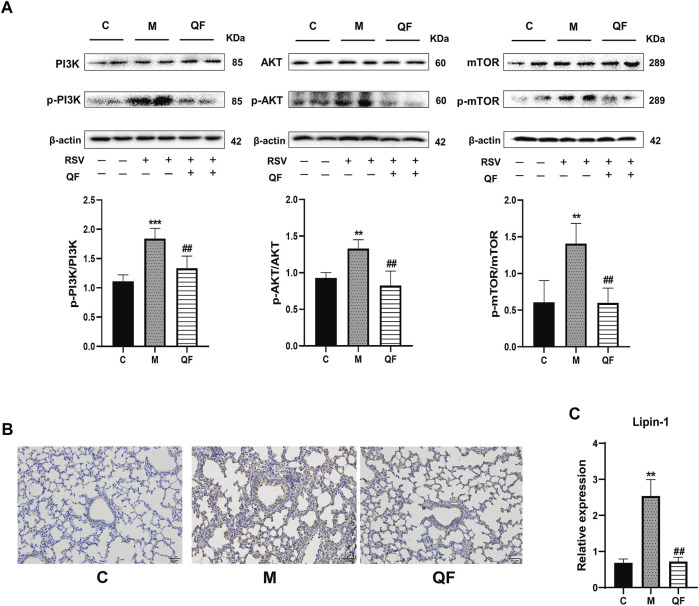
Background: Respiratory syncytial virus (RSV) can cause varying degrees of lung inflammation in children. Qingfei Oral Liquid (QF) is effective in treating childhood RSV-induced lung inflammation (RSV-LI) in clinics, but its pharmacological profiles and mechanisms remain unclear. Methods: This study combined network Pharmacology, lipidomics, pharmacodynamics, and pathway validation to evaluate the therapeutic mechanisms of QF. Using Cytoscape (v3.8.2) and enrichment analyses from the Kyoto Encyclopedia of Genes and Genomes (KEGG) and Gene Ontology (GO), a global view of the putative compound-target-pathway network was created. The corresponding lipidomic profiles were then used to detect differently activated lipids, revealing the metabolic pathway, using ultra-high-performance liquid chromatography linked to hybrid Quadrupole-Exactive Orbitrap mass spectrometry (UHPLC-Q-Exactive Orbitrap MS). Meanwhile, the in vivo efficiency of QF, the enrichment pathway, and the excessive autophagy inhibition mechanisms were validated in RSV-infected mice models. Results: The network pharmacology results demonstrated 117 active compounds acted directly upon 101 core targets of QF against RSV-LI. The most significantly enriched pathway was the PI3K/Akt/mTOR signaling pathway (p < 0.05). In addition, untargeted lipidomics were performed, and it was revealed that higher lung levels of DAG 30:0, DAG 30:5, DAG 32:0, DAG 16:0_18:0, DAG 17:0_17:0, DAG 34:1, DAG 36:0, DAG 36:1 in the RSV-LI group were decreased after QF administration (FDR < 0.05, FC > 1.2). Lipin-1, a key enzyme in DAG synthesis, was increased in the RSV-LI mouse model. Animal experiments further validated that QF inhibited the PI3K/Akt/mTOR signaling pathway, with lower lung levels of phosphorylated PI3K, AKT and mTOR, as well as its related proteins of lipin-1 and VPS34 (p < 0.01). Finally, pharmacodynamic investigations indicated that QF reduced airway inflammation caused by excessive autophagy by decreasing lung levels of RSV F and G proteins, Beclin-1, Atg5, and LC3B II, IL-1 and TNF-α (p < 0.05). Conclusion: Lipidomic-based network pharmacology, along with experimental validation, may be effective approaches for illustrating the therapeutic mechanism of QF in the treatment of RSV-LI.

Keywords: PI3K/AKT/mTOR; excessive autophagy; lipidomics; lipin-1; network pharmacology; qingfei oral liquid; respiratory syncytial virus.


Conflict of interest statement

The authors declare that the research was conducted in the absence of any commercial or financial relationships that could be construed as a potential conflict of interest.

Figures

FIGURE 1
FIGURE 1
Study design. Abbreviations: QF, Qingfei oral liquid; RSV, respiratory syncytial virus.
FIGURE 2
FIGURE 2
Evaluation of RSV-induced lung inflammation mouse model and efficacy of QF. (A) Schematic diagram of animal modeling and administration. (B) Weight changes of mice in control (C), model (M), and therapy (QF) groups from day 0 to day 4. Values are expressed as mean ± standard error of the mean (SEM; n = 6, * compared with control group, **p < 0.01, ns = not significant). (C) Transcription levels of RSV F and RSV G proteins in lung tissues of mice in control (C), model (M), and therapy (QF) groups. Values are expressed as mean ± SEM (n = 6, * compared with control group, # compared with model group, ****p < 0.0001, #### p < 0.0001. (D) H&E staining to evaluate pulmonary histopathological damage in control (C), model (M), and therapy (QF) groups (200× magnification). The black arrow indicated the evident inflammatory cell infiltration in lung tissue. Abbreviations: QF, Qingfei oral liquid; RSV, respiratory syncytial virus.
FIGURE 3
FIGURE 3
Active compound-core target network of QF in the treatment of RSV-induced lung inflammation. Blue triangle nodes represent the molecular identification (MOL ID) number of active components in QF, and red circle nodes represent the core targets. Edges represent interactions between compounds and targets. The size of each node is positively correlated with the degree value. Abbreviations: QF, Qingfei oral liquid; RSV, respiratory syncytial virus.
FIGURE 4
FIGURE 4
PPI network and enrichment pathway analysis for QF in the treatment of RSV-induced lung inflammation. (A) PPI network of core targets. Circle nodes represent core targets and edges represent interactions between them. The size of each node is positively correlated with the degree value. (B) KEGG pathway analysis of core targets. The top 20 pathways are ranked according to gene count and adjusted p-value (ap<0.05). (C) GO enrichment analysis of core targets. Circle nodes represent sub-branches of the main pathways. Nodes of the same color are clustered into one functional group. The name of each biofunction is shown next to the group with the same color. Edges represent interactions between sub-branches of one cluster. Abbreviations: QF, Qingfei oral liquid; RSV, respiratory syncytial virus; PPI, protein interaction.
FIGURE 5
FIGURE 5
Effect of QF on lipid metabolism in lung tissues of mice with RSV-induced lung inflammation. (A) PCA score plot based on lipid profiles among control (C), model (M), and therapy (QF) groups. (B) Venn diagram of differential metabolites identified in M vs. C and QF vs. M comparisons. (C) Heatmaps of differential lipid metabolites up-regulated in M vs. C groups and down-regulated in QF vs. M groups. (D) Heatmaps of differential lipid metabolites down-regulated in M vs. C groups and up-regulated in QF vs. M group. (E) Boxplot of the relative concentrations of diglycerides (DAGs) in control (C), model (M), and therapy (QF) groups. * Compared with control group, # compared with model group, *p < 0.05, **p < 0.01, # p < 0.05, ## p < 0.01). Abbreviations: QF, Qingfei oral liquid; RSV, respiratory syncytial virus; DAG diacylglycerol.
FIGURE 6
FIGURE 6
Effect of QF on the activity of the PI3K/AKT/mTOR/Lipin-1 signaling pathway in lung tissues of mice with RSV-induced lung inflammation. (A) Protein expression of phosphatidylinositol 3-kinase (PI3K), phospho-phosphatidylinositol 3-kinase (p-PI3K), protein kinase B (AKT), phospho-protein kinase B (p-AKT), mammalian target of rapamycin (mTOR), phospho-mammalian target of rapamycin (p-mTOR), and β-actin in control (C), model (M), and therapy (QF) groups. The densitometry value of each phosphorylated protein was normalized against its total abundance. Values are expressed as mean ± SEM (n = 4; * compared with control group, # compared with model group, **p < 0.01, ***p < 0.001, ## p < 0.01). (B) Immunohistochemical staining of Lipin-1 protein in lung tissues of mice in control (C), model (M), and therapy (QF) groups (200 ×magnification). (C) mRNA expression level of lipin-1 protein in control (C), model (M), and therapy (QF) groups. Compared with control group, # compared with model group. **p < 0.01, ## p < 0.01. Abbreviations: QF, Qingfei oral liquid; RSV, respiratory syncytial virus.
FIGURE 7
FIGURE 7
Effect of QF on DAG-induced autophagy and inflammation in lung tissues of mice with RSV-induced lung inflammation. (A) Protein expression of Beclin-1, Atg5, LC3B (I, II), and β-actin in control (C), model (M), and therapy (QF) groups. Densitometry values of Beclin-1 and Atg5 were normalized against β-actin to determine relative protein expression values. The densitometry value of LC3BII was normalized against LC3BI. Values are expressed as mean ± SEM (n = 3; * compared with control group, # compared with model group, *p < 0.05, **p < 0.01, ***p < 0.001, # p < 0.05, ### p < 0.001). (B) VPS34 protein expression in control (C), model (M), and therapy (QF) groups. The densitometry value of VPS34 was normalized against β-actin. Values are expressed as mean ± SEM (n = 3; * compared with control group, # compared with model group, **p < 0.01, # p < 0.05). (C) Transcription levels of pro-inflammatory cytokines among control (C), model (M), and therapy (QF) groups. Values are expressed as mean ± SEM (n = 6; * compared with control group, # compared with model group, *p < 0.05, *** p < 0.001, # p < 0.05, ### p < 0.001). Abbreviations: QF, Qingfei oral liquid; RSV, respiratory syncytial virus.
FIGURE 8
FIGURE 8
Overall regulation mediated by QF in the treatment of RSV pneumonia. Abbreviations: QF, Qingfei oral liquid; RSV, respiratory syncytial virus.

Similar articles

Cited by

References

    1. Amberger J. S., Hamosh A. (2017). Searching Online Mendelian Inheritance in Man (OMIM): A Knowledgebase of Human Genes and Genetic Phenotypes. Curr. Protoc. Bioinformatics 58, 11–121. 10.1002/cpbi.27 - DOI - PMC - PubMed
    1. Bianchini S., Silvestri E., Argentiero A., Fainardi V., Pisi G., Esposito S. (2020). Role of Respiratory Syncytial Virus in Pediatric Pneumonia. Microorganisms 8 (12), 2048–2114. 10.3390/microorganisms8122048 - DOI - PMC - PubMed
    1. Borchers A. T., Chang C., Gershwin M. E., Gershwin L. J. (2013). Respiratory Syncytial Virus-Aa Comprehensive Review. Clin. Rev. Allergy Immunol. 45 (3), 331–379. 10.1007/s12016-013-8368-9 - DOI - PMC - PubMed
    1. Caberlotto L., Lauria M. (2015). Systems Biology Meets -omic Technologies: Novel Approaches to Biomarker Discovery and Companion Diagnostic Development. Expert Rev. Mol. Diagn. 15 (2), 255–265. 10.1586/14737159.2015.975214 - DOI - PubMed
    1. Chen J., Chen J., Huang J., Li Z., Gong Y., Zou B., et al. (2019). HIF-2α Upregulation Mediated by Hypoxia Promotes NAFLD-HCC Progression by Activating Lipid Synthesis via the PI3K-AKT-mTOR Pathway. Aging (Albany NY) 11 (23), 10839–10860. 10.18632/aging.102488 - DOI - PMC - PubMed