. 2021 Dec 2:12:750468.
doi: 10.3389/fphys.2021.750468. eCollection 2021.

Elder Mice Exhibit More Severe Degeneration and Milder Regeneration in Temporomandibular Joints Subjected to Bilateral Anterior Crossbite

Affiliations

Elder Mice Exhibit More Severe Degeneration and Milder Regeneration in Temporomandibular Joints Subjected to Bilateral Anterior Crossbite

Yuejiao Zhang et al. Front Physiol. .

Abstract

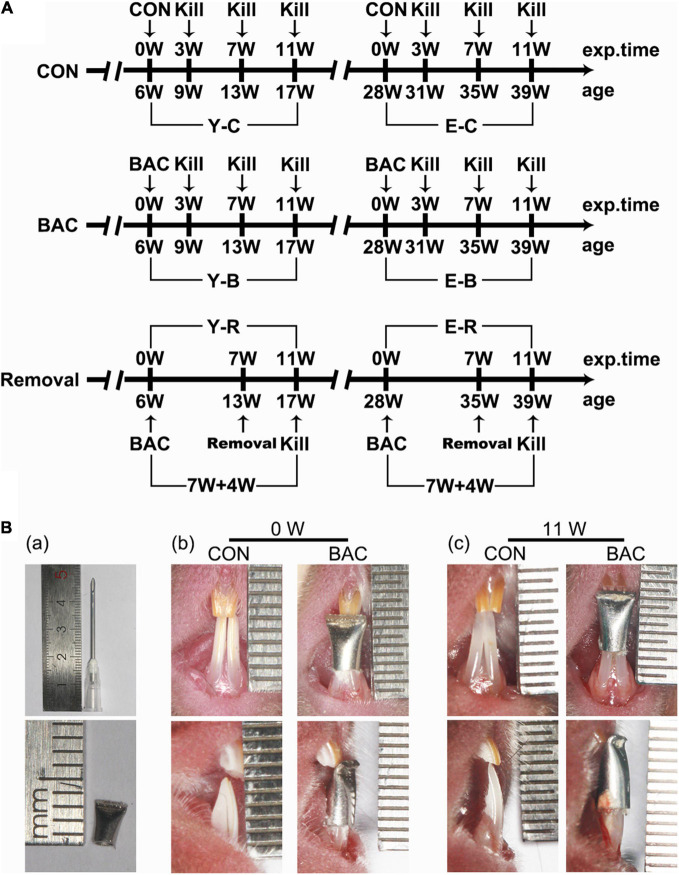
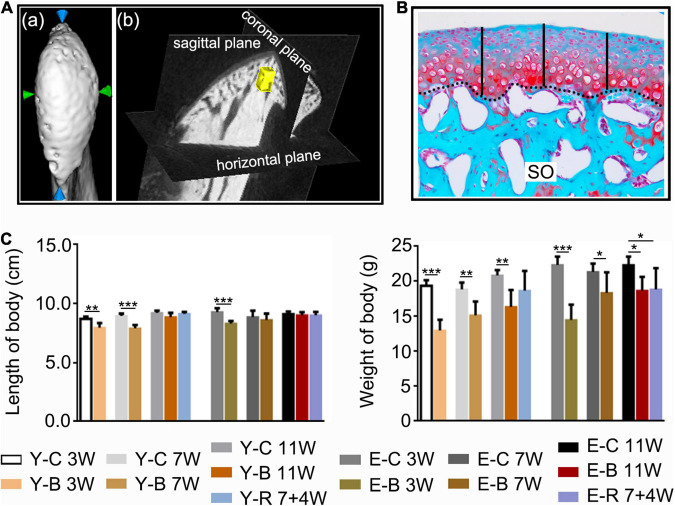
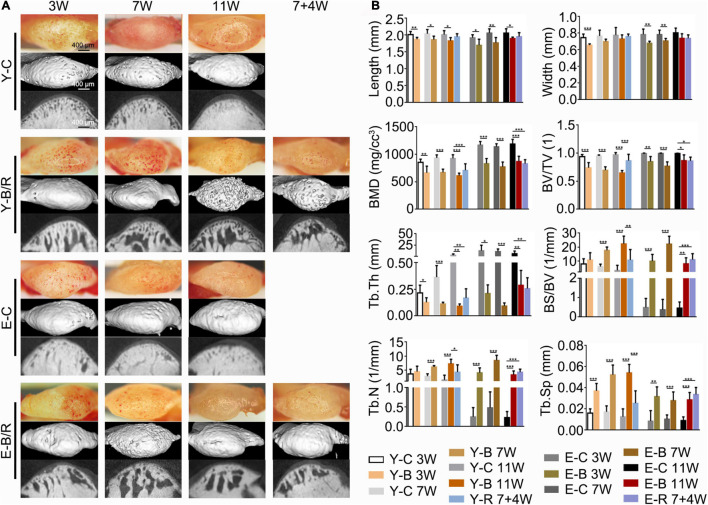
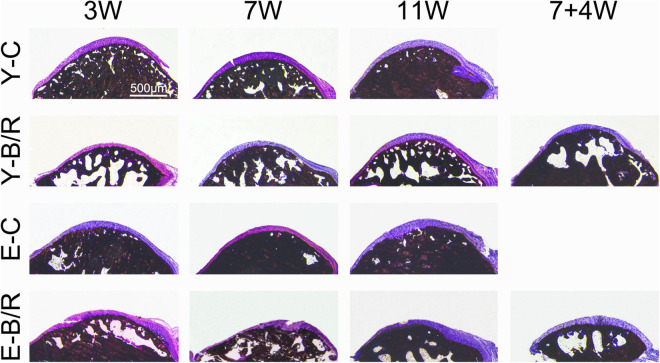
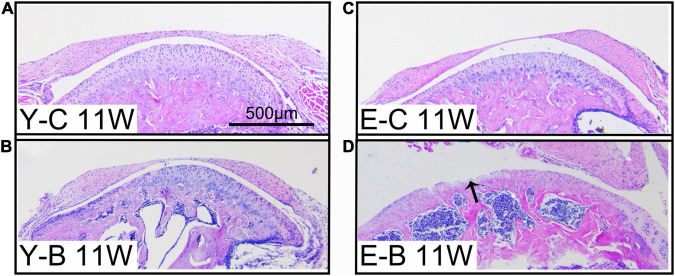
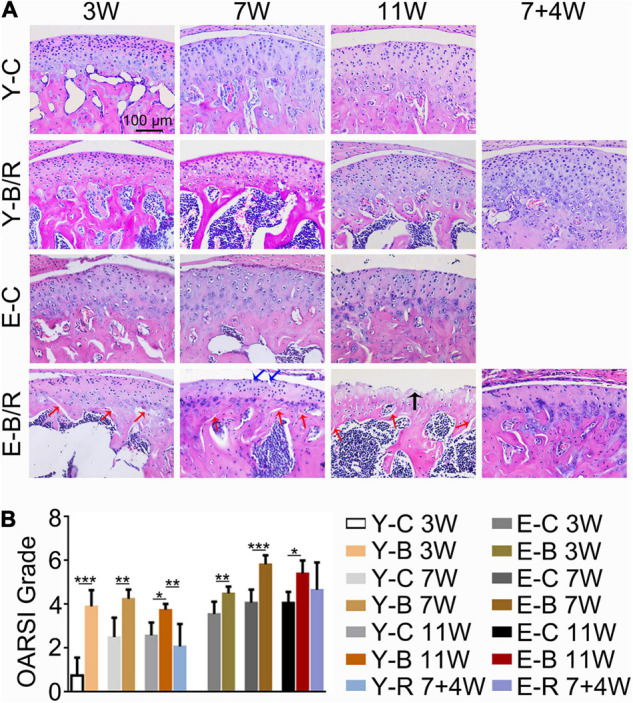
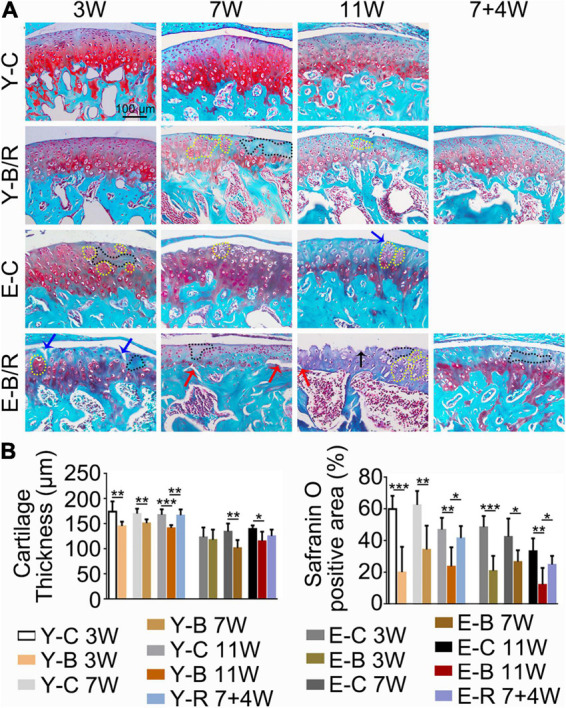
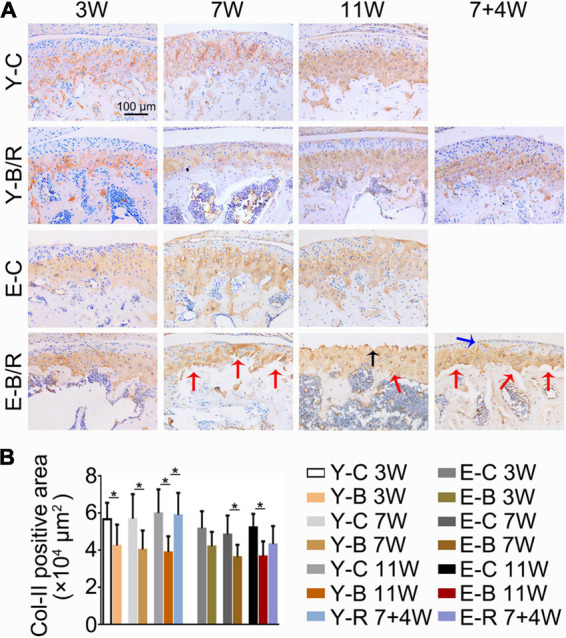
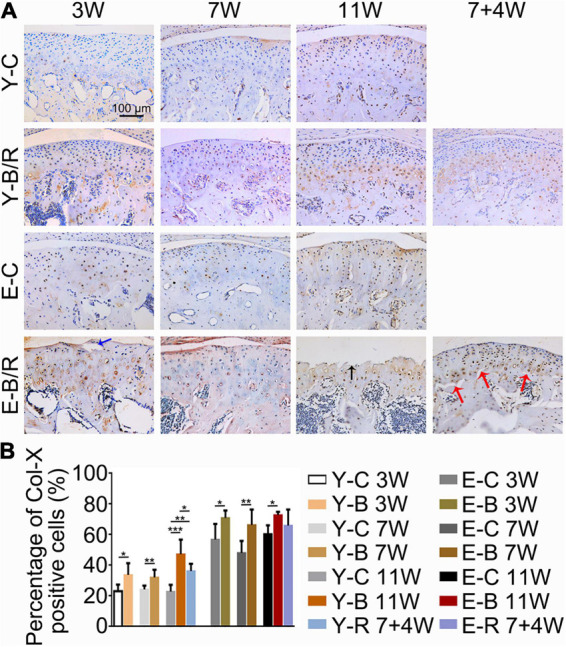
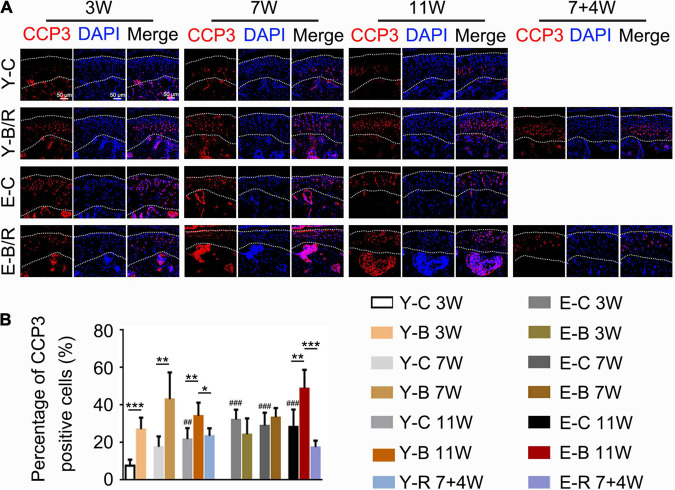
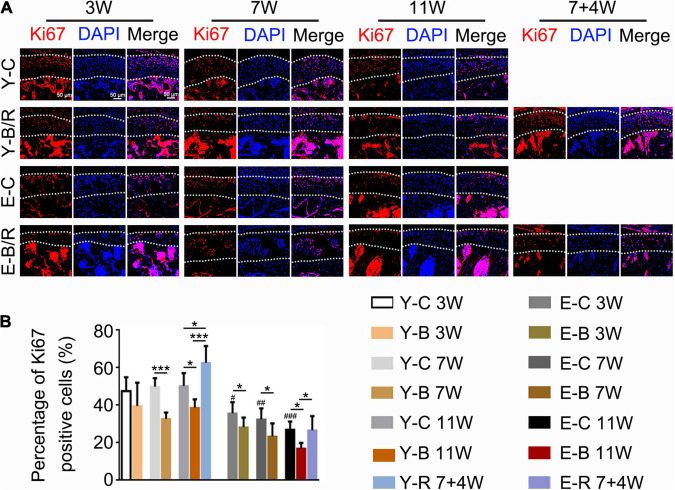
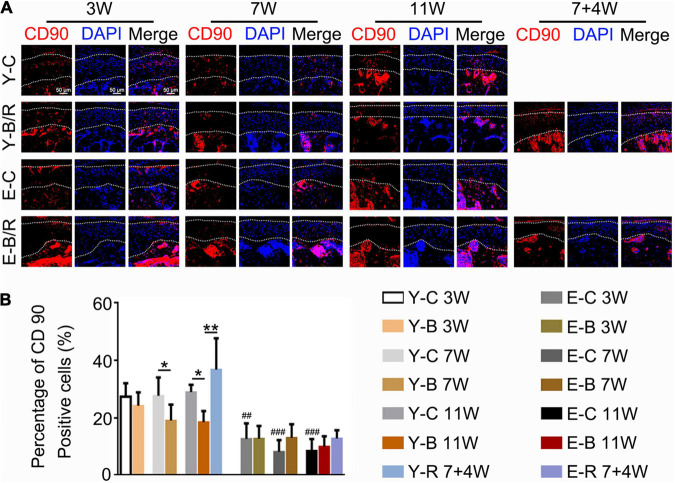
Temporomandibular joints (TMJs) have a biomechanical relationship with dental occlusion. Aberrant occlusion initiates degenerative remodeling responses in TMJ condyles. Aging is a promoting factor of osteoarthritis (OA) development. The aim of this study was to assess the effect of aging on degenerative remodeling in TMJ condyles in response to occlusal biomechanical stimulation caused by the installation of aberrant prostheses and observe rehabilitation after their removal. The experiments involved 84 female C57BL/6J mice (42 at 6 weeks old and 42 at 28 weeks old). A bilateral anterior crossbite (BAC) model was developed, and the TMJs were sampled at 3, 7, and 11 weeks. BAC was removed at 7 weeks in a subset of mice, which accepted BAC treatment at 6 week of age, and maintained for another 4 weeks after BAC removal. TMJ changes were assessed with micro-CT, histomorphology, immunohistochemistry (IHC), and immunofluorescence staining assays. The results showed that BAC induced typical OA-like TMJ lesions that were more severe in the elder groups as evaluated by the acellular zones, clustered chondrocytes, fissures between cartilage and subchondral bone, reductions in matrix amount and the cartilage thickness as revealed by histomorphological measurements, and subchondral bone loss as detected on micro-CT images. IHC indicated significant increases in cleaved caspase-3-expressing cells and decreases in ki67-positive cells in the BAC groups. There were obvious age-dependent changes in the numbers of superficial zone cells and CD90-expressing cells. Supportively, cleaved caspase-3-expressing cells obviously increased, while ki67-expressing cells significantly decreased with aging. In the elder BAC groups, the superficial zone cells such as CD90-expressing cells were greatly reduced. At 11 weeks, the superficial zone cells were almost non-existent, and there were clear serrated injuries on the cartilage surface. BAC removal attenuated the degenerative changes in the condylar cartilage and subchondral bone. Notably, the rescue effect was more pronounced in the younger animals. Our findings demonstrate the impacts of aging on both TMJ degenerative changes in response to BAC and regenerative changes following BAC removal. The reduced number of chondro-progenitor cells in aged TMJ cartilage provides an explanation for this age-related decline in TMJ rehabilitative behaviors.

Keywords: aging; cartilage; occlusion; subchondral bone; temporomandibular joint.


Conflict of interest statement

The authors declare that the research was conducted in the absence of any commercial or financial relationships that could be construed as a potential conflict of interest.

Figures

FIGURE 1
FIGURE 1
(A) The timeline of the entire experiment. (B) Representative pinhead and the pinhead produced metal tube (a) used to change the bite of incisors, and frontal views of the incisors in the younger groups with and without the tubed bilateral anterior crossbite (BAC) relationship at 0 week (b) and 11 weeks (c) after modeling. exp. Time, experimental time point; age, the natural age of the mice; CON, control group; BAC, bilateral anterior crossbite group; Removal, BAC removal group. Y-C, younger control group; Y-B, younger BAC group; Y-R, younger removal group; E-C, elder control group; E-B, elder BAC group; E-R, elder removal group. 3, 7, and 11 W: 3-, 7-, and 11-week after BAC installation; 7 + 4 W: 7 weeks of BAC installation followed by the 4-week removal of BAC.
FIGURE 2
FIGURE 2
(A) The measuring methods for condylar length and width (a), and for the measured regions of interest (ROI, 0.25 mm × 0.25 mm × 0.25 mm) (yellow block) of the subchondral trabecular bone (b) using the software provided by the micro-CT manufacturer. (B) The histomorphology measuring method of the cartilage thickness (black-dotted line for the osteochondral interface). Safranin O staining. Middle third of the sagittal sections were selected, three locations at the quintuple points were measured as indicated by the black vertical short lines. (C) Comparisons of body length and body weight between the indicated groups at the different time points. Data are presented as mean ± SD. Unpaired t-test was used for comparisons between the age-matched control and BAC groups. One-way ANOVA was used for comparisons among the age-matched control, BAC, and BAC removal groups. n = 6. *P < 0.05; **P < 0.01 and ***P < 0.001 for the differences between all BAC and removal groups and the age-matched control groups. SO, safranin O; FC, full zone cartilage. For grouping and time points, please refer to Figure 1A.
FIGURE 3
FIGURE 3
(A) Representative gross morphology (bars = 400 μm) and the micro-CT images (bars = 400 μm) of the mandibular condyles. (B) Comparisons of the measured parameters as indicated between the BAC groups and the age-matched control groups. Data are presented as mean ± SD. Unpaired t-test was used for comparisons between the age-matched control and BAC groups. One-way ANOVA was used for comparisons among the age-matched control, BAC, and BAC removal groups. n = 6. *P < 0.05; **P < 0.01 and ***P < 0.001 for the differences between all BAC and removal groups and the age-matched control groups. BMD, bone mineral density; BV/TV, the ratio of bone volume to tissue volume; Tb.Th, trabecular thickness; BS/BV, the ratio of bone surface area to bone volume; Tb.N, trabecular number; Tb.Sp, trabecular separation. For the grouping and time points, please refer to Figure 1A.
FIGURE 4
FIGURE 4
Representative von Kossa (VK) staining. Bars = 500 μm. For grouping and time points, please refer to Figure 1A.
FIGURE 5
FIGURE 5
Typical images of younger (Y-) and elder (E-) mice in the control (-C) and BAC (-B) groups at 11 weeks after the BAC operation, labeled as Y-C 11W (A), Y-B 11W (B), E-C 11W (C), and E-B 11W (D), respectively. Bars = 500 μm.
FIGURE 6
FIGURE 6
(A) Representative hematoxylin and eosin (HE) staining. The black arrow indicates the serrated injury at the surface of the cartilage. The blue arrows indicate the fissures at the surface of cartilage. The red arrows indicate the fissures between cartilage and subchondral bone. Cell-free areas are obvious in the E-B/R groups. Bars = 100 μm. (B) Comparison of the OARSI grade between the groups. Data are presented as mean ± SD. Unpaired t-test was used for comparisons between the age-matched control and BAC groups. One-way ANOVA was used for comparisons among the age-matched control, BAC, and BAC removal groups. n = 6. *P < 0.05; **P < 0.01 and ***P < 0.001 for the differences between all BAC and removal groups and the age-matched control groups. For grouping and time points, please refer to Figure 1A.
FIGURE 7
FIGURE 7
(A) Representative Safranin O (SO) staining. The black arrow indicates the serrated injury at the surface of the cartilage. The blue arrows indicate the fissures at the surface of the cartilage. The red arrows indicate the fissures between cartilage and subchondral bone. Cells in the black-dotted areas are lacking. Cells in the yellow dotted areas are clustered. Bars = 100 μm. (B) Comparison of the cartilage thickness and the size of the SO-positive area between the groups. Data are presented as mean ± SD. Unpaired t-test was used for comparisons between the age-matched control and BAC groups. One-way ANOVA was used for comparisons among the age-matched control, BAC, and BAC removal groups. n = 6. *P < 0.05; **P < 0.01 and ***P < 0.001 for the differences between all BAC and removal groups and the age-matched control groups. For grouping and time points, please refer to Figure 1A.
FIGURE 8
FIGURE 8
(A) Representative immunohistochemical staining of type II collagen (Col-II). The black arrow indicates the serrated injury at the surface of the cartilage. The blue arrow indicates the fissure at the surface of cartilage. The red arrows indicate the fissures between the cartilage and subchondral bone. Bars = 100 μm. (B) Comparisons of Col-II positive area between the groups. Data are presented as mean ± SD. Unpaired t-test was used for comparisons between the age-matched control and BAC groups. One-way ANOVA was used for comparisons among the age-matched control, BAC, and BAC removal groups. n = 6. *P < 0.05 for the differences between all BAC and removal groups and the age-matched control groups. For grouping and time points, please refer to Figure 1A.
FIGURE 9
FIGURE 9
(A) Representative immunohistochemical staining of type X collagen (Col-X). The black arrow indicates the serrated injury at the surface of the cartilage. The blue arrow indicates the fissure at the surface of cartilage. The red arrows indicate the fissures between cartilage and subchondral bone. Bars = 100 μm. (B) Comparisons of the percentages of Col-X positive cells in the cartilage between the groups. Data are presented as mean ± SD. Unpaired t-test was used for comparisons between the age-matched control and BAC groups. One-way ANOVA was used for comparisons among the age-matched control, BAC, and BAC removal groups. n = 6. *P < 0.05; **P < 0.01 and ***P < 0.001 for the differences between all BAC and removal groups and the age-matched control groups. For grouping and time points, please refer to Figure 1A.
FIGURE 10
FIGURE 10
(A) Representative cleaved Caspase-3 (CCP3) immunofluorescence staining. Bars = 50 μm. (B) Comparisons of the percentages of CCP3-positive cells in the cartilage between the groups. Data are presented as mean ± SD. Unpaired t-test was used for comparisons between the age-matched control and BAC groups. One-way ANOVA was used for comparisons among the age-matched control, BAC, and BAC removal groups, and the comparisons among the six time points in control groups. n = 6. *P < 0.05, **P < 0.01 and ***P < 0.001 for the differences between all BAC and removal groups and the age-matched control groups. ##P < 0.01, ###P < 0.001 for the differences between each time points control groups and the younger 3-week control group. For grouping and time points, please refer to Figure 1A.
FIGURE 11
FIGURE 11
(A) Representative Ki67 immunofluorescence staining. Bars = 50 μm. (B) Comparisons of the percentage of Ki67-positive cells in the cartilage between the groups. Data are presented as mean ± SD. Unpaired t-test was used for comparisons between the age-matched control and BAC groups. One-way ANOVA was used for comparisons among the age-matched control, BAC, and BAC removal groups, and the comparisons among the six time points in control groups. n = 6. *P < 0.05, ***P < 0.001 for the differences between all BAC and removal groups and the age-matched control groups. #P < 0.05, ##P < 0.01, ###P < 0.001 for the differences between each time points control groups and the younger 3-week control group. For the grouping and time points, please refer to Figure 1A.
FIGURE 12
FIGURE 12
(A) Representative CD90 immunofluorescence staining. Bars = 50 μm. (B) Comparisons of the percentage of CD90-positive cells in the cartilage between the groups. Data are presented as mean ± SD. Unpaired t-test was used for comparisons between the age-matched control and BAC groups. One-way ANOVA was used for comparisons among the age-matched control, BAC, and BAC removal groups, and the comparisons among the six time points in control groups. n = 6. *P < 0.05, **P < 0.01 for the differences between all BAC and removal groups and the age-matched control groups. ##P < 0.01, ###P < 0.001 for the differences between each time points control groups and the younger 3-week control group. For grouping and time points, please refer to Figure 1A.

Similar articles

Cited by

References

    1. Ahmad M., Schiffman E. L. (2016). Temporomandibular Joint Disorders and Orofacial Pain. Dent. Clin. North Am. 60 105–124. 10.1016/j.cden.2015.08.004 - DOI - PMC - PubMed
    1. Candela M. E., Yasuhara R., Iwamoto M. (2014). Resident mesenchymal progenitors of articular cartilage. Matrix Biol. 39 44–49. 10.1016/j.matbio.2014.08.015 - DOI - PMC - PubMed
    1. Cheung T. H., Rando T. A. (2013). Molecular regulation of stem cell quiescence. Nat. Rev. Mol. Cell Biol. 14 329–340. 10.1038/nrm3591 - DOI - PMC - PubMed
    1. Dowthwaite G. P., Bishop J. C., Redman S. N., Khan I. M., Rooney P., Evans D. J., et al. (2004). The surface of articular cartilage contains a progenitor cell population. J. Cell Sci. 117 889–897. 10.1242/jcs.00912 - DOI - PubMed
    1. Duan J., Zhang J., Yang H., Liu Q., Xie M., Zhang M. (2021). Mineral deposition intervention through reduction of phosphorus intake suppresses osteoarthritic lesions in temporomandibular joint. Osteoarthr. Cartilage. 12 S1063–S4584. 10.1016/j.joca.2021.05.061 - DOI - PubMed