. 2021 Dec 3:12:754570.
doi: 10.3389/fphys.2021.754570. eCollection 2021.

Early Hyperdynamic Sepsis Alters Coronary Blood Flow Regulation in Porcine Fecal Peritonitis

Affiliations

Early Hyperdynamic Sepsis Alters Coronary Blood Flow Regulation in Porcine Fecal Peritonitis

Céline Boudart et al. Front Physiol. .

Abstract

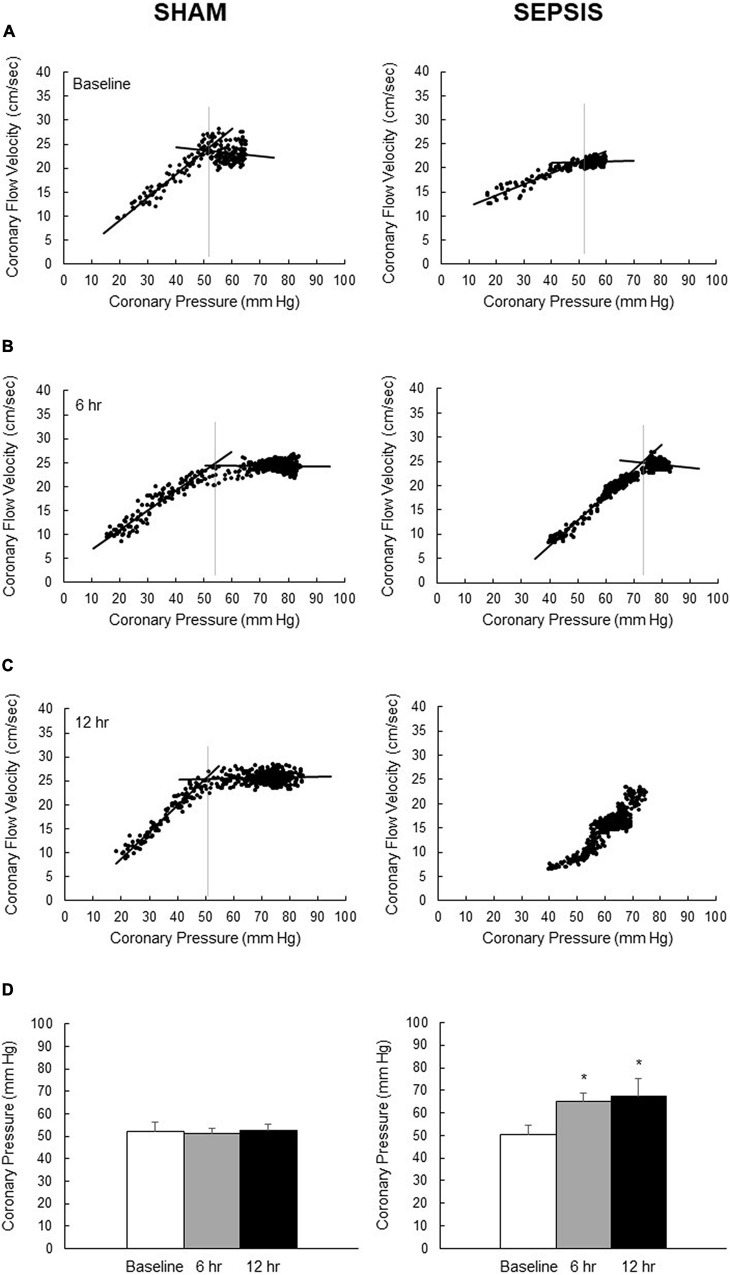
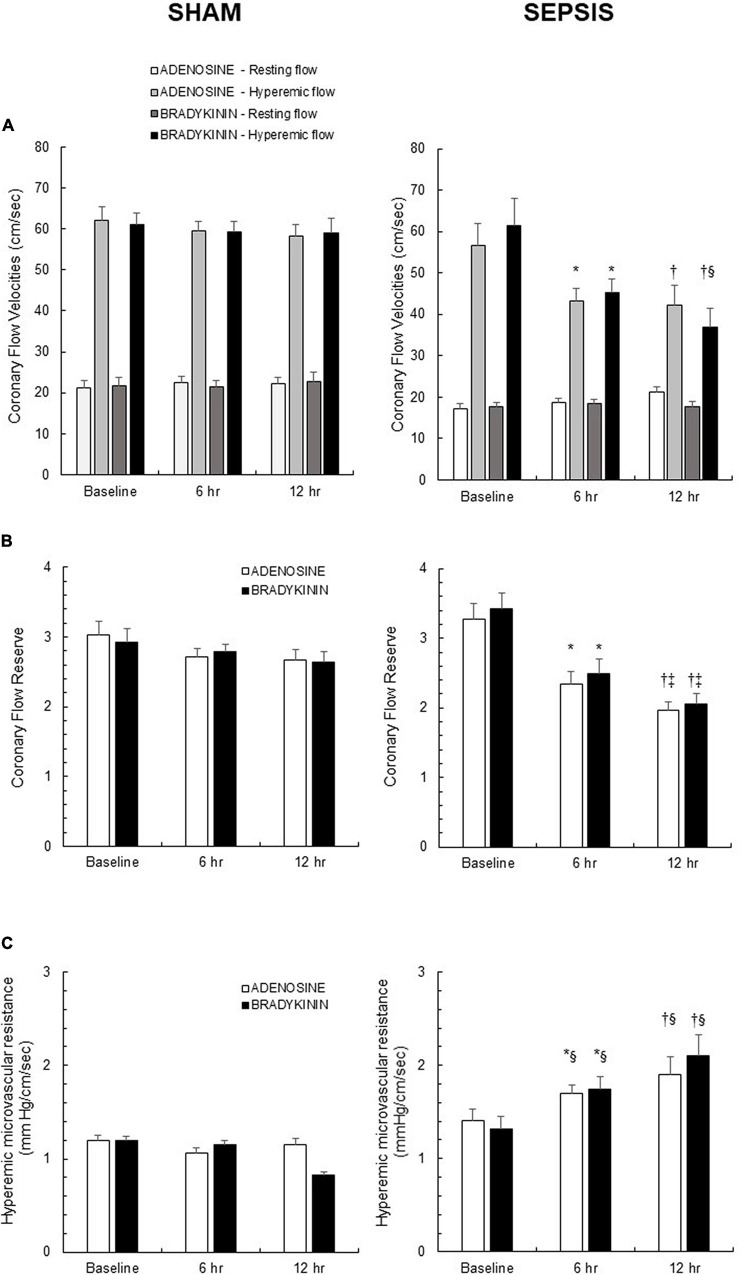
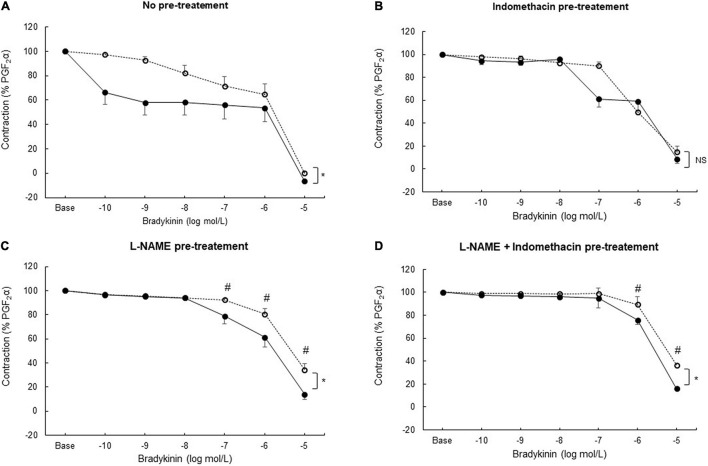
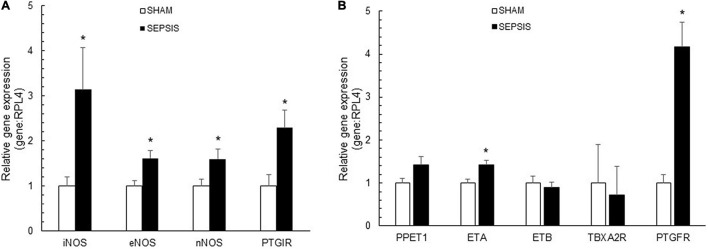
Background: Sepsis is a common condition known to impair blood flow regulation and microcirculation, which can ultimately lead to organ dysfunction but such contribution of the coronary circulation remains to be clarified. We investigated coronary blood flow regulatory mechanisms, including autoregulation, metabolic regulation, and endothelial vasodilatory response, in an experimental porcine model of early hyperdynamic sepsis. Methods: Fourteen pigs were randomized to sham (n = 7) or fecal peritonitis-induced sepsis (n = 7) procedures. At baseline, 6 and 12 h after peritonitis induction, the animals underwent general and coronary hemodynamic evaluation, including determination of autoregulatory breakpoint pressure and adenosine-induced maximal coronary vasodilation for coronary flow reserve and hyperemic microvascular resistance calculation. Endothelial-derived vasodilatory response was assessed both in vivo and ex vivo using bradykinin. Coronary arteries were sampled for pathobiological evaluation. Results: Sepsis resulted in a right shift of the autoregulatory breakpoint pressure, decreased coronary blood flow reserve and increased hyperemic microvascular resistance from the 6th h after peritonitis induction. In vivo and ex vivo endothelial vasomotor function was preserved. Sepsis increased coronary arteries expressions of nitric oxide synthases, prostaglandin I2 receptor, and prostaglandin F receptor. Conclusion: Autoregulation and metabolic blood flow regulation were both impaired in the coronary circulation during experimental hyperdynamic sepsis, although endothelial vasodilatory response was preserved.

Keywords: autoregulation; coronary blood flow; endothelial function; metabolic regulation; microcirculation; sepsis.


Conflict of interest statement

The authors declare that the research was conducted in the absence of any commercial or financial relationships that could be construed as a potential conflict of interest.

Figures

FIGURE 1
FIGURE 1
Coronary pressure–flow velocities relationship for the determination of autoregulatory breakpoint pressure. Representative pictures of overtime evolution, beat par beat, of pressure–flow datapoints (black dots) following inflation of the intracoronary balloon to determine the autoregulatory plateau and the ischemic pressure–flow relationship (black lines) and its autoregulatory breakpoint (vertical gray lines) for one representative animal from the sham group (left panel) and one representative animal from the sepsis group (right panel) groups at baseline (A), 6 h (B) and 12 h (C) after sepsis induction. (D) Calculated autoregulatory breakpoint pressure at baseline (whites bars), 6 h (gray bars) and 12 h (black bars) after sepsis induction in sham (left panel; n = 4–7) and sepsis (right panel; n = 3–7) groups. At 12 h, there were missing data in both groups: the pressure was not sufficiently lowered to calculate the autoregulatory breakpoint for three animals of the sham group; in the sepsis group, the signal was poor for one animal, one pig presented arrhythmia, and two pigs presented a linear pressure–flow relationship between 30 and 75 mmHg with no autoregulatory breakpoint identifiable in this range. Results are expressed as mean ± SEM. *p < 0.01, 6- and 12-h versus baseline in the same group.
FIGURE 2
FIGURE 2
In vivo coronary vasomotor response induced by endothelium-independent (adenosine) and endothelium-dependent (bradykinin) vasodilators. (A) Resting and hyperemic flows induced by administration of adenosine (white and light gray bars, respectively), and of bradykinin (dark gray and black bars, respectively) in sham (left panel; n = 7) and sepsis (right panel; n = 7) groups. (B) Coronary flow reserve, calculated as the ratio of hyperemic-to-resting flows and representing the metabolic adaptive mechanisms after adenosine (white bars) and bradykinin (black bars) administration in sham (left panel; n = 7) and sepsis (right panel; n = 7) groups. (C) Hyperemic microvascular resistance, calculated as the ratio of coronary pressure-to-hyperemic flow after adenosine (white bars) and bradykinin (black bars) administration in sham (left panel; n = 7) and sepsis (right panel; n = 7) groups. Results are expressed as mean ± SEM. *p < 0.05 6 h vs. baseline; p < 0.05 12 h vs. baseline; p < 0.05 12 vs. 6 h after sepsis induction in the same group; § p < 0.05 sepsis vs. sham group for the same timing.
FIGURE 3
FIGURE 3
Ex vivo coronary vasomotor response. Relaxing concentration–response curves to bradykinin (tested from 10–10 to 10–5 mol/L) after prostaglandin F2α (PGF2α; 10–5 mol/L) precontraction in coronary arteries rings from sham (open circles; n = 25–27 coronary rings from seven pigs) and sepsis groups (solid circles; n = 21–24 rings from seven pigs) in the absence of pre-treatment (A) and after pre-treatment with a cyclooxygenase inhibitor (indomethacin;10–5 mol/L) (B); with a nitric oxide synthase inhibitor (L-NAME; 2.5. 10–4 mol/L) (C); with both indomethacin (10–5 mol/L) and L-NAME (2.5. 10–4 mol/L) pre-treatment (D). Relaxation response was expressed as the percentage of the maximal contraction response to PGF. Results are presented as mean ± SEM. *p < 0.05 sepsis vs. sham groups (global curve analysis); #p < 0.05 sepsis vs. sham groups (point-by-point analysis). NS: not significant.
FIGURE 4
FIGURE 4
Coronary artery expressions of vasoactive molecules. Relative gene expressions of inducible (iNOS or NOS2), endothelial (eNOS or NOS3), and neuronal (nNOS or NOS1) nitric oxide synthase and prostaglandin I receptor (PTGIR), implicated in vasodilatory pathways (A) and relative gene expression of prostaglandin F receptor (PTGFR), endothelin receptor type A (ETA) and B (ATB), thromboxane A2 receptor (TBXA2R), implicated in vasoconstrictor pathways (B), in coronary arteries from sham (white bars; n = 7) and sepsis (black bars; n = 7) groups. Results are expressed as mean ± SEM. *p < 0.05 sepsis vs. sham groups.
FIGURE 5
FIGURE 5
Coronary pressure–flow relationship and its regulation. When autoregulated, the coronary pressure–flow relationship describes a sigmoid curve, where the coronary flow remained constant for a wide range of perfusion pressure, corresponding to the autoregulatory plateau. The autoregulatory breakpoint represents the lower pressure limit below which the autoregulation fails, and the flow becomes directly dependent on the pressure. When the metabolic demand increases, the coronary blood flow increases through the metabolic regulation, corresponding to an upward shift of the autoregulatory plateau. The hyperemic flow represents the coronary blood flow during maximal vasodilation when microvascular resistance is minimal. The slope of this hyperemic flow can be reduced (dashed line) when the microvascular resistance is increased or by endothelial dysfunction. The coronary flow reserve (CFR) represents the remaining possibilities to adapt the coronary blood flow to the myocardial requirement and is so defined as the ration of the hyperemic flow to the resting flow. However, since at maximal vasodilation the coronary flow is directly pressure-dependent, and so also the calculated coronary flow reserve, the hyperemic microvascular resistance (HMR) is proposed as another more reliable pressure–flow derived-index. The hyperemic microvascular resistance represents the microvascular resistance during maximal vasodilation and is defined as the coronary pressure to hyperemic flow.

Similar articles

Cited by

References

    1. Antonucci E., Fiaccadori E., Donadello K., Taccone F. S., Franchi F., Scolletta S. (2014). Myocardial depression in sepsis: from pathogenesis to clinical manifestations and treatment. J. Crit. Care 29 500–511. 10.1016/j.jcrc.2014.03.028 - DOI - PubMed
    1. Basu S. (2007). Novel cyclooxygenase-catalyzed bioactive prostaglandin F2alpha from physiology to new principles in inflammation. Med. Res. Rev. 27 435–468. 10.1002/med.20098 - DOI - PubMed
    1. Beesley S. J., Weber G., Sarge T., Nikravan S., Grissom C. K., Lanspa M. J., et al. (2018). Septic cardiomyopathy. Crit. Care Med. 46 625–634. 10.1097/CCM.0000000000002851 - DOI - PubMed
    1. Bolz S. S., Pohl U. (1997). Indomethacin enhances endothelial NO release–evidence for a role of PGI2 in the autocrine control of calcium-dependent autacoid production. Cardiovasc. Res. 36 437–444. 10.1016/s0008-6363(97)00197-1 - DOI - PubMed
    1. Boudart C., Su F., Herpain A., Creteur J., Naeije R., Brimioulle S., et al. (2020). An intact animal model for the assessment of coronary blood flow regulation “Coronary blood flow regulation”. Physiol. Rep. 8:e14510. 10.14814/phy2.14510 - DOI - PMC - PubMed

LinkOut - more resources