. 2021 Dec 2:12:795173.
doi: 10.3389/fmicb.2021.795173. eCollection 2021.

Genomic Analysis of Global Staphylococcus argenteus Strains Reveals Distinct Lineages With Differing Virulence and Antibiotic Resistance Gene Content

Affiliations

Genomic Analysis of Global Staphylococcus argenteus Strains Reveals Distinct Lineages With Differing Virulence and Antibiotic Resistance Gene Content

Cosmika Goswami et al. Front Microbiol. .

Abstract

Infections due to Staphylococcus argenteus have been increasingly reported worldwide and the microbe cannot be distinguished from Staphylococcus aureus by standard methods. Its complement of virulence determinants and antibiotic resistance genes remain unclear, and how far these are distinct from those produced by S. aureus remains undetermined. In order to address these uncertainties, we have collected 132 publicly available sequences from fourteen different countries, including the United Kingdom, between 2005 and 2018 to study the global genetic structure of the population. We have compared the genomes for antibiotic resistance genes, virulence determinants and mobile genetic elements such as phages, pathogenicity islands and presence of plasmid groups between different clades. 20% (n = 26) isolates were methicillin resistant harboring a mecA gene and 88% were penicillin resistant, harboring the blaZ gene. ST2250 was identified as the most frequent strain, but ST1223, which was the second largest group, contained a marginally larger number of virulence genes compared to the other STs. Novel S. argenteus pathogenicity islands were identified in our isolates harboring tsst-1, seb, sec3, ear, selk, selq toxin genes, as well as chromosomal clusters of enterotoxin and superantigen-like genes. Strain-specific type I modification systems were widespread which would limit interstrain transfer of genetic material. In addition, ST2250 possessed a CRISPR/Cas system, lacking in most other STs. S. argenteus possesses important genetic differences from S. aureus, as well as between different STs, with the potential to produce distinct clinical manifestations.

Keywords: CRISPR/Cas; Staphylococcus argenteus; Staphylococcus argenteus pathogenicity islands; antibiotic resistance; virulence genes.


Conflict of interest statement

The authors declare that the research was conducted in the absence of any commercial or financial relationships that could be construed as a potential conflict of interest.

Figures

FIGURE 1
FIGURE 1
Distribution and Relatedness of Global S. argenteus strains (A) Distribution of S. argenteus ST within the global collection studied. The proportion of each ST within each location is shown within the overlaid pie chart. (B) Table showing the number of shared core genes (found in ≥99% of a specific strain) between different pairs of S. argenteus STs. (C) Non-metric Multi-dimensional Scaling (NMDS) plot for gene diversity of accessory genes within and between dominant STs, based on Jaccard distance. Each dot represents an isolate colored with its ST according to the legend in (A). (D) Gene accumulation curves for different STs of S. argenteus. STs are colored according to the key in panel (A). For ST2250, the Heaps co-efficient is 0.69, indicating an open genome.
FIGURE 2
FIGURE 2
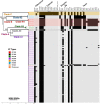
Phylogenetic relationship of global S. argenteus strains related to content of antibiotic resistance genes, virulence determinants, and phages. The phylogenetic tree shows relationships between the strains based on core gene SNPs. Different clades, the ST, year of isolation and country of origin are as shown. The presence of antibiotic resistance determinants, selected virulence genes, and phage integrases with SaPI island integrase present in STs are indicated to the right of the tree; presence of these factors is indicated by a black rectangle. Boxed areas highlight specific ABR (red) or virulence genes (green). Bootstrap support for the major clades is shown from 1,000 bootstrap trees. The scale bar shows the number of SNPs corresponding to branch length.
FIGURE 3
FIGURE 3
Comparison of virulence gene content in different STs. The presence and absence of specific virulence genes within each isolate are shown by black rectangles. Genes are grouped according to their broad functions as shown. SS indicates secretory system. The phylogenetic tree shows relationships between the strains based on core gene SNPs. Bootstrap support for the major clades is shown from 1,000 bootstrap trees. The scale bar shows the number of SNPs corresponding to branch length.
FIGURE 4
FIGURE 4
vSAα and vSAβ elements in S. argenteus. The figure shows the gene composition of vSAα (A) and vSAβ (B) elements in the strains of S. argenteus indicated. In panel (A), a representative member from each ST is shown. Gene functions are color coded as indicated. The degree of similarity between the different S. argenteus strains is shown by the gray shading. In both panels, the arrangement of genes in the cognate elements of the MCRF184 strain of S. aureus is shown. rep is a bacterial replicase (helicase).
FIGURE 5
FIGURE 5
SargPI elements found at different attachment sites in S. argenteus isolates. SargPI elements at the different attachment sites are shown in panels (A–D). * indicates a novel SargPI found within our isolates. Genes int and xis (in yellow) are excisionase; str and stl (dark blue) are transcription regulators; pri and rep (purple) are replication genes; ori (red) is replication origin; terS (light green) is terminase with other packaging genes (dark green); ear, seb, sec3, sei, selq, selk, sem, and tsst-1 (pink) are super-antigens; pif (light blue) phage interference gene and hypothetical genes are in orange. The color of the genes is as shown for SaPIs [22] for easy comparison. The lower scale shows size of the SargPIs in kb.
FIGURE 6
FIGURE 6
Sequence comparisons of hsdS proteins in S. argenteus strains. Representative sequences of the aligned hsdS proteins from the different S. argenteus STs are shown, colored by amino acid residue as shown in the key. Two S. aureus hsdS protein sequences are shown in red, labeled with their corresponding National Center for Biotechnology Information identifier. Blosum62 homology scores across all the sequences are shown above the alignment, colored as shown in the key. The domains of the hsdS protein are shown above the homology score graph – PCR, proximal conserved region; TRD1 and 2, target recognition domains 1 and 2; CCR, central conserved region; DCR, distal conserved region. The phylogenetic tree to the left shows the sequence relationships. Bootstrap support for the major branches is shown (1,000 bootstraps). The scale shows the average number of substitutions per site.
FIGURE 7
FIGURE 7
CRISPR/Cas locus in different strains of S. argenteus. Arrangement of the CRISPR/Cas locus within the orfX region of different strains of S. argenteus with and without the mecA cassette. For comparison, the mecA cassette in strains without the CRISPR/Cas locus are also shown.
FIGURE 8
FIGURE 8
Distribution of Phage and Plasmid spacer sequences in strains of S. argenteus. Phage and plasmid derived spacer sequences within CRISPR/Cas repeats of different strains of S. argenteus are shown, grouped as defined in Supplementary Table 1 and arranged according to the phylogenetic relationships of the different strains as shown in Figure 2. The left hand panel shows the occurrence of the different sequence spacer groups in the different strains. The right hand panel shows the location of the spacers within the two CRISPR/Cas spacer groups. Spacer positions are designated P1, P2, etc, as they are found in the CRISPR/Cas locus, starting with P1 at the left hand end of the spacer regions as shown in Figure 7.

References

    1. Abby S. S., Néron B., Ménager H., Touchon M., Rocha E. P. C. (2014). MacSyFinder: A Program to Mine Genomes for Molecular Systems with an Application to CRISPR-Cas Systems. PLoS One 9:e110726. 10.1371/journal.pone.0110726 - DOI - PMC - PubMed
    1. Akobi B., Aboderin O., Sasaki T., Shittu A. (2012). Characterization of Staphylococcus aureus isolates from faecal samples of the Straw-Coloured Fruit Bat (Eidolon helvum) in Obafemi Awolowo University (OAU), Nigeria. BMC Microbiol. 12:279. 10.1186/1471-2180-12-279 - DOI - PMC - PubMed
    1. Altschul S. F., Gish W., Miller W., Myers E. W., Lipman D. J. (1990). Basic local alignment search tool. J. Mol. Biol. 215 403–410. 10.1016/S0022-2836(05)80360-2 - DOI - PubMed
    1. Argemi X., Matelska D., Ginalski K., Riegel P., Hansmann Y., Bloom J., et al. (2018). Comparative genomic analysis of Staphylococcus lugdunensis shows a closed pan-genome and multiple barriers to horizontal gene transfer. BMC Genomics 19:621. 10.1186/s12864-018-4978-1 - DOI - PMC - PubMed
    1. Argudín M. A., Dodémont M., Vandendriessche S., Rottiers S., Tribes C., Roisin S., et al. (2016). Low occurrence of the new species Staphylococcus argenteus in a Staphylococcus aureus collection of human isolates from Belgium. Europ. J. Clin. Microbiol. Infect. Dis. 35 1017–1022. 10.1007/s10096-016-2632-x - DOI - PubMed

LinkOut - more resources