

Sex-Specific Differences in the Association Between Race/Ethnicity and NAFLD Among US Population
- PMID: 34926533
- PMCID: PMC8674562
- DOI: 10.3389/fmed.2021.795421
Sex-Specific Differences in the Association Between Race/Ethnicity and NAFLD Among US Population
Abstract
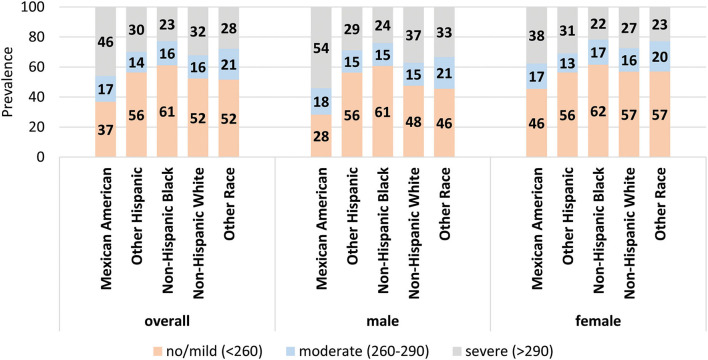
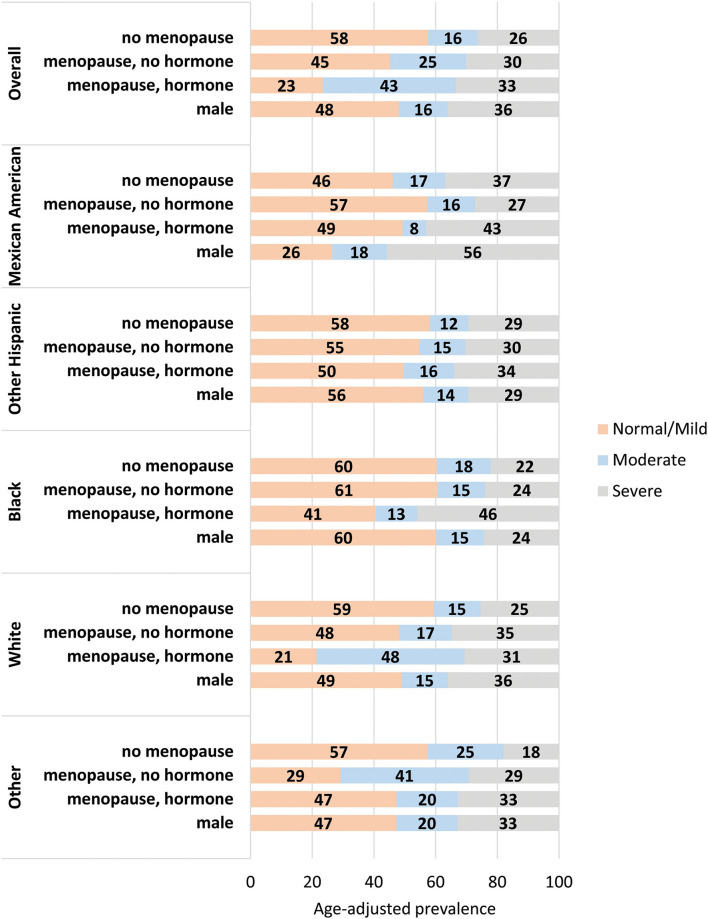
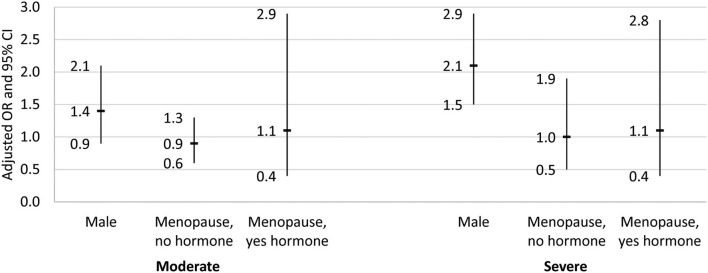
Non-alcoholic fatty liver disease (NAFLD) is spreading worldwide, with a racial/ethnic disparity. We examined the gender role in the racial/ethnic difference in NAFLD in the US population. We analyzed data for 3,292 individuals ≥18 years old from NHANES 2017-2018, a representative sample of the non-institutionalized adult population in the US. Exclusions were subjects with elevated transferrin level, chronic hepatitis B or C, excessive alcohol use, or prescription medications that might cause hepatic steatosis. NAFLD was diagnosed by FibroScan® using controlled attenuation parameter (CAP) values: S0 <238, S1 = 238-259, S2 = 260-290, S3 >290. Data were analyzed using Chi square and multinomial regression. The overall prevalence of NAFLD was 47.9% [S2 = 16.1%, and S3 = 31.8%]. The prevalence of S3 was highest among Mexican Americans (46%), lowest among Blacks (22.7%), 29.9% in other Hispanics and 32.1% in Whites (p < 0.05). It was higher among Mexican American males (54.1%) compared to Mexican American females (37.7%) (p < 0.05). In the adjusted model, Mexican Americans were two times more likely than Whites to have S2 and S3 (p < 0.05). Only male Mexican Americans had higher odds of S2 and S3 relative to male White (p < 0.05). Males had higher odds of S3 relative to non-menopausal females (p < 0.05). There was no difference in the odds of S2 or S3 NAFLD among the menopausal females with or without hormone therapy relative to non-menopausal females (p > 0.05). While Mexican Americans had the highest prevalence of severe NAFLD relative to the other racial/ethnic groups, only male Mexican Americans, but not females, had higher likelihood of both moderate and severe NAFLD relative to Whites. Interventions that specifically target Mexican American males are needed to increase awareness about NAFLD and its prevention.
Keywords: NHANES 2017–2018; disparity; non-alcoholic fatty liver disease (NAFLD); race/ethnicity; sex.
Copyright © 2021 Shaheen, Schrode, Pan, Kermah, Puri, Zarrinpar, Elisha, Najjar and Friedman.
Conflict of interest statement
The authors declare that the research was conducted in the absence of any commercial or financial relationships that could be construed as a potential conflict of interest.
Figures
References
-
- Rich NE, Oji S, Mufti AR, Browning JD, Parikh ND, Odewole M, et al. Racial and ethnic disparities in nonalcoholic fatty liver disease prevalence, severity, and outcomes in the united states: a systematic review and meta-analysis. Clin Gastroenterol Hepatol. (2018) 16:198–210.e2. 10.1016/j.cgh.2017.09.041 - DOI - PMC - PubMed
-
- Westfall E, Jeske R, Bader AR. Nonalcoholic fatty liver disease: common questions and answers on diagnosis and management. Am Fam Phys. (2020) 102:603–12. - PubMed
Grants and funding
LinkOut - more resources
Full Text Sources
Miscellaneous