

Human Adenovirus Serotype 3 Infection Modulates the Biogenesis and Composition of Lung Cell-Derived Extracellular Vesicles
- PMID: 34926703
- PMCID: PMC8677401
- DOI: 10.1155/2021/2958394
Human Adenovirus Serotype 3 Infection Modulates the Biogenesis and Composition of Lung Cell-Derived Extracellular Vesicles
Abstract
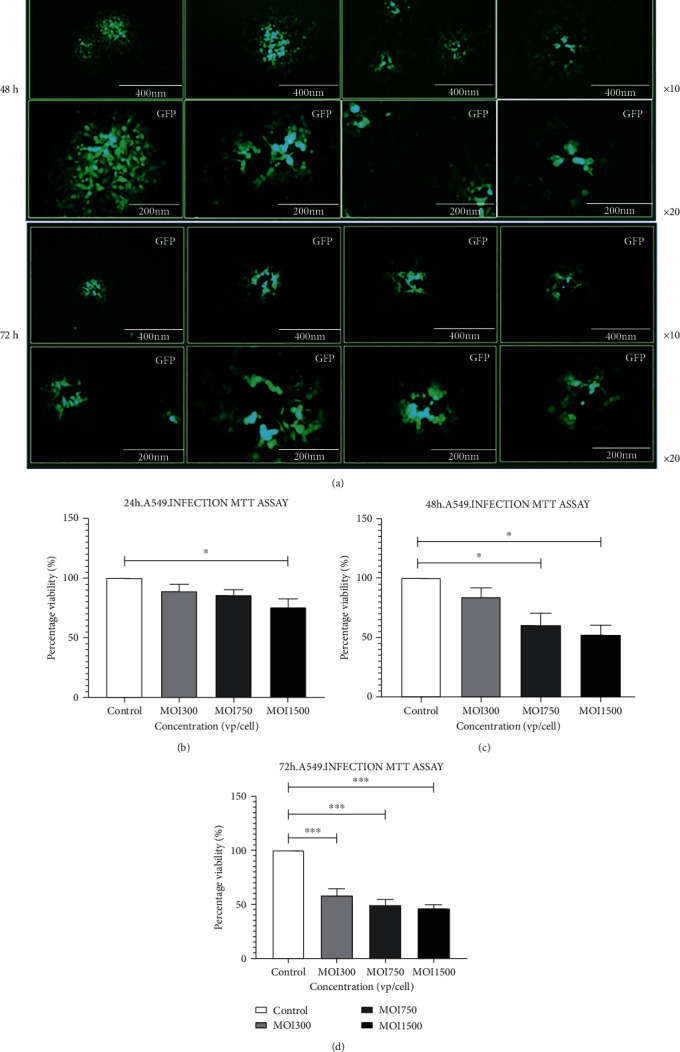
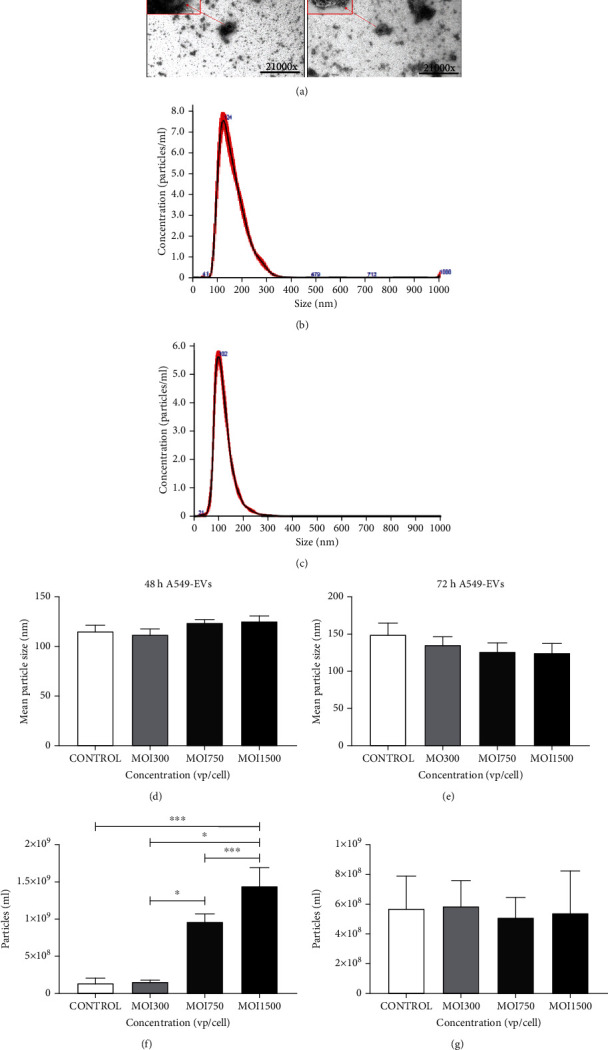
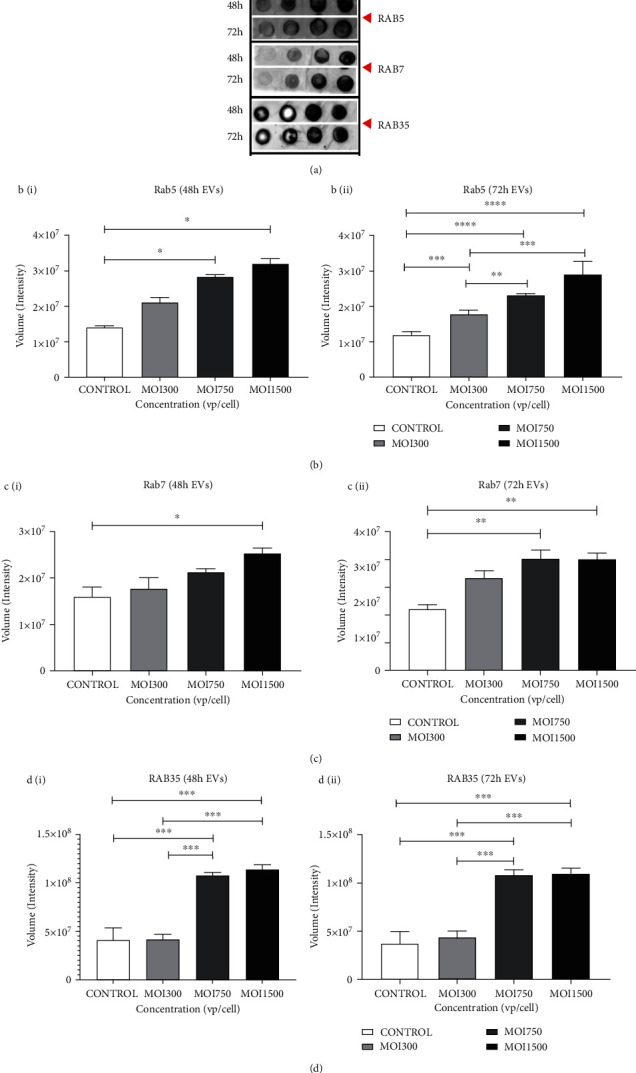
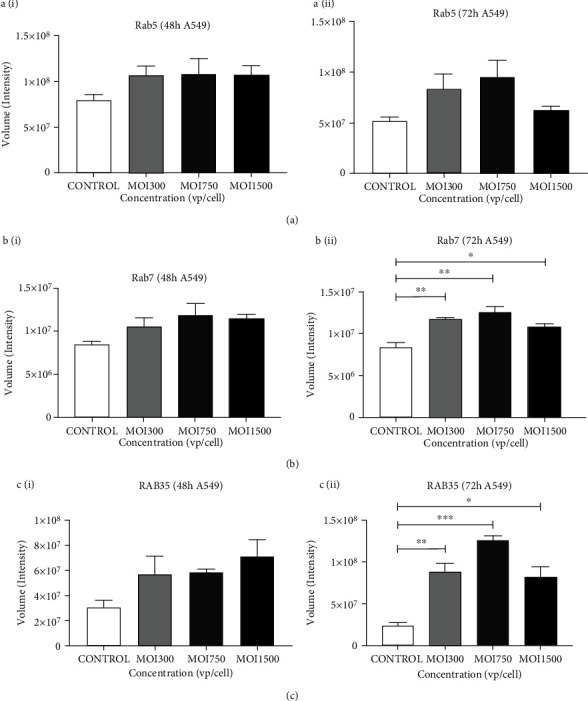
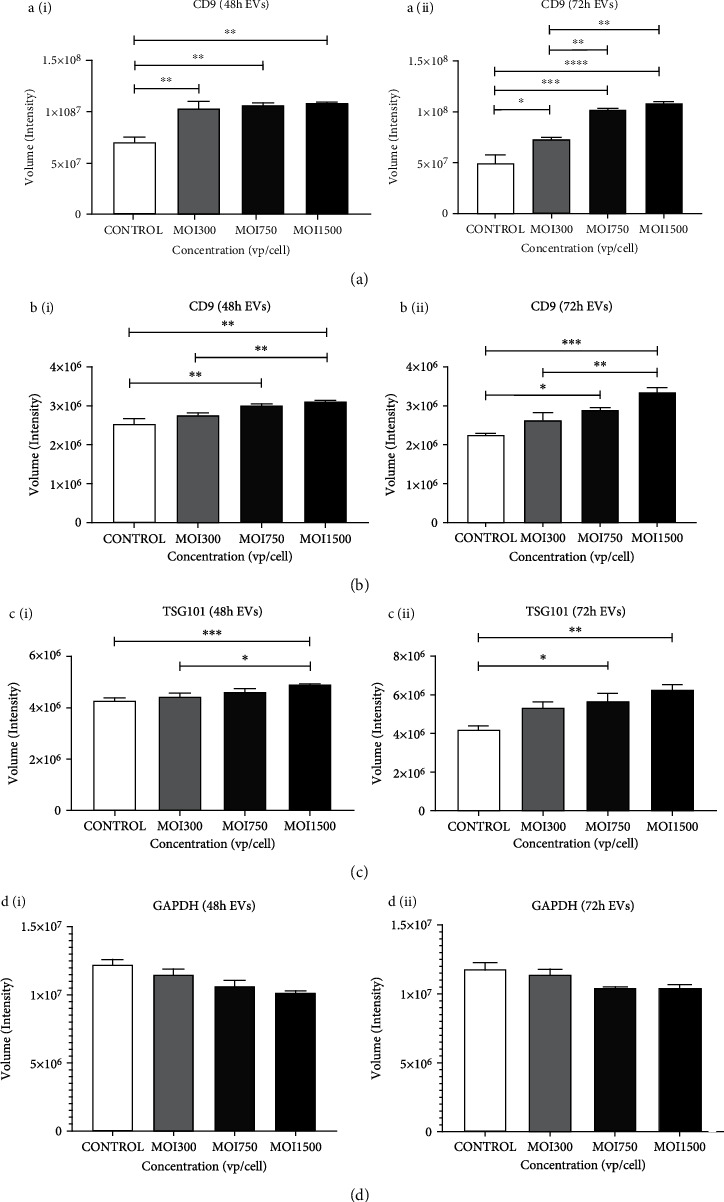
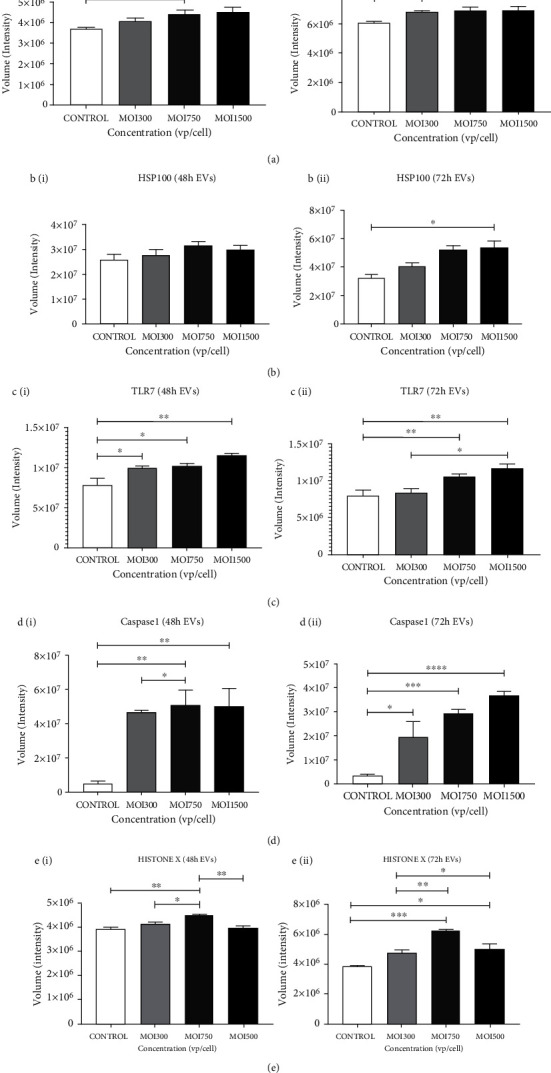
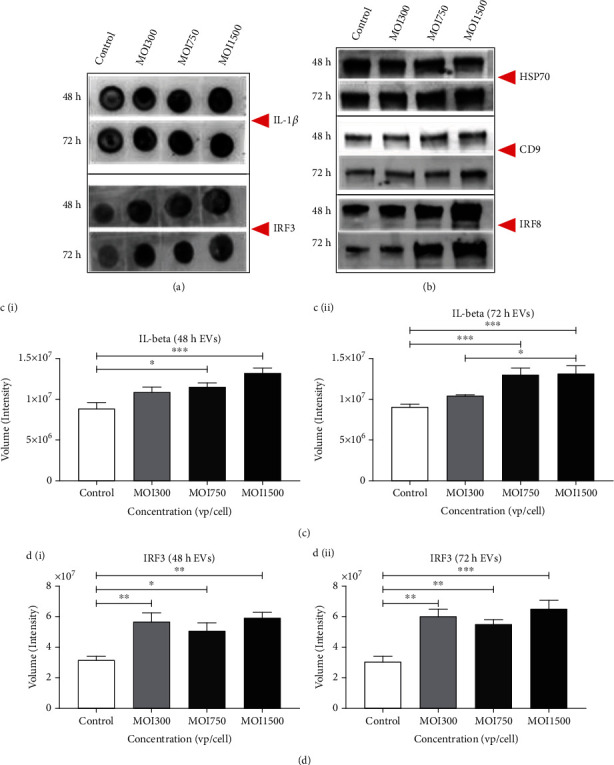
Adenovirus (Ad) is a major causal agent of acute respiratory infections. However, they are a powerful delivery system for gene therapy and vaccines. Some Ad serotypes antagonize the immune system leading to meningitis, conjunctivitis, gastroenteritis, and/or acute hemorrhagic cystitis. Studies have shown that the release of small, membrane-derived extracellular vesicles (EVs) may offer a mechanism by which viruses can enter cells via receptor-independent entry and how they influence disease pathogenesis and/or host protection considering their existence in almost all bodily fluids. We proposed that Ad3 could alter EV biogenesis, composition, and trafficking and may stimulate various immune responses in vitro. In the present study, we evaluated the impact of in vitro infection with Ad3 vector on EV biogenesis and composition in the human adenocarcinoma lung epithelial cell line A549. Cells were infected in an exosome-free media at different multiplicity of infections (MOIs) and time points. The cell viability was determined using 3-(4,5-dimethylthiazol-2-yl)-2,5-diphenyl tetrazolium bromide (MTT) and fluorometric calcein-AM. EVs were isolated via ultracentrifugation. Isolated EV proteins were quantified and evaluated via nanoparticle tracking, transmission electron microscopy, sodium dodecyl sulfate-polyacrylamide gel electrophoresis, and immunoblotting assays. The cell viability significantly decreased with an increase in MOI and incubation time. A significant increase in particle mean sizes, concentrations, and total EV protein content was detected at higher MOIs when compared to uninfected cells (control group). A549 cell-derived EVs revealed the presence of TSG101, tetraspanins CD9 and CD63, and heat shock proteins 70 and 100 with significantly elevated levels of Rab5, 7, and 35 at higher MOIs (300, 750, and 1500) when compared to the controls. Our findings suggested Ad3 could modulate EV biogenesis, composition, and trafficking which could impact infection pathogenesis and disease progression. This study might suggest EVs could be diagnostic and therapeutic advancement to Ad infections and other related viral infections. However, further investigation is warranted to explore the underlying mechanism(s).
Copyright © 2021 Ayodeji O. Ipinmoroti et al.
Conflict of interest statement
The authors declare that they have no conflicts of interest.
Figures
Similar articles
-
Feline coronavirus influences the biogenesis and composition of extracellular vesicles derived from CRFK cells.Front Vet Sci. 2024 Jul 18;11:1388438. doi: 10.3389/fvets.2024.1388438. eCollection 2024. Front Vet Sci. 2024. PMID: 39091390 Free PMC article.
-
Canine Coronavirus Infection Modulates the Biogenesis and Composition of Cell-Derived Extracellular Vesicles.Biomedicines. 2023 Mar 21;11(3):976. doi: 10.3390/biomedicines11030976. Biomedicines. 2023. PMID: 36979955 Free PMC article.
-
Extracellular Vesicles and Their Role in Lung Infections.Int J Mol Sci. 2023 Nov 9;24(22):16139. doi: 10.3390/ijms242216139. Int J Mol Sci. 2023. PMID: 38003329 Free PMC article. Review.
-
Biogenesis of Extracellular Vesicles during Herpes Simplex Virus 1 Infection: Role of the CD63 Tetraspanin.J Virol. 2019 Jan 4;93(2):e01850-18. doi: 10.1128/JVI.01850-18. Print 2019 Jan 15. J Virol. 2019. PMID: 30355691 Free PMC article.
-
Intravacuolar Pathogens Hijack Host Extracellular Vesicle Biogenesis to Secrete Virulence Factors.Front Immunol. 2021 Apr 20;12:662944. doi: 10.3389/fimmu.2021.662944. eCollection 2021. Front Immunol. 2021. PMID: 33959131 Free PMC article. Review.
Cited by
-
Feline coronavirus influences the biogenesis and composition of extracellular vesicles derived from CRFK cells.Front Vet Sci. 2024 Jul 18;11:1388438. doi: 10.3389/fvets.2024.1388438. eCollection 2024. Front Vet Sci. 2024. PMID: 39091390 Free PMC article.
-
Exosome-mediated regulation of inflammatory pathway during respiratory viral disease.Virol J. 2024 Jan 25;21(1):30. doi: 10.1186/s12985-024-02297-y. Virol J. 2024. PMID: 38273382 Free PMC article. Review.
-
Canine Coronavirus Infection Modulates the Biogenesis and Composition of Cell-Derived Extracellular Vesicles.Biomedicines. 2023 Mar 21;11(3):976. doi: 10.3390/biomedicines11030976. Biomedicines. 2023. PMID: 36979955 Free PMC article.
-
Selective pharmacological inhibition alters human carcinoma lung cell-derived extracellular vesicle formation.Heliyon. 2023 May 30;9(6):e16655. doi: 10.1016/j.heliyon.2023.e16655. eCollection 2023 Jun. Heliyon. 2023. PMID: 37303541 Free PMC article.
-
Extracellular Vesicles and Their Role in Lung Infections.Int J Mol Sci. 2023 Nov 9;24(22):16139. doi: 10.3390/ijms242216139. Int J Mol Sci. 2023. PMID: 38003329 Free PMC article. Review.
References
MeSH terms
Grants and funding
LinkOut - more resources
Full Text Sources
Miscellaneous
