Review
. 2022 Feb;9(5):e2103444.
doi: 10.1002/advs.202103444. Epub 2021 Dec 19.

Stimuli-Responsive Nanoparticles for Controlled Drug Delivery in Synergistic Cancer Immunotherapy

Affiliations
Review

Stimuli-Responsive Nanoparticles for Controlled Drug Delivery in Synergistic Cancer Immunotherapy

Jin Zhang et al. Adv Sci (Weinh). 2022 Feb.

Abstract

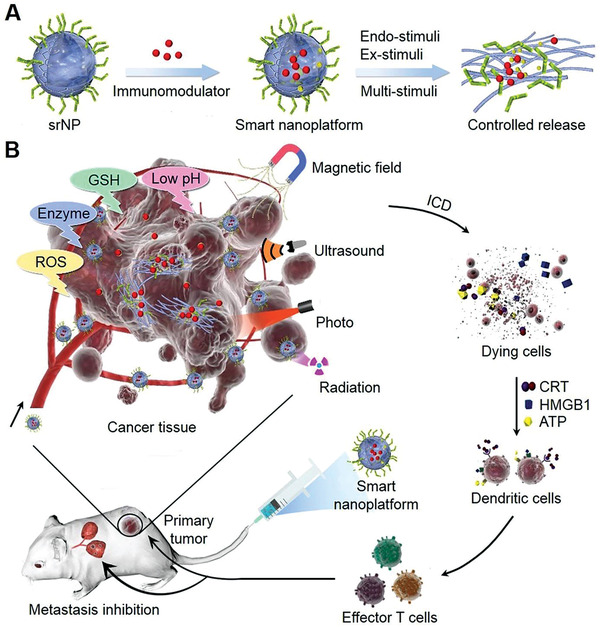
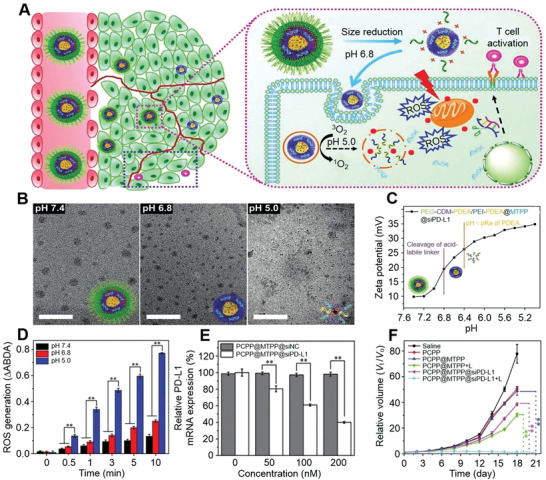
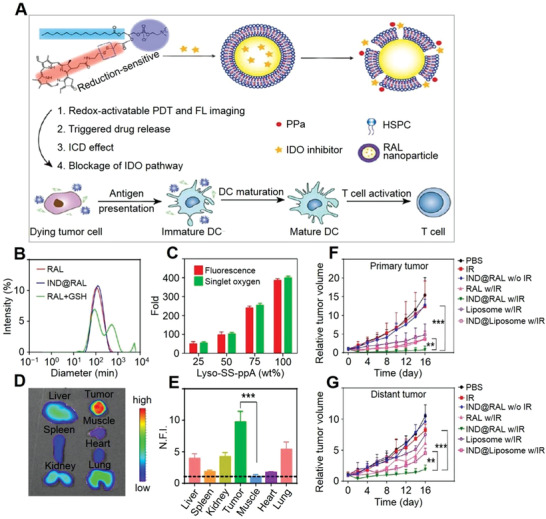
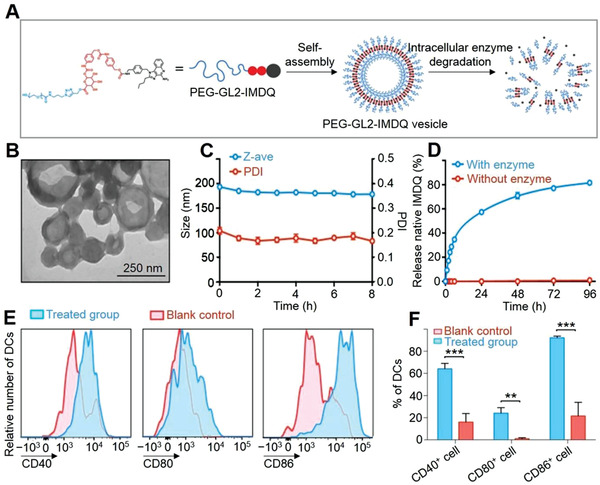
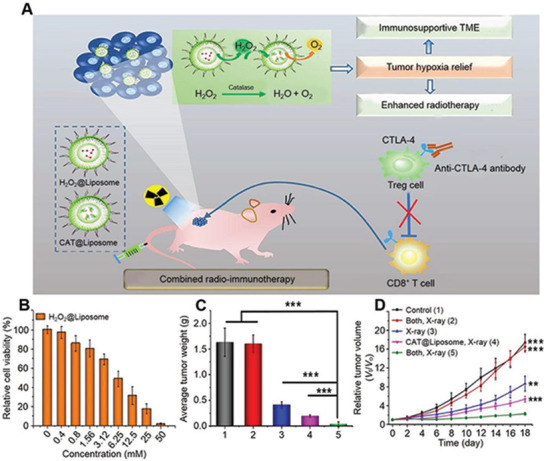
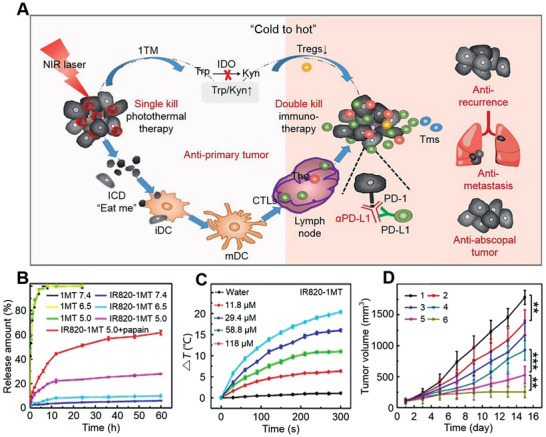
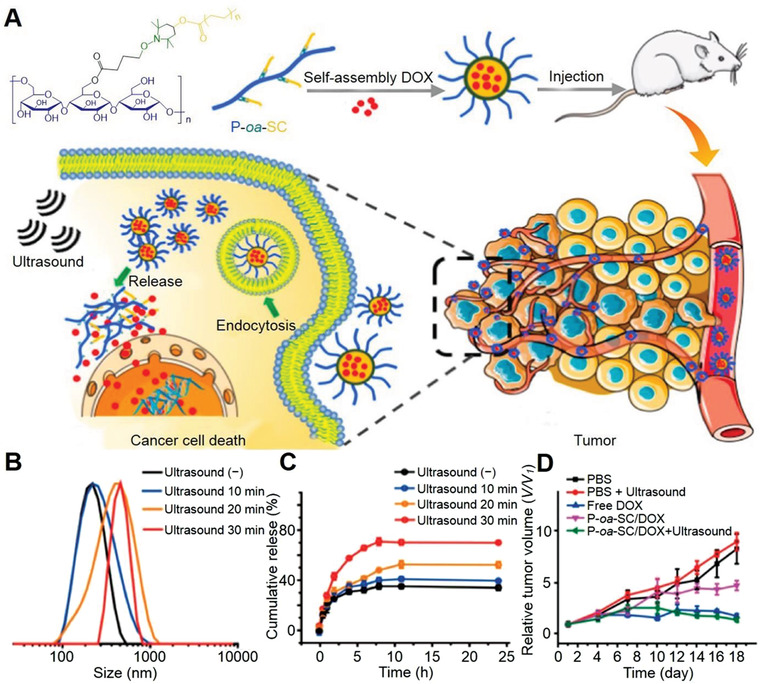
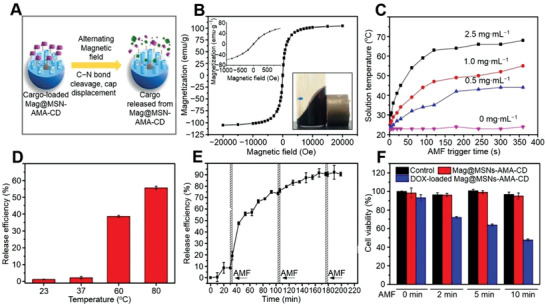
Cancer immunotherapy has achieved promising clinical progress over the recent years for its potential to treat metastatic tumors and inhibit their recurrences effectively. However, low patient response rates and dose-limiting toxicity remain as major dilemmas for immunotherapy. Stimuli-responsive nanoparticles (srNPs) combined with immunotherapy offer the possibility to amplify anti-tumor immune responses, where the weak acidity, high concentration of glutathione, overexpressions of enzymes, and reactive oxygen species, and external stimuli in tumors act as triggers for controlled drug release. This review highlights the design of srNPs based on tumor microenvironment and/or external stimuli to combine with different anti-tumor drugs, especially the immunoregulatory agents, which eventually realize synergistic immunotherapy of malignant primary or metastatic tumors and acquire a long-term immune memory to prevent tumor recurrence. The authors hope that this review can provide theoretical guidance for the construction and clinical transformation of smart srNPs for controlled drug delivery in synergistic cancer immunotherapy.

Keywords: clinical translation; controlled drug release; nanotechnology; smart nanocarrier; synergistic immunotherapy.


Conflict of interest statement

The authors declare no conflict of interest.

Figures

Scheme 1
Scheme 1
srNPs for controlled drug delivery in synergistic cancer immunotherapy. A) Design of srNPs activated by endo‐ and/or ex‐stimuli, including weak acidity, enzyme, high ROS/GSH concentration, photon, US, magnetic field, and radiation, for smart drug release. (B) srNPs activated by endo‐ and/or ex‐stimuli with controlled immunomodulator release for primary tumor treatment. In addition, dying cells with the expressions of CRT, HMGB1, and ATP “eat me” signals are captured for maturing DC and then are presented to effector T cells (CD8+ and CD4+ T cells). These activated T cells are then accumulated and attack both the primary and metastatic cancer.
Figure 1
Figure 1
pH‐mediated en‐srNP for controlled drug release and synergistic cancer immunotherapy. A) Illustration of pH‐responsive dissociable PEG block connected poly(2‐(diethylamino) ethyl methacrylate)@PD‐L1‐targeting siRNA (PCPP@MTPP@siPD‐L1) micelleplex‐mediated photodynamic tumor immunotherapy in vivo. B) TEM images of PCPP@MTPP@siPD‐L1 after various treatments with pH 7.4, 6.8, and 5.0 for 4 h. C) Zeta potential variation of PCPP@MTPP@siPD‐L1 under various pH values. D) PCPP@MTPP@siPD‐L1 micelle‐induced ROS production in irradiation time‐ and acidity‐dependent manners. E) PCPP@MTPP@siPD‐L1 micelle releasing siPD‐L1 efficiency against PD‐L1 in B16F10 cells detected by qRT‐PCR. F) Relative tumor volumes after synergistic immunotherapy. Data are represented as mean ± standard derivation (SD; n = 6; *P < 0.05, **P < 0.01). Reproduced with permission.[ 16 ] Copyright 2018, Wiley‐VCH.
Figure 2
Figure 2
GSH‐mediated en‐srNP for controlled drug release and synergistic cancer immunotherapy. A) Schematic illustration of combined PDT and immunotherapy by IDO inhibitor loaded IND@RAL for combating cancer. B) DLS analysis of RAL, IND@RAL, and IND@RAL exposed to 10.0 mM GSH. Scale bar: 100 nm. C) Redox‐activatable fluorescence and 1O2 turn‐on behaviors of various liposomes with different percentages of redox‐sensitive lipids. D) Fluorescence imaging of collected organs at 24 h post‐injection of RAL‐PPa. E) Normalized fluorescence signal of organs to that in muscle in (D). ***P < 0.001, compared with muscle. F,G) Growth curves for primary and distant tumors of 4T1 tumor‐bearing mice after PDT treatment. Mice are irradiated with 660 nm laser with a power density of 400 mW cm−2 for 10 min after 24 h post‐injection at an equal PPa and IND dose of 3.0 and 2.5 mg (kg BW)−1, respectively. **P < 0.01, compared with IND@liposome with irradiation group. ***P < 0.001, compared with IND@RAL without irradiation group. Reproduced with permission.[ 25 ] Copyright 2019, American Chemical Society.
Figure 3
Figure 3
Enzyme‐mediated en‐srNP for controlled drug release and synergistic cancer immunotherapy. A) Self‐assembly of PEG‐modified glucuronide (GL2) linker IMDQ amphiphile prodrug into PEG‐GL2‐IMDQ micelle. B) TEM image of self‐assembled en‐srNP. C) Stability of PEG5k‐GL2‐IMDQ en‐srNP after dilution in phosphate‐buffered saline (PBS) at pH 7.4 and incubated at 37 °C (n = 3). D) In vitro release of IMDQ from PEG5k‐GL2‐IMDQ vesicle in the presence of an esterase at pH 5.0 and 37 °C (n = 3). E) Flow cytometry analysis for expression of maturation markers on DCs in the draining lymph node in response to subcutaneous injection of PEG5k‐GL2‐IMDQ en‐srNP. F) Percentages of DCs expressing a specific maturation marker (Student t‐test; n = 3; **P < 0.01, ***P < 0.001). Reproduced with permission.[ 28 ] Copyright 2019, American Chemical Society.
Figure 4
Figure 4
ROS‐mediated en‐srNP for controlled drug release and synergistic cancer immunotherapy. A) Schematic illustration of H2O2@Liposome and catalase (CAT@Liposome) for enhanced radio‐immunotherapy of cancer. B) Relative viability of 4T1 cells after incubation with H2O2@Liposome at various concentrations for 24 h. C) Average tumor weights measured on day 16 after different treatments. D) Tumor growth curves of mice after various treatments including, 1) Control, 2) Both, X‐ray−. 3) X‐ray+, 4. CAT@Liposome, X‐ray+, 5. Both, X‐ray+. Data are represented as mean ± SD (two‐tailed t‐test; n = 5; *P < 0.05, **P < 0.01, and ***P < 0.001). Reproduced with permission.[ 133 ] Copyright 2018, American Chemical Society.
Figure 5
Figure 5
Photo‐mediated ex‐srNP for smart drug delivery and synergistic cancer immunotherapy. A) Schematic illustration for mechanism of IR820‐1MT NP (photothermal agent: IR820; immune checkpoint inhibitor: 1MT) to inhibit primary tumor and tumor metastasis and recurrence based on enhanced immunotherapy via synergistic PTT. B) In vitro 1MT release in various conditions. C) Temperature changes in organic photothermal agent (IR820‐1MT) nanoparticle solution after irradiation (1.0 W·cm−2, 660 nm). D) Change of average tumor volume after treatment with 1) normal saline, 2) 1MT, 3) αPD‐L1, 4) IR820, 5) IR820‐1MT, or 6) IR820‐1MT+αPD‐L1. Data are represented as mean ± SD (n = 9; *P < 0.05, **P < 0.01, ***P < 0.001). Reproduced with permission.[ 160 ] Copyright 2019, American Chemical Society.
Figure 6
Figure 6
US‐mediated ex‐srNP for smart drug delivery and synergistic cancer immunotherapy. A) Illustration of construction of US‐responsive pullulan‐based amphiphilic polymer with multiple hydrophobic stearic segments through US‐labile linkage of P‐oa‐SC NP to pursue US‐specified chemotherapeutic potency to the tumors. B) DLS measurement for the P‐oa‐SC self‐assembly upon ultrasonication (1.0 MHz, 9.9 W, 3 W cm−2). C) The cumulative release of DOX from P‐oa‐SC/DOX in the presence of US impetus (1.0 MHz, 9.9 W, 3 W cm−2). Data are represented as mean ± SD (n = 3). D) Tumor growth profile. Data are represented as mean ± standard error (S.E.). *P < 0.05. Reproduced with permission.[ 176 ] Copyright 2018, American Chemical Society.
Figure 7
Figure 7
Magnetic‐mediated ex‐srNP for smart drug delivery and synergistic cancer immunotherapy. A) Schematic illustration showing formation of magnetic field inducible drug‐eluting core@shell structure nanoparticle (Mag@MSN‐AMA‐CD NP) and its application in image‐guided synergistic therapy. B) Field‐dependent magnetization curve of MnFe2O4@CoFe2O4 at 300 K. The inset shows the small scale of field‐dependent magnetization curves and how a magnet attracts the MnFe2O4@CoFe2O4@MSN@core@shell NP in hexane. C) Time‐ and concentration‐dependent temperature‐increase profile of toluene solution containing MnFe2O4@CoFe2O4 triggered by an AMF. D) Release efficiency of fluorescein from Mag@MSN after the bulk heating at 23, 37, 60, or 80 °C triggers for 10 min (n = 3). Mn denotes magnetic MnFe2O4@CoFe2O4, and MSN denotes mesoporous silica NP. E) Time‐dependent release profile of fluorescein from Mag@MSN through magnetic actuation under AMF for three min for 3 cycles (n = 3). The temperature of the solution right after each exposure is measured to be 26 °C, 3 °C higher than that before each AMF exposure. F) Viability of PANC‐1 after treatment with Mag@MSNs‐AMA‐CD or DOX‐loaded Mag@MSNs‐AMA‐CD. The control is cells without treatment by nanoparticle. The cells are treated for 4 h at a concentration of 50 µg mL−1 followed by 2, 5, or 10 min of AMF exposure. The cells are allowed to grow in the regular culture medium for 12 h. AMA, 1‐adamantylamine; CD, β‐cyclodextrin. Data are represented as mean ± SD (n = 3). Reproduced with permission.[ 196 ] Copyright 2019, American Chemical Society.
Figure 8
Figure 8
Radiation‐mediated ex‐srNP for smart drug delivery and synergistic cancer immunotherapy. A) Schematic illustration of gene silencing and cancer cells killing by X‐ray‐triggered liposome. This liposomal delivery platform incorporates VP and Au NP. Two types of cargos, antisense oligonucleotide, and DOX, are respectively entrapped inside a liposomal middle cavity to demonstrate in vitro drug delivery. B) Calcein release profiles from liposomes under 360 nm irradiation. C) Structural components of treated tumor (H&E staining). Viable tumor tissues are composed of uniform cells with basophiliccytoplasm (blue) and large roundish hyperchromatic nuclei. The areas of cellular paranecrosis and necrosis are recognized by disorganized groups of tumor cells with eosinophilic (pink) cytoplasm, with and without nuclei, respectively. Arrows indicate congested blood vessels. Note the spatial association between the viable tumor tissue and blood vessels. The scale bar is 50 µm. D) Changes in tumor volume. E) Mouse body weight after various treatments as indicated. The mean tumor volumes are analyzed using the t‐test (n = 4; *P < 0.05, **P < 0.01, ***P < 0.001). Reproduced with permission.[ 211 ] Copyright 2018, Springer Nature.
Figure 9
Figure 9
d‐srNP for triggered drug release and synergistic cancer immunotherapy. A) Schematic illustration of BCPN constructed from a tumor acidity and reduction OXA prodrug and a reduction‐activatable homodimer of NLG919 for improved immunotherapy by cooperatively modulating the immune TME. B) Cell viability of 4T1 cells examined post 48 h incubation with OXA or acid‐sensitive BCPNs (ASPN). Data are expressed as mean ± SD (*P < 0.05, **P < 0.01). C) Tumor growth curves in 4T1 tumor‐bearing mice following indicated treatments. Data are expressed as mean ± SD (n = 6; **P < 0.01). D) The number of lung metastatic nodules of mice bearing 4T1 tumors at the end of anti‐tumor study. Data are expressed as mean ± SD (n = 6; *P < 0.05, **P < 0.01). Reproduced with permission.[ 233 ] Copyright 2018, Wiley‐VCH.
Figure 10
Figure 10
m‐srNP for triggered drug release and synergistic cancer immunotherapy. A) Schematic illustration of NIR light/pH/GSH‐responsive nanoparticle consisting of PEG‐a‐PCL‐SS‐P nanoparticle (NIPAM‐co‐DMA NP) (S1) star quaterpolymer for precise cancer therapy with synergistic effects. B) Accumulative release of PTX from m‐srNP at the concentration of 100 µg mL−1 Cypate at pH 7.4 under 15 min irradiation at 0, 4, 8, or 12 h. C) Accumulative release of PTX from MS‐NP at pH 5.0 under 15 min irradiation at 0, 4, 8 or 12 h. D) Tumor growth profiles of mice injected with MS‐NP, DS‐NP, normal nanoparticle (control‐NP), and free Cypate/PTX (C/P) at the dose of 7.5 mg (kg BW)−1 Cypate or PTX, followed by 785 nm light irradiation at 24 h post‐injection (5 min, 1.0 W cm−2). Reproduced with permission.[ 241 ] Copyright 2016, American Chemical Society.

References

    1. Xuan Y., Guan M., Zhang S., Theranostics 2021, 11, 7360. - PMC - PubMed
    1. Tang T., Huang X., Zhang G., Hong Z., Bai X., Liang T., Signal Transduction Targeted Ther. 2021, 6, 72. - PMC - PubMed
    1. a) Wang X., Wang X., Jin S., Muhammad N., Guo Z., Chem. Rev. 2019, 119, 1138; - PubMed
    2. b) Yang M., Li J., Gu P., Fan X., Bioact. Mater. 2021, 6, 1973. - PMC - PubMed
    1. Alzeibak R., Mishchenko T. A., Shilyagina N. Y., Balalaeva I. V., Vedunova M. V., Krysko D. V., J. Immunother. Cancer 2021, 9, e001926. - PMC - PubMed
    1. Goldberg M. S., Cell 2015, 161, 201. - PubMed

Publication types

LinkOut - more resources