Review
. 2022 Jan 12;122(1):1-49.
doi: 10.1021/acs.chemrev.1c00521. Epub 2021 Dec 20.

Free Energies of Proton-Coupled Electron Transfer Reagents and Their Applications

Affiliations
Review

Free Energies of Proton-Coupled Electron Transfer Reagents and Their Applications

Rishi G Agarwal et al. Chem Rev. .

Abstract

We present an update and revision to our 2010 review on the topic of proton-coupled electron transfer (PCET) reagent thermochemistry. Over the past decade, the data and thermochemical formalisms presented in that review have been of value to multiple fields. Concurrently, there have been advances in the thermochemical cycles and experimental methods used to measure these values. This Review (i) summarizes those advancements, (ii) corrects systematic errors in our prior review that shifted many of the absolute values in the tabulated data, (iii) provides updated tables of thermochemical values, and (iv) discusses new conclusions and opportunities from the assembled data and associated techniques. We advocate for updated thermochemical cycles that provide greater clarity and reduce experimental barriers to the calculation and measurement of Gibbs free energies for the conversion of X to XHn in PCET reactions. In particular, we demonstrate the utility and generality of reporting potentials of hydrogenation, E°(V vs H2), in almost any solvent and how these values are connected to more widely reported bond dissociation free energies (BDFEs). The tabulated data demonstrate that E°(V vs H2) and BDFEs are generally insensitive to the nature of the solvent and, in some cases, even to the phase (gas versus solution). This Review also presents introductions to several emerging fields in PCET thermochemistry to give readers windows into the diversity of research being performed. Some of the next frontiers in this rapidly growing field are coordination-induced bond weakening, PCET in novel solvent environments, and reactions at material interfaces.


Conflict of interest statement

The authors declare no competing financial interest.

Figures

Figure 1.
Figure 1.
Roberts and Bullock’s schematic of the four-electrode cell configuration used for H2 open-circuit potential (OCP) measurements. The analyte solution consists of an acid:base:H2 mixture of known composition. The Ag/AgCl pseudoreference is calibrated to Cp2Fe+/0 after determination of the OCP. Potentiostat and potentiometer are shown as separate devices to illustrate the principle of the measurement. Reprinted with permission from ref . Copyright 2013 American Chemical Society.
Figure 2.
Figure 2.
(A) Dependence of reaction overpotential on the mole fraction of H2O in a [(DMF)H]NTf2–H2O ionic liquid, where overpotential is the difference between Ecat/2 and E(H+/H2) under the reaction conditions. (B) The dependence of proton diffusion constant for two different ionic liquids (red or blue dots) and of catalytic current for 1-C6 in [(DBF)H]NTf2–H2O (green squares) on the mole fraction of H2O. (C) Structures of the nickel catalysts used and their R groups of varying steric bulk. (D) Relationship between the logarithms of boat-chair isomerization rate and turnover frequency. (A) and (B) are reprinted with permission from ref . Copyright 2014 Royal Society of Chemistry. (C) and (D) are reprinted (adapted) with permission from ref . Copyright 2016 Wiley.
Figure 3.
Figure 3.
Free energy surface of the square scheme for a PCET reagent XH, showing the concerted proton–electron transfer (CPET) pathway and the stepwise paths (ET/PT and PT/ET). Each arrow is drawn over the barrier for the respective step.
Figure 4.
Figure 4.
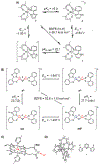
Imidazole and other complexes with an acid/base group removed from the redox-active metal center. (A) Square scheme for a ruthenium–imidazole complex showing the 0.36 V increase in the reduction potential upon protonation. Reprinted (adapted) with permission from ref . Copyright 2007 American Chemical Society. (B) Square scheme for a di-iron disulfido–benzimidazole complex showing a 0.240 V increase upon protonation. Reprinted with permission from ref . Copyright 2017 American Chemical Society. BDFEs in A and B were updated to reflect the new CG(MeCN) value. (C) An iron–protoporphyrin-IX complex that shifts 20 mV upon protonation at the carboxylate. Reprinted with permission from ref . Copyright 2011 American Chemical Society. (D) Drawing of the structure of the Fe(III) complex with two doubly deprotonated bis(imidazolyl)pyridine ligands, [Fe(1–2H)2]., Reprinted with permission from ref . Copyright 1998 Royal Society of Chemistry.
Figure 5.
Figure 5.
Histogram depiction of compensation between E1/2 and pKa, for compounds within different classes of PCET reagents and in different solvents. Perfect compensation of −59.2 mV/pKa is indicated by the red line. Blue numbers in the bars are the number of compounds analyzed in each class. aIn water. bIn DMSO. cRef . Reprinted (adapted) with permission from ref , Supporting Information Figure S33, with blue numbers added. Copyright 2016 American Chemical Society.
Figure 6.
Figure 6.
Aqueous PCET thermochemistry of [cis-(bpy)2pyRuOHx]n+ from refs , , and . Top: Pourbaix diagram, for this system and a map of the predominant species present as a function of pH and solution potential. The pH of the inflection points corresponds to pKa values, and the slopes of the horizontal and diagonal lines indicate the stoichiometry of the redox process occurring, (59 mV)ne/mH+. Bottom: Double square scheme showing pKa values above horizontal arrows, pure-ET E values beside vertical arrows, and BDFEs along the diagonals (from eq 10). Thermochemical values are from Table 24. Reprinted (adapted) with permission from ref , , and Copyright 2010, 2001, and 1981 American Chemical Society.
Figure 7.
Figure 7.
Multiple-site concerted proton–electron transfer (MS-CPET). (A) General scheme for XH oxidation or X reduction. (B) Schematic of tyrosine-161 oxidation in Photosystem-II by long-range ET to the oxidized chlorophyll special pair P680+ concerted with PT to histidine-190., (C) Photocatalytic MS-CPET oxidation of an amide with photooxidant Mn and base B. (D) Photoinduced MS-CPET to a noncovalently bonded oxidant/base pair. Reprinted with permission from refs , , , and , respectively. Copyright 2018, 2007, 2016, and 2019 American Chemical Society.
Figure 8.
Figure 8.
Catalytic applications of coordination bond weakening. (A) Knowles’ use of amide coordination bond weakening (bottom left) to enable catalytic amination. (B) Kim, Holland, and Poli’s possible mechanism for carbon radical trapping by an iron(II)-bound ethanol ligand. Reproduced with permission from refs and , respectively. Copyright 2015 and 2019 American Chemical Society.
Figure 9.
Figure 9.
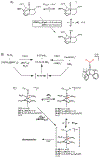
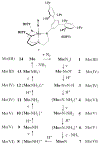
(A) Scheme for estimating a Mo-diazenido N–H BDFE (HITP = 3,5-(2,4,6-iPr3C6H2)2-C6H3); the BDFEN–H has been edited to reflect our updated CG value in THF. Reprinted (adapted) with permission from ref . Copyright 2017 Springer Nature. (B) Suggested generation and disproportionation of P3SiFe–N═NH to P3SiFe–N2 and P3SiFe═N–NH2; the cationic hydrazido complex is drawn at the right, showing the structure of the P3Si ligand. Reprinted with permission from ref . Copyright 2017 American Chemical Society. (C) Scheme for theN–H BDFEs in (dppe)2(L)Mo(═NN(Cy)H)n+. Reprinted with permission from ref . Copyright 2016 Royal Chemical Society.
Figure 10.
Figure 10.
Reactions of iridium nitride and amide complexes 3a and 6 with hydrogen atom transfer reagents. Reprinted with permission from ref . Copyright 2015 American Chemical Society.
Figure 11.
Figure 11.
(A) Marcus-type reaction coordinate for P450 compound I abstracting a hydrogen atom from methane. (B) O–H bond strengths that define the ground-state thermodynamics of P450 catalysis, for compound II (also the red structure in part (A)) and for the ferric water-bound form of the enzyme. (C) Measured E′ for compound I to compound II versus pH. The 57.7 mV/pH slope demonstrates the 1e/1H+ nature of the reduction. Reprinted with permission from ref . Copyright 2019 American Chemical Society.
Figure 12.
Figure 12.
Schematic of EB: In Step 1, a high-potential acceptor oxidizes the doubly reduced bifurcating site by one electron, generating the unstable singly reduced bifurcating site, which is a potent reductant. In Step 2, this reductant can transfer an electron to a low-potential acceptor, provided that the more exergonic electron transfer to a second high-potential acceptor is prevented (gated). Here the redox steps are shown as pure electron transfers, as is common in the field, but one or both of these steps is (in our view) likely to be PCET (see below).
Figure 13.
Figure 13.
(A) Schematic of the Q-cycle in the mitochondrial bc1 complex (complex III). Qo is the bifurcation site, with the 1st e/H+ pair moving to the FeS Rieske cluster and the 2nd redox equivalent reducing heme bL. Reprinted (adapted) with permission from ref . Copyright 2013 Elsevier. (B) Drawing of the active site of electron bifurcation in the Q cycle showing successive ET steps that are associated with proton transfers to nearby residues. (C) Image of the Fe2S2–His–QH2–Glu portion of a crystal structure with the QH2 modeled in, in place of an inhibitor. Reprinted with permission from ref . Copyright 2006 Elsevier.
Figure 14.
Figure 14.
Partial square scheme representations of PCET thermochemistry for (a) a metal complex, (b) a graphite-conjugated catalyst (GCC) with a pendent carboxylate, and (c) a platinum electrode. Reprinted with permission from ref . Copyright 2019 American Chemical Society.
Figure 15.
Figure 15.
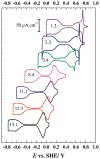
Cyclic voltammetry of a Pt(111) electrode at different solution pH’s (scan rate: 50 mV s−1). The wave for UPD hydrogen is the shape at the left in each CV, with the pH inscribed inside. Reprinted with permission from ref . Copyright 2015 Elsevier.
Figure 16.
Figure 16.
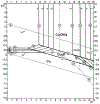
One of the Pourbaix (E/pH) diagrams for copper. Reproduced from the Atlas of Electrochemical Equilibria in Aqueous Solutions by Marcel Pourbaix, with permission of the National Association of Corrosion Engineers.
Figure 17.
Figure 17.
(A) NiO on FTO CVs of NiO|FTO collected in aqueous buffers and plot of E1/2 vs pH for both redox features, showing Nernstian dependences. Reprinted with permission from ref . Copyright 2019 American Chemical Society. (B)Dependence of reduction potential on log proton activity for a TiO2 film, with a slope of 64mV/log(aH+). Reprinted with permission from ref . Copyright 1999 American Chemical Society. (C) Reduction potentials of citrate-capped aqueous colloidal TiO2 nanoparticles determined by titration with various solution ET reagents. Reprinted with permission. Copyright 2019 Dr. Jennifer L. Peper.
Figure 18.
Figure 18.
(a) Pourbaix diagram showing the pH dependence of interfacial proton-coupled electron-transfer (PCET) waves for GCC-phenazine (red), GCC-phen-NH2 (purple), GCC-phen-COOH (dark green; structure shown in (b)), GCC-phen-m-OH (olive green), and GCC-phen-o-OH (blue). The dotted line shows the computed potential of zero free charge (EPZFC). (b) Partial square scheme for interfacial PCET at GCC-phen-COOH, as an example reaction. The model reported partitions the potential for PCET (diagonal leg) into a horizontal leg, defined as the difference between the 0-field pKa of the surface site and the pH of the solution, and a vertical leg, defined as the EPZFC, of the electrode. Reprinted with permission from ref . Copyright 2019 American Chemical Society.
Figure 19.
Figure 19.
(A) Schematic of the chemical process defines the ceria–H BDFE; Ce4+: gold; Ce3+: purple; O2−: gray; H: red. (B) Equilibrium reaction of colloidal, oleate-ligated cerium oxide nanocrystals with hydroquinones and quinones. (C) Variation of CeO–H BDFEs with the % Ce3+ in the surface regions for three batches of nanocrystals, Ce-1, Ce-2, and Ce-L, with average diameters of 1.8 ± 0.2 nm, 1.9 ± 0.3 nm, and 4.0 ± 0.4 nm, respectively. Reprinted with permission from ref . Copyright 2021 American Chemical Society.
Scheme 1.
Scheme 1.
Square Scheme of PCET Thermochemistry
Scheme 2.
Scheme 2.
Calculation of E(V vs H2) from the 1e Reduction Potential and pKa
Scheme 3.
Scheme 3.
Calculation of E(V vs H2) Directly from E′(X/XHn)
Scheme 4.
Scheme 4.
Thermochemistry of BDFE Medium Dependence
Scheme 5.
Scheme 5.. Precursor and Successor Complexes and Work Terms (w) for Electron Transfer, Hydrogen Atom Transfer, and Multiple-Site Concerted Proton– Electron Transfera
aThe overall energetics from separated reactants to separated products is ΔG.
Scheme 6.
Scheme 6.. Water O–H Bond Sufficiently Weakened by Coordination to TiIII That It Can Transfer H to an Alkyl Radicala
aReproduced with permission from ref . Copyright 2006 Wiley.
Scheme 7.
Scheme 7.
Thermochemical Schemes for X–H Bond Weakening upon Metal Coordination
Scheme 8.
Scheme 8.. Schrock Catalyst (Top) and Proposed Intermediates along the Chatt Cycle in the Reduction of Dinitrogen through the Stepwise Addition of Protons and Electrons (Bottom)a,b
aIn the bottom portion, compounds that were not isolated are bracketed with { and }. bReproduced with permission from ref . Copyright 2005 American Chemical Society.
Scheme 9.
Scheme 9.
(A) Electrochemical Interconversion of NiIIIOOH to NiII(OH)2 and (B) Reversible PCET between a Phenol/Phenoxyl Radical and NiIIIOOH/NiII(OH)2

References

    1. Huynh MHV; Meyer TJ Proton-Coupled Electron Transfer. Chem. Rev 2007, 107, 5004–5064. - PMC - PubMed
    1. Weinberg DR; Gagliardi CJ; Hull JF; Murphy CF; Kent CA; Westlake BC; Paul A; Ess DH; McCafferty DG; Meyer TJ Proton-Coupled Electron Transfer. Chem. Rev 2012, 112, 4016–4093. - PubMed
    1. Warren JJ; Tronic TA; Mayer JM Thermochemistry of Proton-Coupled Electron Transfer Reagents and its Implications. Chem. Rev 2010, 110, 6961–7001. - PMC - PubMed
    1. Hammes-Schiffer S; Stuchebrukhov A A Theory of Coupled Electron and Proton Transfer Reactions. Chem. Rev 2010, 110, 6939–6960. - PMC - PubMed
    1. Costentin C; Robert M; Savéant J-M Update 1 of: Electrochemical Approach to the Mechanistic Study of Proton-Coupled Electron Transfer. Chem. Rev 2010, 110, PR1–PR40. - PubMed

Publication types