. 2022 Feb 23;22(4):1818-1825.
doi: 10.1021/acs.nanolett.1c03021. Epub 2021 Dec 20.

Quantum Sensing of Free Radicals in Primary Human Dendritic Cells

Affiliations

Quantum Sensing of Free Radicals in Primary Human Dendritic Cells

Linyan Nie et al. Nano Lett. .

Abstract

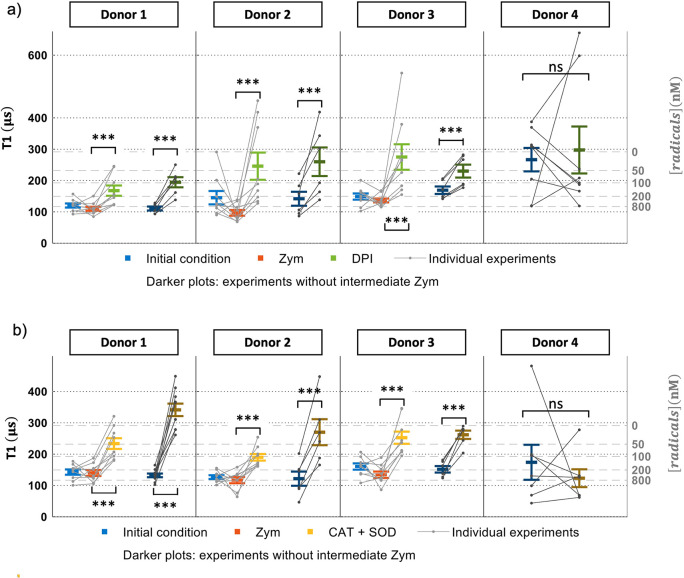
Free radicals are crucial indicators for stress and appear in all kinds of pathogenic conditions, including cancer, cardiovascular diseases, and infection. However, they are difficult to detect due to their reactivity and low abundance. We use relaxometry for the detection of radicals with subcellular resolution. This method is based on a fluorescent defect in a diamond, which changes its optical properties on the basis of the magnetic surroundings. This technique allows nanoscale MRI with unprecedented sensitivity and spatial resolution. Recently, this technique was used inside living cells from a cell line. Cell lines differ in terms of endocytic capability and radical production from primary cells derived from patients. Here we provide the first measurements of phagocytic radical production by the NADPH oxidase (NOX2) in primary dendritic cells from healthy donors. The radical production of these cells differs greatly between donors. We investigated the cell response to stimulation or inhibition.

Keywords: NV centers; magnetometry; nanodiamonds; relaxometry measurements (T1).


Conflict of interest statement

The authors declare no competing financial interest.

Figures

Figure 1
Figure 1
Diamond uptake by primary human DCs: (a) DCs incubated with 2 μg/mL bare FNDs or (b) 2 μg/mL liposome coated FNDs. (c) Quantitative analysis of FND uptake per cell. The experiment was repeated three times on cells from each donor, and three to four donors were tested; 50 cells were counted. Color code: green, Phalloidin-FITC, staining actin filaments (also known as F-actin); blue: DAPI (staining DNA); red: FNDs. Error bars stand for mean ± SD.
Figure 2
Figure 2
Subcellular location of FNDs revealed by confocal microscopy. (a) FNDs colocalize with pHrodo Green conjugate E. coli particles inside human primary DCs. DCs were incubated with pHrodo Green conjugate E. coli particles to stain endosomes and lysosomes, and FNDs were added separately. Color code: green, pHrodo Green conjugate E. coli particles; red, FNDs. The scale bar is 20 μm.
Figure 3
Figure 3
Cell viability test by an MTT assay. 100% represents a control with no exposure to FNDs. The experiment was repeated for cells from three donors, and error bars represent the standard deviations. The data were analyzed by using one-way ANOVA in comparison to the control group. ***p ≤ 0.001 is defined as significant.
Figure 4
Figure 4
Free radical generation in single human DCs from each donor determined by T1. Prior to T1 measurements FNDs were ingested by cells. The gray lines connect data points from an experiment. Every gray sequence was measured in a single particle within a single cell and repeated six to nine independent times for each donor. The different lines were recorded from a different cell and a different particle from the same donor. The averages from multiple particles for each donor are shown in color. (a) Initial T1 values were collected from cells, and then zymosan (zym) was added and T1 was recorded. Finally, DPI was added. In (b) the same sequence is performed as in (a), with the difference being that SOD/CAT was added instead of DPI. For donors 1–3, T1 measurements were performed with or without zymosan A stimulation. For donor 4, T1 measurements were performed without zymosan A. Each T1 measurement takes 10 min. Error bars represent mean ± standard deviation, and data between each group were analyzed by a paired t test: ns,no significant difference. ***p < 0.0001 represents a significant difference.
Figure 5
Figure 5
Cellular ROS measurement by a DCFDA assay. (a) Cellular ROS measurements after exposure to stimuli or inhibitors. (b) Cellular ROS measurements after cells are stimulated by FNDs or zymosan A for 2 h. Legend: control, cells without DCFDA staining; initial, cells without any treatment but stained with DCFDA; DPI, diphenyleneiodonium chloride (final concentration 50 μM/mL); SOD, superoxide dismutase (final concentration 1000 U/mL); CAT, catalase (final concentration 600 U/mL). The experiment was repeated three to four times on cells from three donors. Error bars represent mean ± standard deviation. The data were analyzed by a paired t test between each group, and *p < 0.05, **p < 0.01, and ***p < 0.001 represent significant differences.

References

    1. Lobo V.; Patil A.; Phatak A.; Chandra N. N. Free radicals, antioxidants and functional foods: Impact on human health. Pharmacogn. Rev. 2010, 4 (8), 118.10.4103/0973-7847.70902. - DOI - PMC - PubMed
    1. Knight J. A. Review: Free radicals, antioxidants, and the immune system. Annals of Clinical & Laboratory Science. 2000, 30 (2), 145–158. - PubMed
    1. Cechim G.; Chies J. A. In vitro generation of human monocyte-derived dendritic cells methodological aspects in a comprehensive review. An. Acad. Bras. Cienc. 2019, 91 (4), 1.10.1590/0001-3765201920190310. - DOI
    1. Karlsson A.; Nygren E.; Karlsson J.; Nordström I.; Dahlgren C.; Eriksson K. Ability of Monocyte-Derived Dendritic Cells To Secrete Oxygen Radicals in Response to Formyl Peptide Receptor Family Agonists Compared to That of Myeloid and Plasmacytoid Dendritic Cells. Clin. Vaccine Immunol. 2007, 14 (3), 328–330. 10.1128/CVI.00349-06. - DOI - PMC - PubMed
    1. Hampton M. B.; Kettle A. J.; Winterbourn C. C. Inside the neutrophil phagosome: oxidants, myeloperoxidase, and bacterial killing. Blood 1998, 92 (9), 3007–3017. 10.1182/blood.V92.9.3007.421k47_3007_3017. - DOI - PubMed

Publication types