. 2022 Jul;102(1):136-148.
doi: 10.1016/j.kint.2021.10.041. Epub 2021 Dec 18.

A glomerular transcriptomic landscape of apolipoprotein L1 in Black patients with focal segmental glomerulosclerosis

Collaborators, Affiliations

A glomerular transcriptomic landscape of apolipoprotein L1 in Black patients with focal segmental glomerulosclerosis

Michelle T McNulty et al. Kidney Int. 2022 Jul.

Abstract

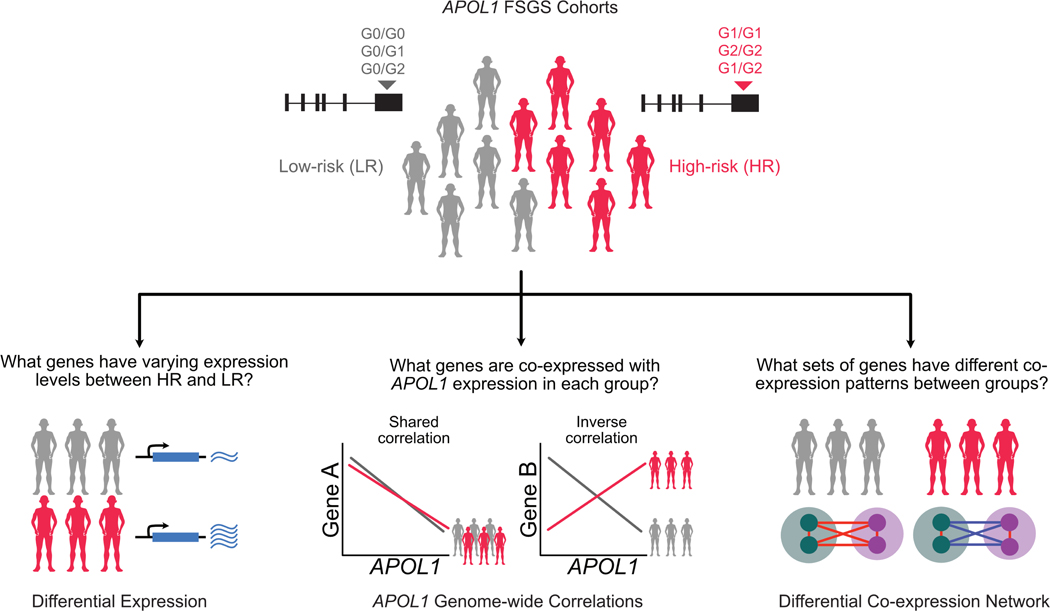
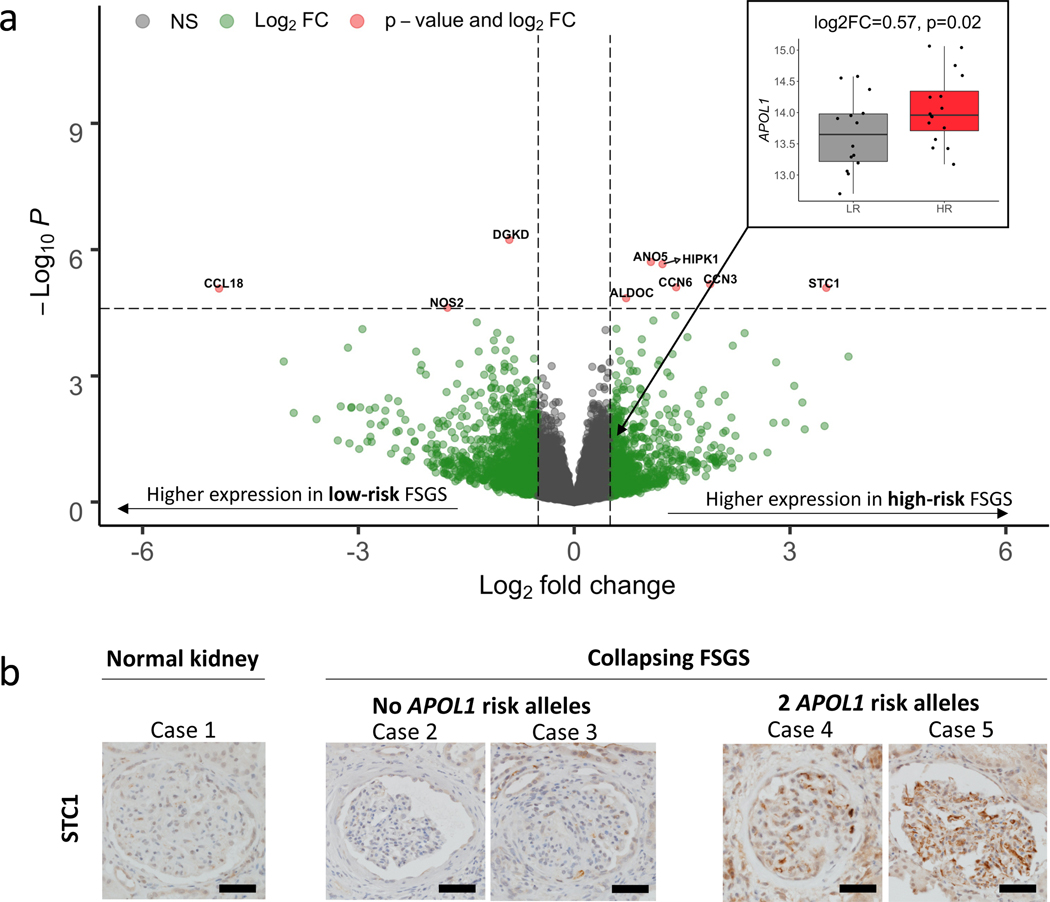
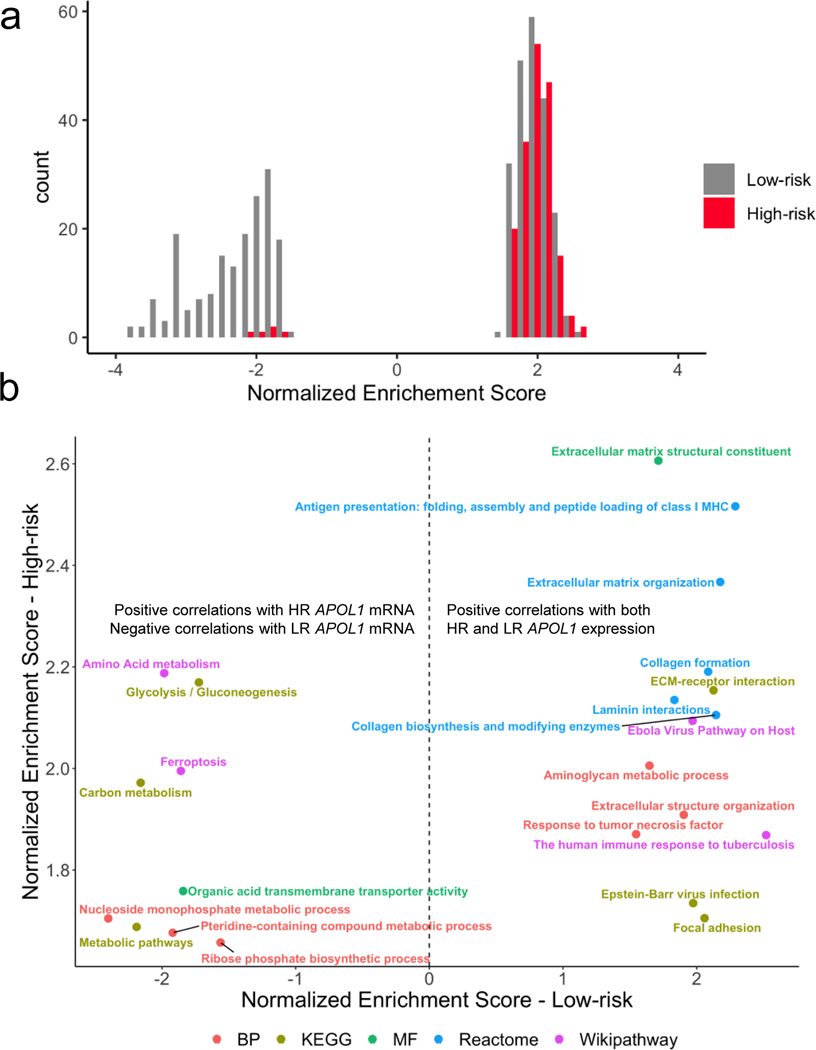
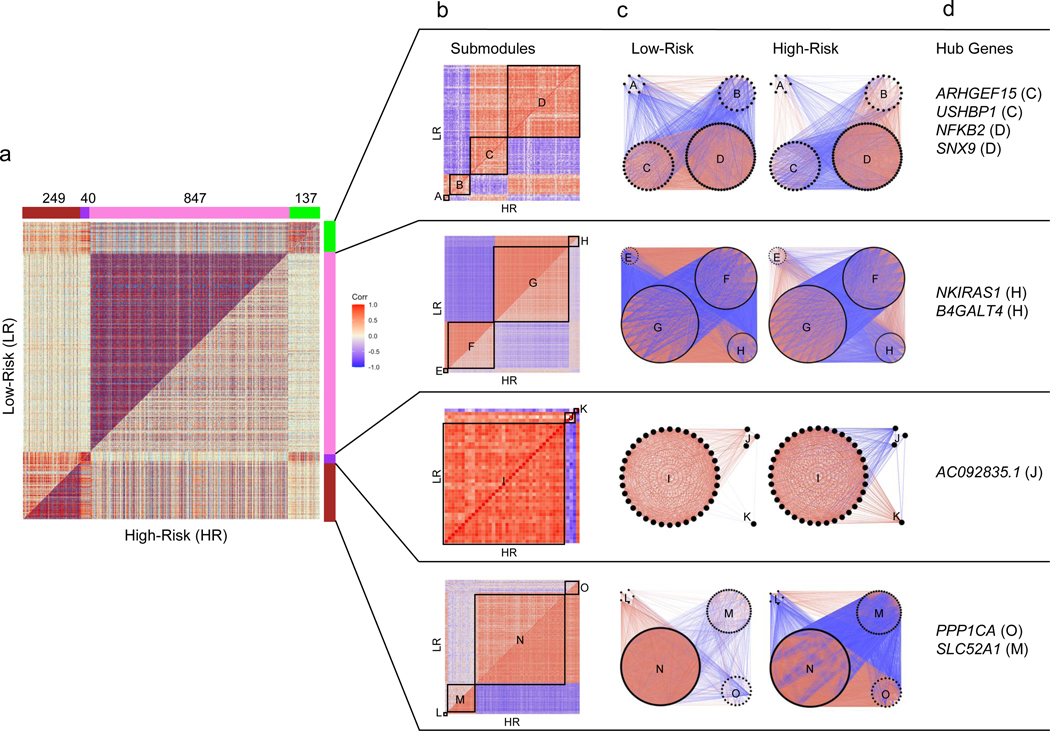
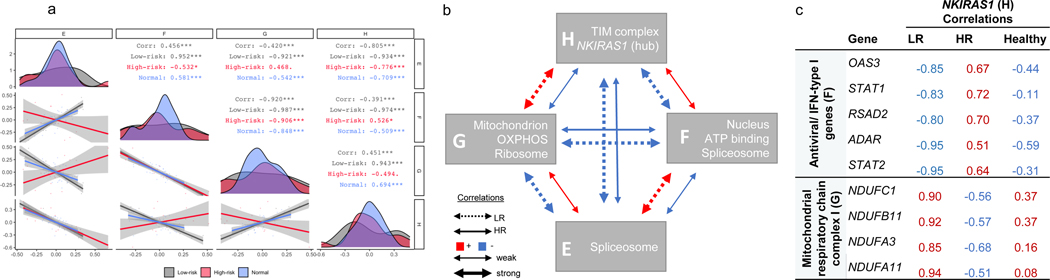
Apolipoprotein L1 (APOL1)-associated focal segmental glomerulosclerosis (FSGS) is the dominant form of FSGS in Black individuals. There are no targeted therapies for this condition, in part because the molecular mechanisms underlying APOL1's pathogenic contribution to FSGS are incompletely understood. Studying the transcriptomic landscape of APOL1 FSGS in patient kidneys is an important way to discover genes and molecular behaviors that are unique or most relevant to the human disease. With the hypothesis that the pathology driven by the high-risk APOL1 genotype is reflected in alteration of gene expression across the glomerular transcriptome, we compared expression and co-expression profiles of 15,703 genes in 16 Black patients with FSGS at high-risk vs 14 Black patients with a low-risk APOL1 genotype. Expression data from APOL1-inducible HEK293 cells and normal human glomeruli were used to pursue genes and molecular pathways uncovered in these studies. We discovered increased expression of APOL1 and nine other significant differentially expressed genes in high-risk patients. This included stanniocalcin, which has a role in mitochondrial and calcium-related processes along with differential correlations between high- and low-risk APOL1 and metabolism pathway genes. There were similar correlations with extracellular matrix- and immune-related genes, but significant loss of co-expression of mitochondrial genes in high-risk FSGS, and an NF-κB-down regulating gene, NKIRAS1, as the most significant hub gene with strong differential correlations with NDUF family (mitochondrial respiratory genes) and immune-related (JAK-STAT) genes. Thus, differences in mitochondrial gene regulation appear to underlie many differences observed between high- and low-risk Black patients with FSGS.

Keywords: focal segmental glomerular sclerosis; gene expression; glomerulus; mitochondria; nephrotic syndrome.


Figures

Figure 1 -
Figure 1 -. Analysis schematic:
APOL1 risk variants were genotyped for Black participants with FSGS from the NEPTUNE cohort. There were 16 high-risk (“HR,” 2 risk variants) and 14 low-risk (“LR,” 0 or 1 risk variant) participants. Three glomerular transcriptomic analyses were used to illuminate mRNA expression differences as a function of risk genotype and APOL1 expression. (1) differential expression to identify genes with varying expression between the HR and LR FSGS group. (2) transcriptome-wide correlation of single genes with APOL1 to identify similarities and differences between genes coexpressed with APOL1 specifically in HR versus LR state. (3) differential co-expression to go beyond solely APOL1 correlations and identify groups of genes whose co-expression differs with each other in the HR and LR APOL1 state. The latter two analyses empowered identification of potential molecular perturbations between groups that are not reflected through differential expression.
Figure 2 -
Figure 2 -. Differential expression volcano plot:
a) Genes (represented as dots) up-regulated in high-risk samples, as compared to low-risk samples, are indicated with positive log2 fold change. Vertical hashed bars indicate log2 fold change of −0.5 and 0.5, which we define as the threshold for differential expression. The horizontal hashed bar indicates the adjusted significant p-value threshold 0.05 (Punadjusted ~ 2.5×10⁻⁵). Red dots identify the nine genes that passed the multiple testing correction with absolute fold change > 0.5. Green dots are differentially expressed genes that do not pass our significance threshold. Insert - Differential expression of APOL1 in the low risk (gray) and high risk (red) states. b) Differences in glomerular immunohistochemical staining of STC1 in the normal human kidney compared to biopsies of patients with Collapsing FSGS and zero or two confirmed APOL1 risk alleles. Most-preserved glomeruli are captured. STC1 is only weakly expressed in normal glomeruli and in glomeruli of patients with collapsing FSGS and wildtype APOL1 risk alleles. In contrast, patients with FSGS with collapsing features and two APOL1 risk alleles show increased glomerular staining, diffusely detected in the glomerular endothelium. No definitive staining was seen in podocytes. Scale bars: 50mm.
Figure 3 -
Figure 3 -. Connectivity Map (CMAP):
a) Schematic of CMAP analysis. Differentially expressed glomerular genes in the high risk (HR) versus low risk (LR) state with absolute log2 fold change > 0.75 and unadjusted p-value < 0.05 were selected for the CMAP query. Red dots indicate genes with higher expression in the HR group, and gray dots indicate genes with higher expression in LR group. This gene set pattern was then compared to CMAP analyses of the impact of perturbagens - including compounds, gene knockdowns, and gene overexpression – on gene expression of the HAE1 kidney cell. Perturbagens with a positive score match our analysis, i.e., genes increased/decreased in HR are also increased/decreased in response to the perturbagen. Perturbagens with a negative score inversely match our analysis, i.e., genes increased/decreased in HR are decreased/increased in response to the perturbagen. b) Heatmap of CMAP HAE1 z-scores from the top three positive and negatively enriched perturbations for each category (KD=knockdown, OE=overexpression, CP=compound). Genes (y-axis) are sorted by the log2 fold change in the high-risk versus low-risk FSGS differential expression analysis. Numbers in parentheses indicate percentile of match among all perturbagens applied to HAE1 cells.
Figure 4 -
Figure 4 -. APOL1 genome-wide correlations:
a) Histogram of gene set enrichment analysis (GSEA) normalized enrichment scores (NES) with FDR < 0.05, stratified by risk genotype. Enrichments among genes negatively correlated with APOL1 are indicated by a negative NES, and enrichments among genes positively correlated with APOL1 are indicated by a positive NES. In the low risk (LR) group, there was enrichment among genes positively and negatively correlated with APOL1. In high risk (HR), most enrichments were among genes positively correlated with APOL1 expression. b) Comparison of enrichment terms common to both HR and LR FSGS colored by gene annotation dataset. Annotations to the right of the hashed line indicate gene sets enriched among genes positively correlated with both HR and LR APOL1 expression. Annotations to the left of the hashed line indicate gene sets negatively correlated with LR APOL1 expression and positively correlated with HR APOL1 expression.
Figure 5 -
Figure 5 -. Differential co-expression analysis of 15,703 protein-coding genes in high-risk versus low-risk FSGS:
(Positive correlations are red and negative are blue throughout all figures). a) Symmetric correlation heatmap of differentially co-expressed genes grouped into four modules (“Brown,” “Purple,” “Pink,” “Green”). Each row and column is a single gene. The upper triangle (above the diagonal) reflects correlations in the low risk (LR) samples, and the lower triangle (below the diagonal) the high risk (HR) samples. The number of genes in each module is indicated above the module color. b) Submodule correlation heatmaps for each differentially co-expressed gene module, identified by hierarchical clustering of module genes in each group. LR correlations are reflected on the upper triangle and HR on the bottom. Submodules are labeled alphabetically. c) Gene network view of correlations within and between gene submodules stratified by risk genotype. d) Hub genes (most differentially co-expressed genes), for each module with the corresponding submodule label. Genes with a normalized connectivity > 0.7 were considered hub genes.
Figure 6 -
Figure 6 -. Characterization of the ‘Pink’ differentially co-expressed module:
a) Spearman correlation of submodule eigengenes in high risk (HR), low risk (LR), and normal glomerular tissue (HR – red; LR – black, normal – blue). Eigengenes summarize overall gene expression behavior in each submodule and were defined as the first principal component of the group- specific gene expression matrices. Submodules are labeled along the x and y-axis. Diagonal – eigengene density plots. Below diagonal – scatter plot comparing submodule eigengenes (each point represents a sample). Above diagonal – Spearman correlations stratified by group (“Corr” – all groups combined). Correlation significance - “***” p < 0.01, “**” p<0.01, “*” p<0.05, “.” p<0.1. b) HR and LR correlation schematic of the four ‘Pink’ submodules with selected enriched biology. c) We identified the top 10% of Pink module genes differentially co-expression with NKIRAS1, resulting in 30 and 55 genes from F and G submodules, respectively. Presented here are HR, LR, and healthy NKIRAS1 correlations with other genes from the corresponding enrichment analysis. These genes are among the strongest differentially correlated genes with NKIRAS also enriched for known biology. Absolute correlations are stronger in the LR group compared to the HR group and correlation patterns in the healthy tissue are more similar to LR, compared to HR group.

Comment in

References

    1. Genovese G, Friedman DJ, Ross MD, et al. Association of trypanolytic ApoL1 variants with kidney disease in African Americans. Science 2010; 329: 841–845. - PMC - PubMed
    1. Tzur S, Rosset S, Shemer R, et al. Missense mutations in the APOL1 gene are highly associated with end stage kidney disease risk previously attributed to the MYH9 gene. Hum Genet 2010; 128: 345–350. - PMC - PubMed
    1. Kopp JB, Nelson GW, Sampath K, et al. APOL1 genetic variants in focal segmental glomerulosclerosis and HIV-associated nephropathy. J Am Soc Nephrol 2011; 22: 21292137. - PMC - PubMed
    1. Ng DK, Robertson CC, Woroniecki RP, et al. APOL1-associated glomerular disease among African-American children: a collaboration of the Chronic Kidney Disease in Children (CKiD) and Nephrotic Syndrome Study Network (NEPTUNE) cohorts. Nephrol Dial Transplant 2017; 32: 983–990. - PMC - PubMed
    1. Foster MC, Coresh J, Fornage M, et al. APOL1 variants associate with increased risk of CKD among African Americans. J Am Soc Nephrol 2013; 24: 1484–1491. - PMC - PubMed

Publication types

MeSH terms