. 2022 Jan 4;119(1):e2111703119.
doi: 10.1073/pnas.2111703119.

SF3B1 mutant-induced missplicing of MAP3K7 causes anemia in myelodysplastic syndromes

Affiliations

SF3B1 mutant-induced missplicing of MAP3K7 causes anemia in myelodysplastic syndromes

Yen K Lieu et al. Proc Natl Acad Sci U S A. .

Abstract

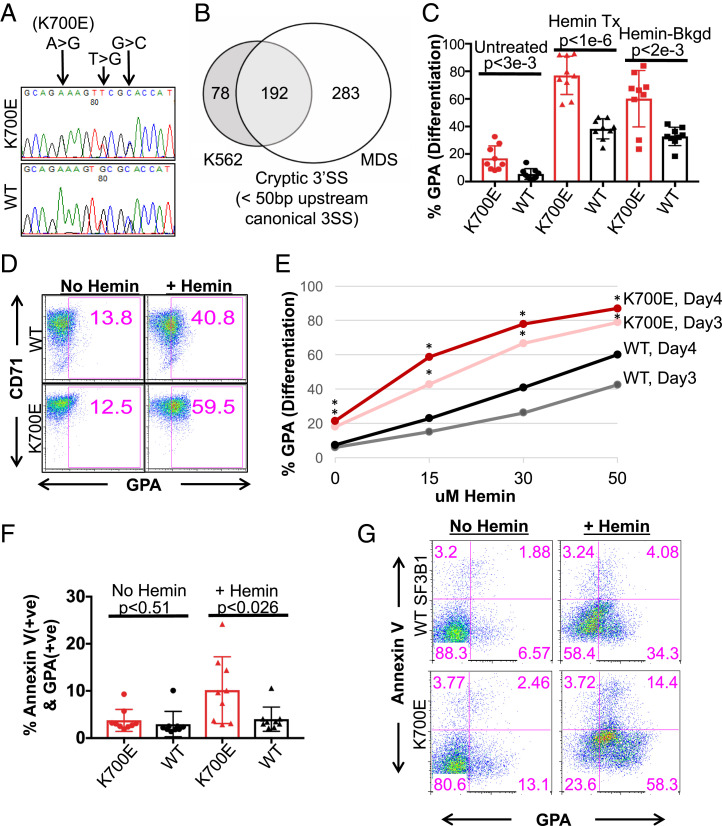
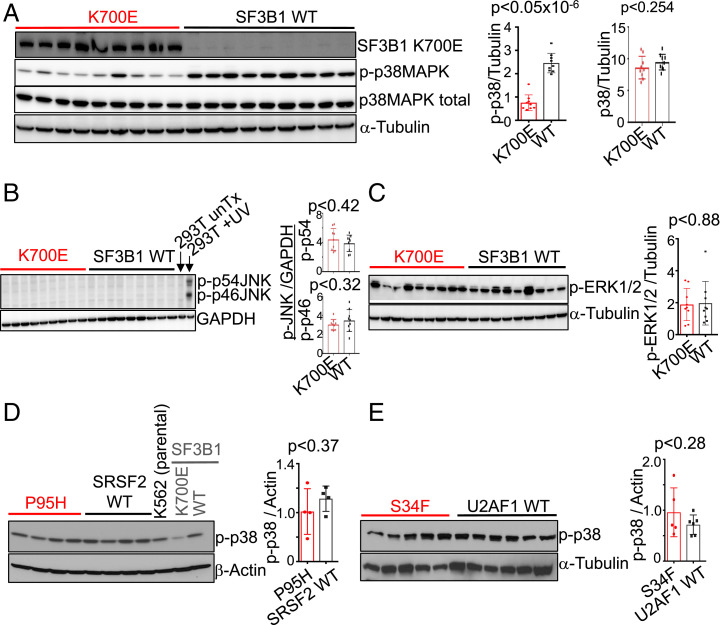
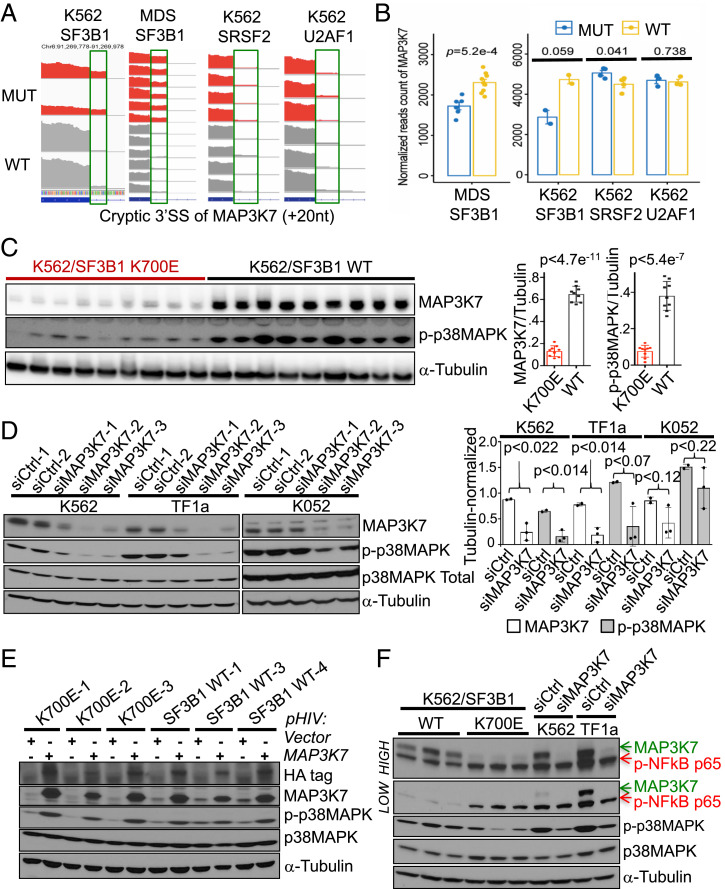
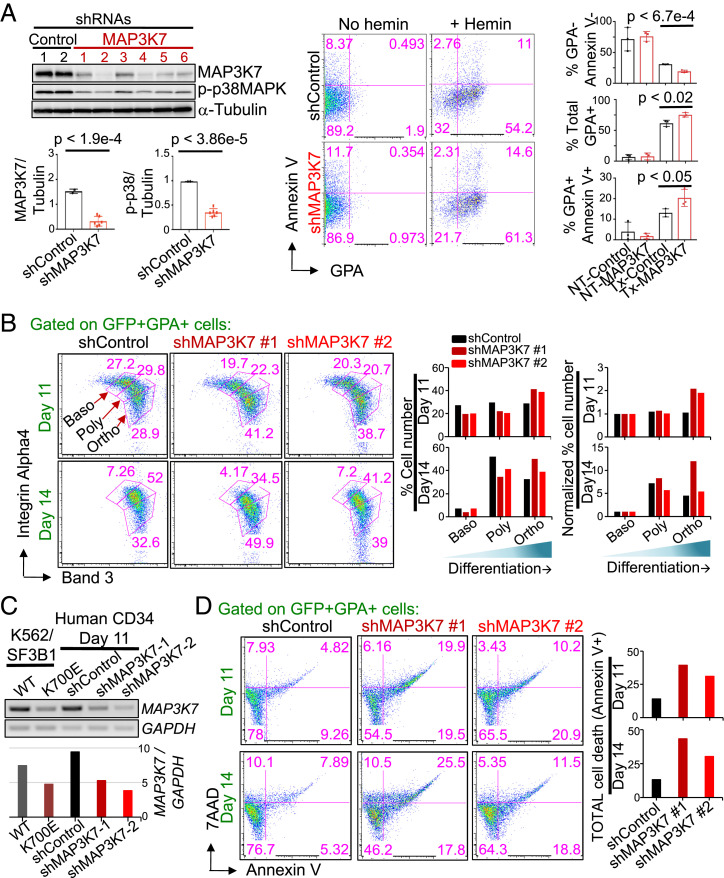
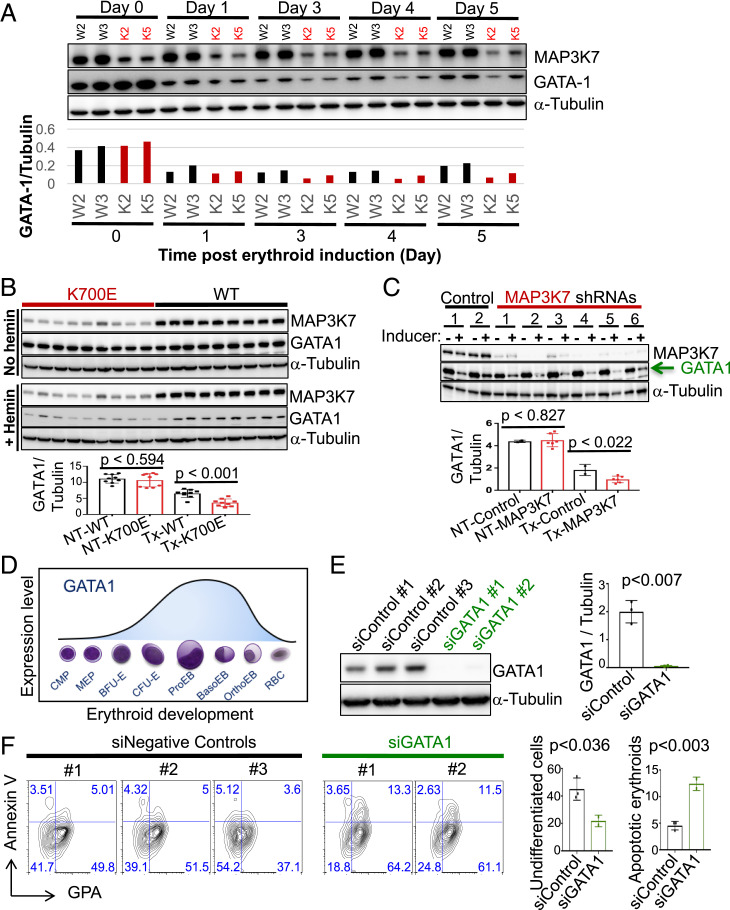
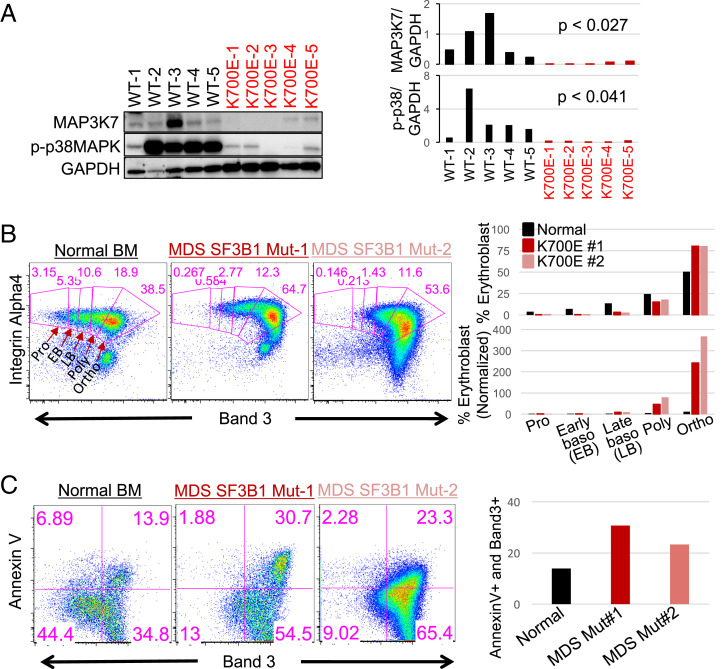
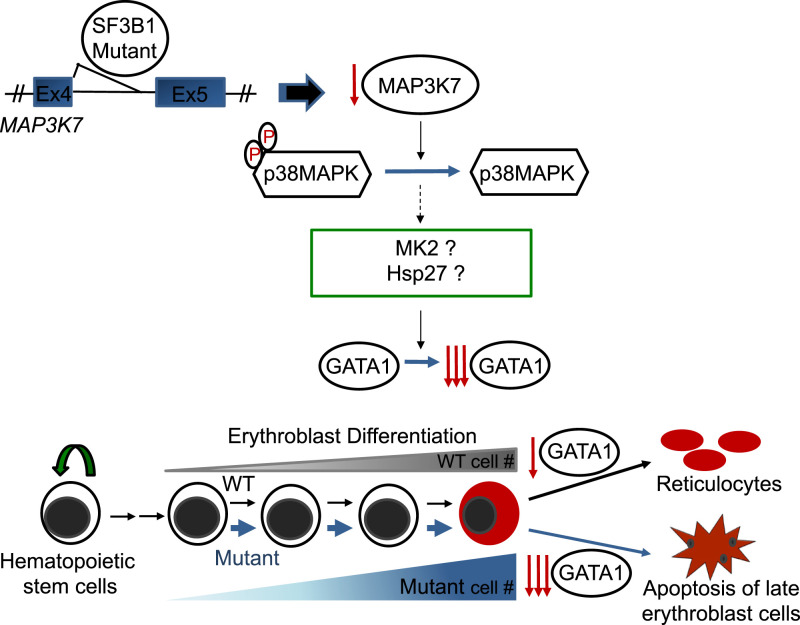
SF3B1 is the most frequently mutated RNA splicing factor in cancer, including in ∼25% of myelodysplastic syndromes (MDS) patients. SF3B1-mutated MDS, which is strongly associated with ringed sideroblast morphology, is characterized by ineffective erythropoiesis, leading to severe, often fatal anemia. However, functional evidence linking SF3B1 mutations to the anemia described in MDS patients harboring this genetic aberration is weak, and the underlying mechanism is completely unknown. Using isogenic SF3B1 WT and mutant cell lines, normal human CD34 cells, and MDS patient cells, we define a previously unrecognized role of the kinase MAP3K7, encoded by a known mutant SF3B1-targeted transcript, in controlling proper terminal erythroid differentiation, and show how MAP3K7 missplicing leads to the anemia characteristic of SF3B1-mutated MDS, although not to ringed sideroblast formation. We found that p38 MAPK is deactivated in SF3B1 mutant isogenic and patient cells and that MAP3K7 is an upstream positive effector of p38 MAPK. We demonstrate that disruption of this MAP3K7-p38 MAPK pathway leads to premature down-regulation of GATA1, a master regulator of erythroid differentiation, and that this is sufficient to trigger accelerated differentiation, erythroid hyperplasia, and ultimately apoptosis. Our findings thus define the mechanism leading to the severe anemia found in MDS patients harboring SF3B1 mutations.

Keywords: GATA1; cancer; erythropoiesis; p38 MAPK; spliceosome.


Conflict of interest statement

Competing interest statement: Y.K.L., J.Z., J.L.M., and S.M. are supported in part by a grant from Celgene Pharmaceutical Company (currently Bristol Myers Squibb); R.R. is a member of the AimedBio SAB and a founder of Genotwin. None of the work is directly related to the current manuscript.

Figures

Fig. 1.
Fig. 1.
K562/SF3B1 K700E cells exhibit accelerated differentiation and increased erythroid cell death as compared to WT cells. (A) DNA chromatograms of representative K562/SF3B1 mutant and WT clones, showing K700E and two silent mutations in the SF3B1 gene. (B) Venn diagram showing the overlap of cryptic 3′ss (cutoff at q-value < 0.05, distance < 50 nt to the associated canonical 3′ss) that were utilized significantly more in SF3B1 mutants than in SF3B1 WT K562 cells and MDS patients. (C) Bar graph quantifying the percentage of surface GPA+ cells as analyzed by flow cytometry (FACS) with cells that were treated or not with the erythroid inducer hemin (50 μM) for 3 d. Data shown represent n = 6 independent experiments. Each dot represents an independently derived cell clone. P values obtained from t tests are shown. (D) FACS plots of representative mutant and WT clones from C with similar background, displaying percent CD71 (transferrin receptor) and GPA+ cells following hemin treatment, as indicated. GPA positivity was gated based on unstained WT and mutant cells. (E) Line graph displaying percent GPA positive cells vs. various concentrations (μM) of hemin for mutant and WT clones as measured by FACS after 3 and 4 d of hemin or no treatment. *P < 0.05. (F) Bar graph specifying the percentages of AnnexinV vs. GPA expressed on the surface of K700E and WT cells as measured by FACS after hemin (50 μM) or no treatment for 4 d. Representative data from n = 4 independent experiments. P values from t tests are shown. (G) FACS plots (lower left quadrants of each plot: GPA-AnnexinV as undifferentiated cells; Lower Right quadrants: GPA+AnnexinV as nonapoptotic erythroids; Upper Right quadrants: GPA+AnnexinV+ as apoptotic erythroids; Upper Left quadrants: GPAAnnexinV+ as apoptotic cells) of representative mutant and WT clones from G showing the percentages of AnnexinV vs. GPA expression under 4 d of hemin or no treatment.
Fig. 2.
Fig. 2.
p38 MAPK is specifically deregulated and only in mutant SF3B1 cells. (A) Representative western blot images showing expression of total p38 MAPK, phospho-p38 MAPK (p-p38MAPK; p-p38), SF3B1 K700E and α-Tubulin in the independent mutant and WT K562/SF3B1 clones. n = 5 independent experiments. Representative western blot analysis of (B) phospho-JNK (p-p46 and p-p54) and GAPDH, and (C) phospho-ERK1/2 (p-ERK12) and α-Tubulin in K562/SF3B1 K700E and WT clones. Representative western blot analysis of p-p38 in (D) K562/SRSF2 mutant (P95H) and WT and in (E) K562/U2AF1 mutant (S34F) and WT independent clones. For B and C, n ≥ 3, and for D and E, n = 2 independent experiments. Bar graphs are shown next to all western blot images, displaying results of ImageJ-quantified, loading control-normalized protein band intensities and P values from t tests.
Fig. 3.
Fig. 3.
MAP3K7 transcripts are misspliced in mutant SF3B1 cells, and this is responsible for p38 deactivation. (A) RNA-seq coverage plots of MAP3K7 cryptic 3′ss transcripts in WT and mutated samples from (left to right) K562/SF3B1, MDS patients, K562/SRSF2, and K562/U2AF1 cells. (B) Comparison of total MAP3K7 mRNA levels (normalized reads counts) in WT and mutated RNA-seq samples from (left to right) MDS patients, K562/SF3B1, K562/SRSF2, and K562/U2AF1 cells. P values from t tests are shown. (C) Representative western blot images showing expression of MAP3K7, p-p38 MAPK, and α-Tubulin proteins in the independent mutant and WT K562/SF3B1 clones. n ≥ 6 independent experiments. (Right) Bar graphs displaying the results of ImageJ-quantified, α-Tubulin-normalized band intensities and P values from t tests. (D) Representative western blot analysis of the effects on p-p38 MAPK and total p38 MAPK expression in MAP3K7 KD K562, TF1a, and K052 cells using two different negative control siRNAs (siCtrl-1/2) and three different siRNAs specific for MAP3K7. n ≥ 3 independent experiments. (Right) Bar graphs displaying the results of ImageJ-quantified, α-Tubulin–normalized band intensities and P values from t tests. (E) Representative western blot analysis of the effects on p-p38 MAPK and total p38 MAPK expression in three WT and three mutant K562 clones expressing HA-tagged MAP3K7. n ≥ 3 independent experiments. (F) Representative western blot analysis of the effects on phospho-NF-κB p65 (p-NF-κB p65), p-p38 MAPK and total p38 MAPK expression in MAP3K7 KD K562 and TF1a cells using negative control siRNA #1 and siMAP3K7 #2 (see D). Expression of p-NF-κB p65 in three mutant and three WT K562/SF3B1 is also shown. “Low” and “High” represent different exposures of the same gel. n = 3 independent experiments.
Fig. 4.
Fig. 4.
KD of MAP3K7 in parental K562 and normal human CD34+ cells causes increased erythroid differentiation and cell death. (A) Images (from Left to Right) of representative western blot analysis of GFP-sorted, shRNA-mediated MAP3K7 KD (two different negative control and six different MAP3K7 shRNAs) in parental K562 cells, representative two-color FACS plot of AnnexinV vs. GPA from a control and shMAP3K7, and bar graphs showing the averages and SDs of (from Top to Bottom) % GPAAnnexin (undifferentiated cells), % total GPA+ (nonapoptotic erythroids), and % GPA+AnnexinV+ cells (apoptotic erythroids) after 3 d of treatment with 50 μM hemin from three independent experiments. Bar graphs displaying the results of ImageJ-quantified, α-Tubulin–normalized MAP3K7 and p-p38 band intensities in Western blot analysis are shown below the Western blot. P values from t tests are labeled on all bar graphs. (B) Representative FACS plots showing surface expression of Integrin α-4 and band 3 from day 11 and day 14 shRNA-mediated MAP3K7 KD (one negative control and two different MAP3K7 shRNAs) in human erythropoietin (EPO)-induced CD34+ cells that were CD45 and double-positive GFP+GPA+ (= erythroblasts cells). Erythroblast stages are depicted and labeled (Baso, basophilic normoblast; Poly, polychromatophilic normoblast; Ortho, othrochromatic normoblast). (Right) Bar graphs, quantifying the percentage of erythroblasts in each stage, are shown, as well as Baso-normalized percent erythroid cells for comparison. n = 2 independent experiments. (C) RT-PCR showing day 11 shRNA-mediated MAP3K7-KD expression in day 11 EPO-induced CD34+ cells. Abundance of GAPDH-normalized MAP3K7 expression is depicted in the bar graph below. (D) Representative FACS analysis of cell death via 7AAD and AnnexinV from (C) day 11 and day 14 MAP3K7 KD, human EPO-induced, CD45GFP+GPA+ erythroblasts. Bar graphs, specifying the percentage of total erythroblast cell death, are shown. n = 2 independent experiments.
Fig. 5.
Fig. 5.
Premature down-regulation of GATA1 in differentiated K700E or MAP3K7 KD cells underlies the accelerated differentiation and erythroid cell death. (A) Western blot analysis (Upper) and quantifying bar graph (Lower) showing expression of GATA-1 during a 5-d time course of treatment with 50 μM hemin to induce erythroid differentiation in two representative K700E (K2 and K5) and two representative WT (W2 and W3) K562/SF3B1 clones. (B) Representative western blot images showing GATA-1 protein expression in the nine mutant and nine WT K562/SF3B1 clones that were treated or not with 50 μM hemin for 3 d. Bar graph displaying the results of ImageJ-quantified, α-Tubulin–normalized GATA-1 band intensity and P values from t tests. n = 4 independent experiments. (C) Representative western blot image of GATA-1 expression in shRNA-mediated MAP3K7 KD parental K562 cells that were treated or not with 50 μM hemin for 3 d. n = 3 independent experiments. (D) Illustration (adapted from ref. 32) showing GATA1 expression during the course of erythroid development from myeloid progenitor cell (CMP) to mature red blood cell (RBC). BasoEB, basophilic erythroblast/normoblast; BFU-E, Burst-forming unit-erythroid; CFU-(E) colony-forming unit-erythroid; MEP, megakaryocyte-erythroid progenitor; OrthoEB, orthochromatic erythroblast/normoblast; ProEB, Proerythroblast. (E) Western blot image showing GATA-1 KD (two different GATA-1 and three different negative control siRNAs) expression in parental K562 cells and (F) its effects on erythroid differentiation and erythroid apoptosis via FACS analysis of AnnexinV vs. GPA after 3 d of 50 μM hemin treatment. Bar graphs (Right) indicate percent undifferentiated cells (double-negative GPAAnnexinV) and percent apoptotic erythroid cells (double-positive GPA+AnnexinV+). P values from t tests are shown. n = 3 independent experiments. GPA positivity was gated based on unstained parental K562 cells.
Fig. 6.
Fig. 6.
Mutant SF3B1 MDS patient cells display phenotypes observed in K562/SF3B1 mutant cells and MAP3K7 KD cells. (A) Western blot analysis showing MAP3K7 and p-p38 MAPK expression in MDS BM mononuclear cells from five patients with WT and five patients with K700E SF3B1 mutation. (Right) Bar graphs quantifying the results of western blots and P values from t tests are shown. (B) Representative FACS plots showing the erythroblast profiles of primary BM cells from SF3B1 K700E MDS patients and normal healthy individual. The isolated CD45 BM cells were stained with three erythroid markers: GPA, Integrin α-4, and band 3. FACS plot of Integrin α-4 vs. band 3 on GPA+ BM cells. Erythroblast stages are depicted and labeled. Bar graphs, quantifying the percentage of nucleated erythroblasts in each stage as a total of 100%, are shown as well as proerythroblast (Pro)-normalized percent erythroid cells for comparison. Three SF3B1 K700E MDS patients and three normal healthy individuals were profiled. EB, early basophilic erythroblasts; LB, late basophilic erythroblasts; Ortho, orthochromatic erythroblasts; Poly, polychromatic erythroblasts; Pro, proethroblasts. (C) Representative FACS analysis of erythroblast cell death via AnnexinV vs. band 3 from (B) Bar graph quantifies the percentage of late-stage erythroblast cell death (AnnexinV+Band3+).
Fig. 7.
Fig. 7.
A model for how SF3B1 mutations cause anemia. SF3B1 K700E, and other hotspot mutations induce an error in splicing of MAP3K7 transcripts, resulting in reduced levels of MAP3K7. This leads to a reduction of inactivated, phosphorylated p38MAPK (p-p38), which in turn affects downstream potential targets, such as MAPKAPK2 (MK2), HSP27, and HSP70. Ultimately, this causes faster and greater down-regulation of GATA1, resulting in accelerated differentiation and erythroid cell death, thereby explaining the anemia that characterizes MDS patients harboring SF3B1 mutations.

References

    1. Sperling A. S., Gibson C. J., Ebert B. L., The genetics of myelodysplastic syndrome: From clonal haematopoiesis to secondary leukaemia. Nat. Rev. Cancer 17, 5–19 (2017). - PMC - PubMed
    1. Cogle C. R., Craig B. M., Rollison D. E., List A. F., Incidence of the myelodysplastic syndromes using a novel claims-based algorithm: High number of uncaptured cases by cancer registries. Blood 117, 7121–7125 (2011). - PMC - PubMed
    1. Ogawa S., Genetics of MDS. Blood 133, 1049–1059 (2019). - PMC - PubMed
    1. Malcovati L., et al. ; Chronic Myeloid Disorders Working Group of the International Cancer Genome Consortium and of the Associazione Italiana per la Ricerca sul Cancro Gruppo Italiano Malattie Mieloproliferative, Clinical significance of SF3B1 mutations in myelodysplastic syndromes and myelodysplastic/myeloproliferative neoplasms. Blood 118, 6239–6246 (2011). - PMC - PubMed
    1. Papaemmanuil E., et al. ; Chronic Myeloid Disorders Working Group of the International Cancer Genome Consortium, Somatic SF3B1 mutation in myelodysplasia with ring sideroblasts. N. Engl. J. Med. 365, 1384–1395 (2011). - PMC - PubMed

Publication types

MeSH terms