. 2021 Dec 28;118(52):e2103015118.
doi: 10.1073/pnas.2103015118.

Common sequence motifs of nascent chains engage the ribosome surface and trigger factor

Affiliations

Common sequence motifs of nascent chains engage the ribosome surface and trigger factor

Annika Deckert et al. Proc Natl Acad Sci U S A. .

Abstract

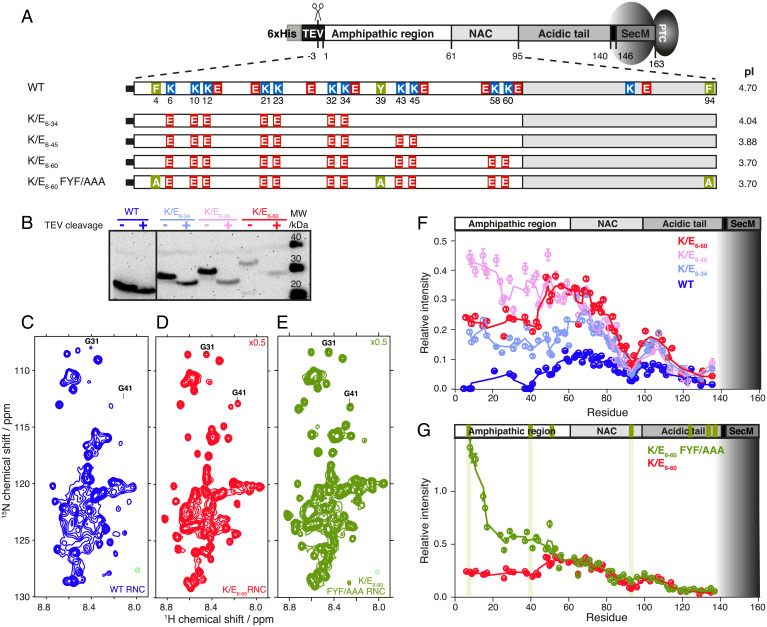
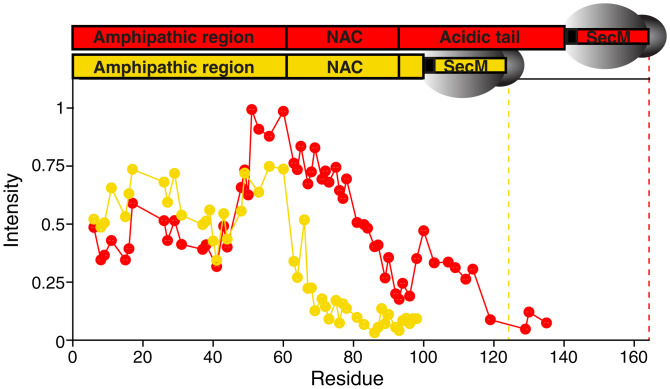
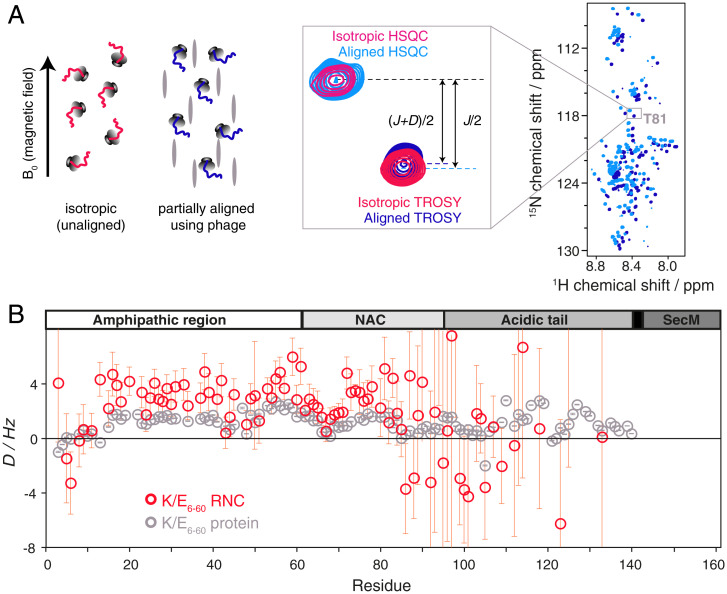
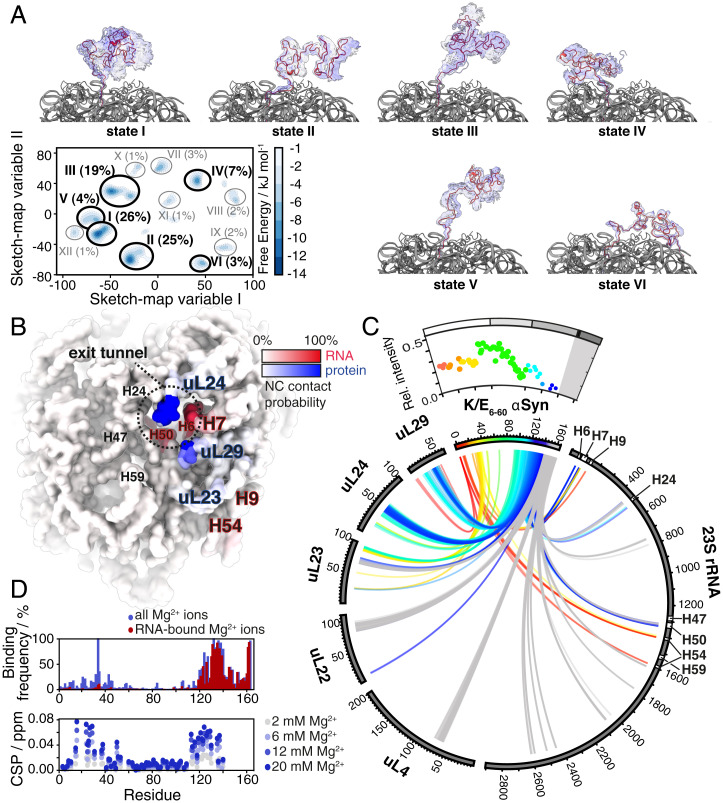
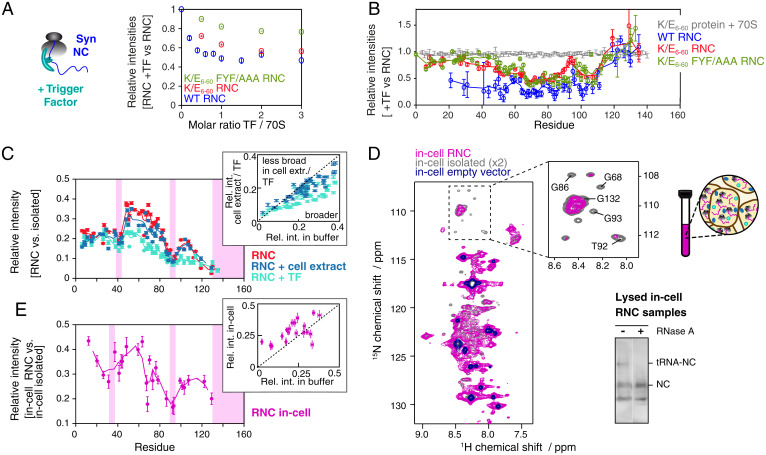
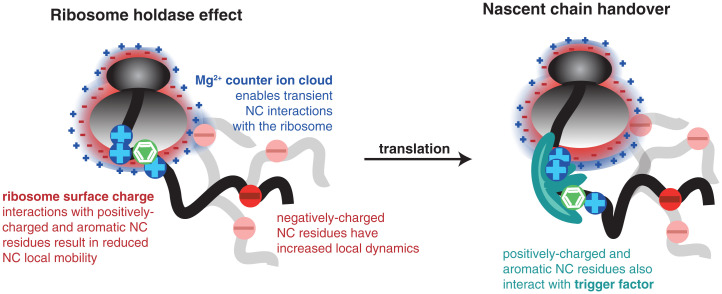
In the cell, the conformations of nascent polypeptide chains during translation are modulated by both the ribosome and its associated molecular chaperone, trigger factor. The specific interactions that underlie these modulations, however, are still not known in detail. Here, we combine protein engineering, in-cell and in vitro NMR spectroscopy, and molecular dynamics simulations to explore how proteins interact with the ribosome during their biosynthesis before folding occurs. Our observations of α-synuclein nascent chains in living Escherichia coli cells reveal that ribosome surface interactions dictate the dynamics of emerging disordered polypeptides in the crowded cytosol. We show that specific basic and aromatic motifs drive such interactions and directly compete with trigger factor binding while biasing the direction of the nascent chain during its exit out of the tunnel. These results reveal a structural basis for the functional role of the ribosome as a scaffold with holdase characteristics and explain how handover of the nascent chain to specific auxiliary proteins occurs among a host of other factors in the cytosol.

Keywords: NMR spectroscopy; alpha synuclein; cotranslational folding; in-cell NMR; structural biology.


Conflict of interest statement

The authors declare no competing interest.

Figures

Fig. 1.
Fig. 1.
Charged and aromatic residues determine NC-ribosome interactions in αSyn. (A) Charge variants used to investigate the effects of electrostatic forces on NC interactions, highlighting the 11 Lys residues of the amphipathic region of αSyn (1 to 60) that were mutated to Glu residues. The K/E6–60 FYF/AAA variant has aromatic residues replaced with Ala. (B) Anti-SecM Western blot of the αSyn RNC mutants (before and after TEV protease cleavage). (C–E) 1H, 15N-SOFAST-HMQC spectrum of the WT αSyn RNC, K/E6–60 (scaled 0.5× relative to WT, red), and K/E6–60 FYF/AAA αSyn RNCs (scaled 0.5× relative to WT, green) at 700 MHz and 277 K. G31 and G41 are indicated as representative examples of the assigned resonances. (F) Cross-peak intensities of αSyn RNCs relative to the corresponding isolated protein in the presence of 70S ribosomes: WT (blue), K/E6–34 (light blue), K/E6–45 (pink), and K/E6–60 αSyn (red). Three-point moving averages are shown. The gray shaded area depicts the part of the RNC sequence confined within the ribosomal exit tunnel. (G) Same plot as F but showing K/E6–60 (red) and K/E6–60 FYF/AAA αSyn (green) RNCs. The positions of the aromatic residues within αSyn are indicated in green boxes on the top bar, and those mutated to Ala are indicated using additional vertical green lines.
Fig. 2.
Fig. 2.
Length-dependence of αSyn NC interactions with the ribosome surface. (A) Comparison of the normalized 1H,15N-SOFAST-HMQC intensities (700 MHz, 277 K) of the full-length K/E6–60 RNC (red, containing αSyn residues 1 to 140) and the truncated K/E6–60 1–100 RNC (yellow). The dotted line indicates the most C-terminal residue in each construct.
Fig. 3.
Fig. 3.
Orientational preferences of the K/E6–60 αSyn RNC from RDC measurements. (A) Schematic representation of the RDC experiments used to determine the orientational preferences of the RNC. Measurements are made on RNCs in both unaligned and partially aligned states with respect to the magnetic field of the NMR spectrometer using bacteriophage (represented as gray ovals). Overlay of the 1H,15N-HSQC and TROSY spectra of the K/E6–60 αSyn RNC (950 MHz, 277 K) aligned in the presence of 15.1 mg/mL−1 bacteriophage Pf1 (light blue/blue). A magnified view is centered on resonance T81 and additionally overlaid with unaligned (isotropic) spectra (magenta/red). The dipolar coupling D is inferred from the difference between the isotropic splittings (J-coupling only) and the partially aligned splittings (J+D). (B) N-HN RDCs measured on the K/E6–60 αSyn RNC (red) and on the isolated K/E6–60 protein (gray). Uncertainties are derived from 15N peak linewidths and signal-to-noise ratios (and hence are large for weak intensity, C-terminal RNC resonances).
Fig. 4.
Fig. 4.
RDC-restrained all-atom MD simulation of an αSyn RNC. (A) Free energy landscape of the αSyn K/E6–60 RNC (represented in sketch-map variable space; see Methods); we also show the structures of the six most populated states in the landscape. (B) Surface map of the ribosome, highlighting the NC interaction sites according to binding frequency, with rRNA (red) and ribosomal proteins (blue). (C) Circular plot representing all interactions (defined as two atoms closer than 4.5 Å) between the αSyn K/E6–60 NC and the ribosome, rainbow-colored by primary sequence. The αSyn K/E6–60 RNC relative cross-peak intensities from NMR experiments (as in Fig. 1F) are shown above the circular plot for reference. (D, Top) Mg2+-bound population of the NC residues (defined using a 4.5 Å cutoff distance) in the MD trajectory. (D, Bottom) Chemical shift perturbations in the 1H,15N-SOFAST-HMQC of isolated K/E6–60 αSyn protein in the presence of Mg2+.
Fig. 5.
Fig. 5.
Characterization of the structural properties of αSyn RNCs in a cellular context. (A) Variation in the intensity of the 1H,15N-amide signal of 70S and WT, K/E6–60, and K/E6–60 FYF/AAA αSyn RNCs as a function of the molar ratio of TF to ribosome. (B) Relative cross-peak intensities of the WT (blue), K/E6–60 (red), and K/E6–60 FYF/AAA (green) αSyn RNCs, as well as K/E6–60 protein (with ribosomes) in the presence of 1 mol equivalent TF vs. in the absence of TF (700 MHz, 277 K). Five-point moving averages are plotted. (C) Cross-peak intensities of αSyn K/E6–60 RNC in buffer (red), in 12.5 g/L cell extract (blue), with TF (cyan) relative to isolated αSyn K/E6–60 protein in the presence of 70S, in the presence of cell extract, and in the presence of 70S and TF, respectively. The sites of the strongest broadenings are indicated by pink shadings. The inset shows the correlation between relative cross-peak intensities (RNC relative to protein) in buffer and cell extract (blue) or TF (cyan). (D) 1H,15N-SOFAST-HMQC of E. coli cells expressed with 2H,15N-labeled arrest-enhanced αSyn K/E6–60 RNC (magenta), αSyn K/E6–60 protein (gray), and an empty vector (dark blue) (800 MHz, 298 K). Cross-peaks corresponding to in-cell background species are observed in the latter spectrum. Selected αSyn resonances displaying significant line broadening within the glycine region of the in-cell RNC are indicated in the inset. (Bottom Right) Anti-αSyn Western blot detecting the RNC species after NMR data acquisition and lysis of the in-cell NMR samples. The NC remained >40% bound to the ribosome after NMR data acquisition, although the disruptive nature of cell lysis procedures used to obtain this value imply that the attachment levels are likely to be significantly higher with the depicted in-cell NMR spectrum. (E) Cross-peak intensities of in-cell αSyn K/E6–60 RNC relative to in-cell αSyn K/E6–60 protein. The sites of the strongest broadenings are indicated. Inset shows correlation between relative cross-peak intensities (RNC versus protein) in buffer and in cell. Data are normalized according to αSyn concentration.
Fig. 6.
Fig. 6.
The ribosome surface acts as a molecular chaperone. Positively charged and aromatic residues within the NC interact with the highly negatively charged ribosome surface. Negatively charged regions create a repulsion with the ribosome surface and are highly dynamic. In some cases, negatively charged residues are seen to interact with the negatively charged ribosome surface via the Mg2+ ion shell surrounding the ribosome. The molecular chaperone, TF, also preferentially interacts with positively charged and aromatic residues within the NC. A handover from the ribosome surface to the molecular chaperone is likely to occur during NC elongation.

References

    1. Cassaignau A. M. E., Cabrita L. D., Christodoulou J., How does the ribosome fold the proteome? Annu. Rev. Biochem. 89, 389–415 (2020). - PubMed
    1. Voss N. R., Gerstein M., Steitz T. A., Moore P. B., The geometry of the ribosomal polypeptide exit tunnel. J. Mol. Biol. 360, 893–906 (2006). - PubMed
    1. Fedyukina D. V., Jennaro T. S., Cavagnero S., Charge segregation and low hydrophobicity are key features of ribosomal proteins from different organisms. J. Biol. Chem. 289, 6740–6750 (2014). - PMC - PubMed
    1. Deckert A., et al. , Structural characterization of the interaction of α-synuclein nascent chains with the ribosomal surface and trigger factor. Proc. Natl. Acad. Sci. U.S.A. 113, 5012–5017 (2016). - PMC - PubMed
    1. Ellis J. P., Bakke C. K., Kirchdoerfer R. N., Jungbauer L. M., Cavagnero S., Chain dynamics of nascent polypeptides emerging from the ribosome. ACS Chem. Biol. 3, 555–566 (2008). - PMC - PubMed

Publication types

MeSH terms

LinkOut - more resources