. 2021 Dec 20;13(1):20.
doi: 10.1038/s41419-021-04379-z.

NLPR3 inflammasome inhibition alleviates hypoxic endothelial cell death in vitro and protects blood-brain barrier integrity in murine stroke

Affiliations

NLPR3 inflammasome inhibition alleviates hypoxic endothelial cell death in vitro and protects blood-brain barrier integrity in murine stroke

Maximilian Bellut et al. Cell Death Dis. .

Abstract

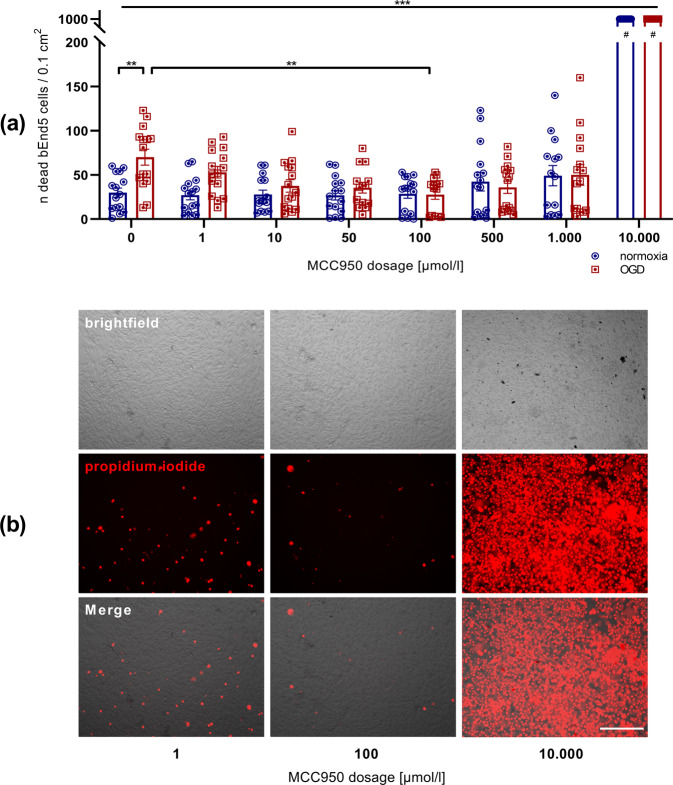
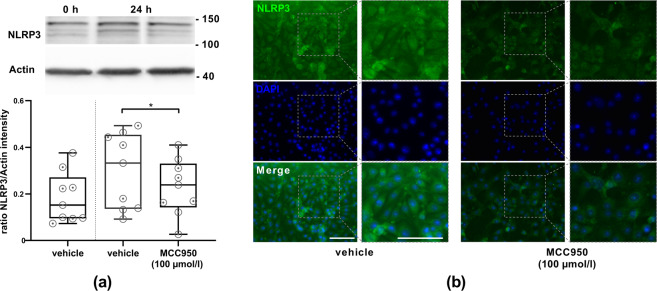
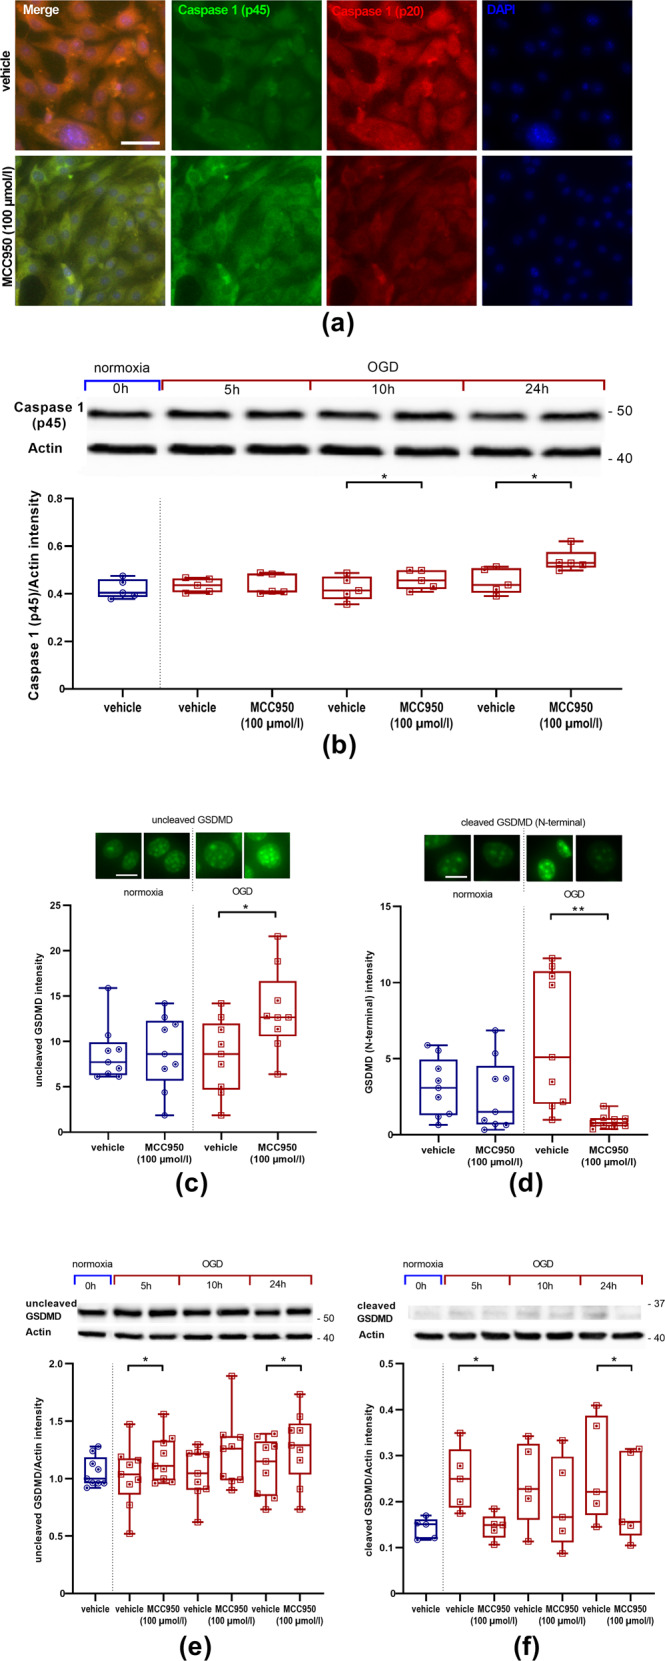
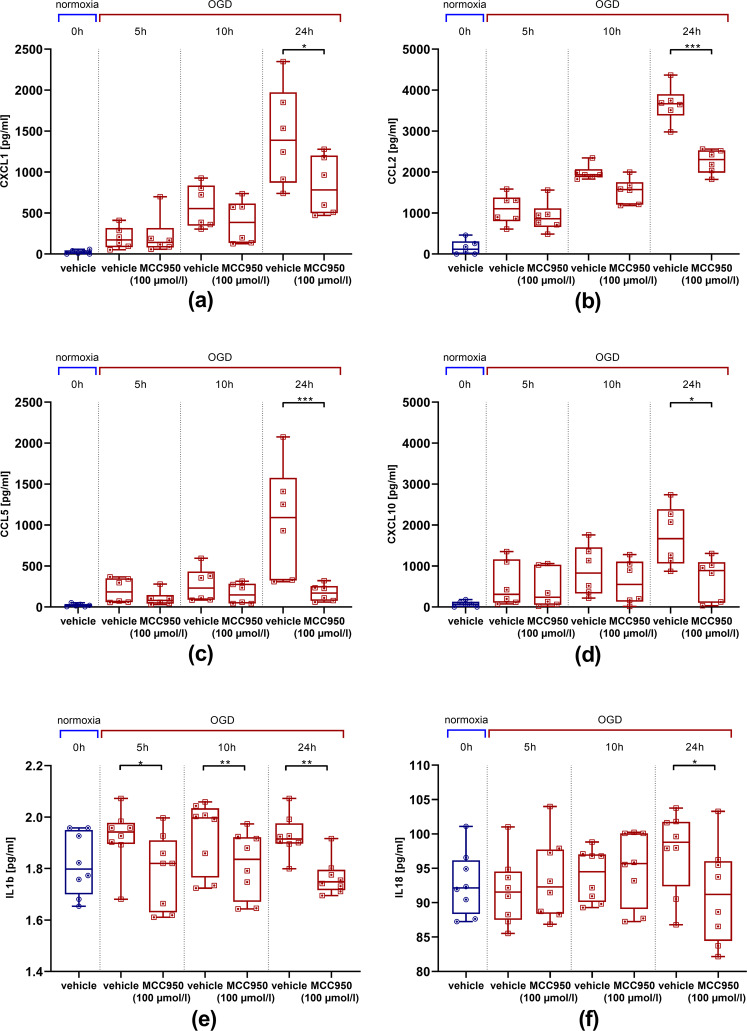
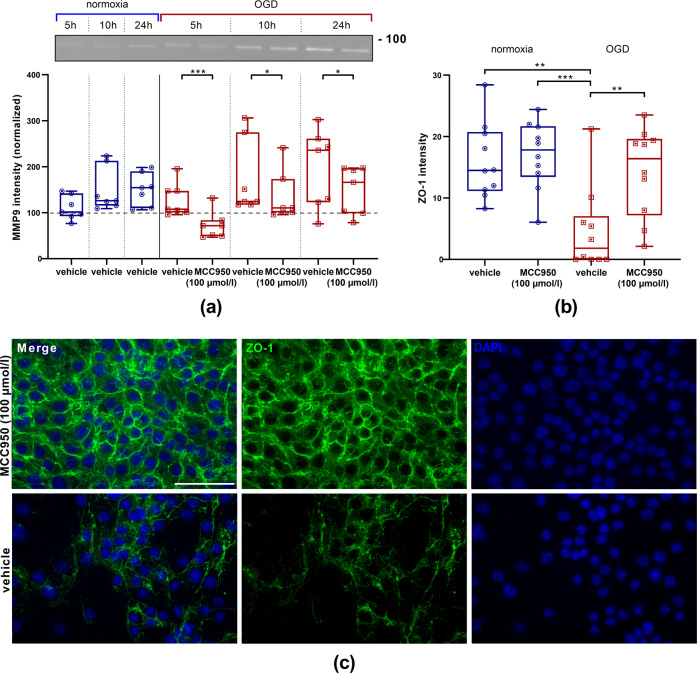
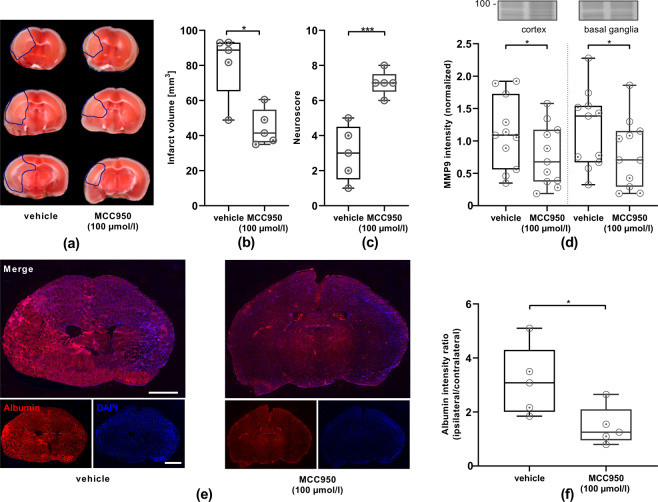
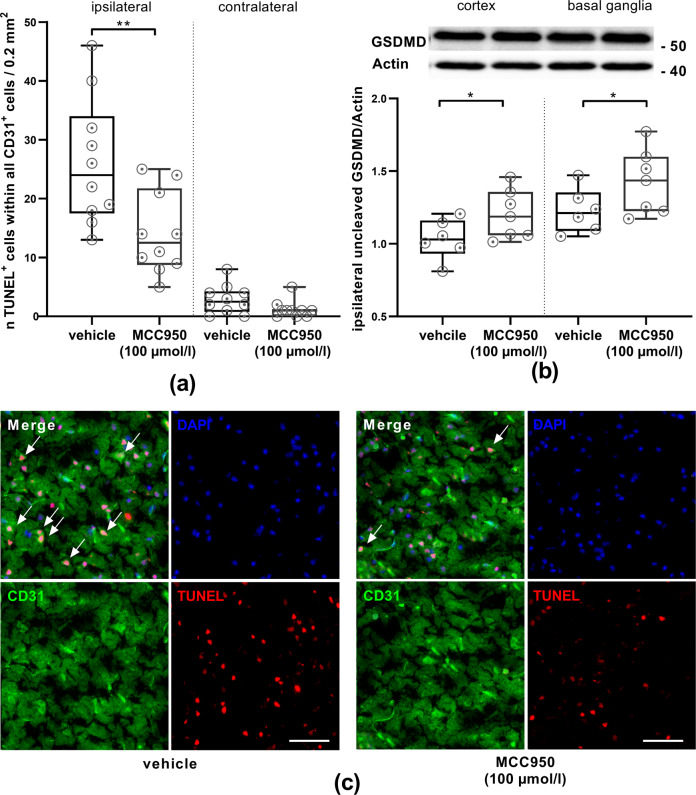
In ischemic stroke (IS) impairment of the blood-brain barrier (BBB) has an important role in the secondary deterioration of neurological function. BBB disruption is associated with ischemia-induced inflammation, brain edema formation, and hemorrhagic infarct transformation, but the underlying mechanisms are incompletely understood. Dysfunction of endothelial cells (EC) may play a central role in this process. Although neuronal NLR-family pyrin domain-containing protein 3 (NLRP3) inflammasome upregulation is an established trigger of inflammation in IS, the contribution of its expression in EC is unclear. We here used brain EC, exposed them to oxygen and glucose deprivation (OGD) in vitro, and analyzed their survival depending on inflammasome inhibition with the NLRP3-specific drug MCC950. During OGD, EC death could significantly be reduced when targeting NLRP3, concomitant with diminished endothelial NLRP3 expression. Furthermore, MCC950 led to reduced levels of Caspase 1 (p20) and activated Gasdermin D as markers for pyroptosis. Moreover, inflammasome inhibition reduced the secretion of pro-inflammatory chemokines, cytokines, and matrix metalloproteinase-9 (MMP9) in EC. In a translational approach, IS was induced in C57Bl/6 mice by 60 mins transient middle cerebral artery occlusion and 23 hours of reperfusion. Stroke volume, functional outcome, the BBB integrity, and-in good agreement with the in vitro results-MMP9 secretion as well as EC survival improved significantly in MCC950-treated mice. In conclusion, our results establish the NLRP3 inflammasome as a critical pathogenic effector of stroke-induced BBB disruption by activating inflammatory signaling cascades and pyroptosis in brain EC.


Conflict of interest statement

The authors declare no competing interests.

Figures

Fig. 1
Fig. 1. The comparison of bEnd5 after 24 h of either normoxia or OGD shows a significantly higher rate of cell death under OGD conditions. The MCC950 dilution series within the bEnd5 cell culture favors the 100 µmol/l MCC950 concentration with a significant reduction of cell death under OGD.
a Number of apoptotic bEnd5 cells per 0.1 cm2 after 24 h of either normoxia (blue) or OGD (3.0% O2, 5.0% CO2, 95% humidity, 37.0 °C, 1 g/l glucose, red) depending on the concentration of the initial MCC950 treatment in comparison to untreated control cells (n = 15 out of three independent experiments). #: counting stopped at 1000 dead cells/0.1 cm2. b Representative microscopic brightfield images of bEnd5 after 24 h OGD and immunofluorescent staining of the propidium iodide (red) uptake of these bEnd5 cells as cell death marker in selected MCC950 concentrations. In all, ×20 objective; scale bar = 25 µm. Data were analyzed by one-way ANOVA with Tukey post hoc test. **p < 0.01; ***p < 0.001.
Fig. 2
Fig. 2. bEnd5 express NLRP3 protein. The amount of NLRP3 protein is dependent upon OGD as well as MCC950 (100 µmol/l) treatment.
a Top: representative Western Blot depicting the amount of expressed NLRP3 (120 kDa) in bEnd5 lysates. To control protein loading β-actin was used (expected mass ~42 kDa). Bottom: ratio of NLRP3 protein band intensity to actin as loading control after 0 h and 24 h of OGD (3.0% O2, 5.0% CO2, 95% humidity, 37.0 °C, 1 g/l glucose) with vehicle or MCC950 (100 µmol/l) treatment (n = 9 out of three independent experiments). b Representative NLRP3 (green) and DAPI (blue) immunofluorescence stainings of bEnd5 after 24 h of OGD either with vehicle or with MCC950 (100 µmol/l) treatment. Adjacent ×2 magnification. In all, ×20 objective; scale bar = 25 µm. Data were analyzed by unpaired t test. *p < 0.05.
Fig. 3
Fig. 3. MCC950 (100 µmol/l) treatment reduces pyroptosis, indicated by lower levels of active Caspase 1 (p20), higher levels of pro-Caspase 1, elevated uncleaved GSDMD as well as reduced cytotoxic N-terminal GSDMD.
a Representative pro-Caspase 1 (p45) (green), active Caspase 1 (p20) (red), and DAPI (blue) immunofluorescence stainings of bEnd5 after 24 h OGD (3.0% O2, 5.0% CO2, 95% humidity, 37.0 °C, 1 g/l glucose, red) either with vehicle or with MCC950 treatment. In all, ×20 objective; scale bar = 25 µm. b Top: representative Western Blot depicting the amount of expressed pro-Caspase 1 (45 kDa) in bEnd5 lysates. To control protein loading β-actin was used (expected mass ~42 kDa). Bottom: ratio of pro-Caspase 1 (p45) protein band intensity to actin as loading control after 0 h, 5 h, 10 h, and 24 h of OGD with vehicle or MCC950 (100 µmol/l) treatment (n = 5 out of three independent experiments). c, d Top: representative immunofluorescence stainings of either uncleaved GSDMD or GSDMD (N-terminal) (green). Bottom: either uncleaved GSDMD or GSDMD (N-terminal) intensity of bEnd5 cell cultures after 24 h OGD with either vehicle or MCC950 (100 µmol/l) treatment (n = 9 out of four independent experiments). In all, ×40 objective; scale bar = 5 µm. e, f Top: representative Western Blot depicting the amount of expressed uncleaved (52 kDa) or cleaved (N-terminal) (32 kDa) GSDMD in bEnd5 lysates. To control protein loading β-actin was used (expected mass ~42 kDa). Bottom: ratio of either uncleaved GSDMD or cleaved (N-terminal) GSDMD protein band intensity to actin as loading control after 0 h, 5 h, 10 h, and 24 h of OGD with vehicle or MCC950 (100 µmol/l) treatment (n = 9 or five out of three independent experiments). Data were analyzed by paired t test. *p < 0.05; **p < 0.01.
Fig. 4
Fig. 4. bEnd5 express less pro-inflammatory chemokines and cytokines after MCC950 (100 µmol/l) treatment.
ad Cytometric bead array to detect endothelial chemokine release depending on OGD (3.0% O2, 5.0% CO2, 95% humidity, 37.0 °C, 1 g/l glucose, red) duration and treatment regime. a CXCL1 protein concentration (n = 6 out of three independent experiments), b CCL2 (MCP-1) protein concentration (n = 6 out of three independent experiments), c CCL5 (RANTES) protein concentration (n = 6 out of three independent experiments) and d CXCL10 (IP10) protein concentration (n = 6 out of three independent experiments) at baseline under normoxic conditions as well as after 5 h, 10 h, and 24 h of OGD with vehicle or MCC950 treatment. ef ELISA to measure endothelial cytokine release depending on OGD duration and treatment regime. e IL1b protein concentration (n = 8 out of four independent experiments), f IL18 protein concentration (n = 8 out of four independent experiments). Data were analyzed by unpaired t test. *p < 0.05; **p < 0.01; ***p < 0.001.
Fig. 5
Fig. 5. MMP9 reduction and ZO-1 enhancement after MCC950 (100 µmol/l) treatment.
a Top: representative zymography with Coomassie staining depicting the amounts of secreted MMP9 (92 kDa) in bEnd5 supernatants after 5 h, 10 h, or 24 h of normoxia (blue) or OGD (3.0% O2, 5.0% CO2, 95% humidity, 37.0 °C, 1 g/l glucose, red) either with vehicle or MCC950 (100 µmol/l) treatment. Bottom: the intensity of MMP9 within the bEnd5 supernatants were normalized to the intensity of the probes at 0 h under normoxic conditions (dashed line, n = 7 out of three independent experiments). Data were analyzed by unpaired t test. *p < 0.05. ***p < 0.001. b Intensities of ZO-1 immunohistochemical stainings of bEnd5 under normoxia or OGD with either vehicle or MCC950 (100 µmol/l) treatment. Data were analyzed by one-way ANOVA with Tukey post hoc test. **p < 0.01; ***p < 0.001. c Representative ZO-1 (green) and DAPI (blue) immunofluorescence stainings of bEnd5 after 24 h of OGD either with vehicle or with MCC950 (100 µmol/l) treatment. ×20 objective; scale bar = 50 µm.
Fig. 6
Fig. 6. Treatment with the inflammasome-inhibitor MCC950 (100 µmol/l) reduces stroke severity, improves neurological outcome, reduces MMP9 levels, and lessens BBB disruption.
a Representative 2,3,5-triphenyltetrazolium chloride staining of three consecutive coronal brain sections of vehicle- and MCC950 (100 µmol/l) treated mice euthanized 24 h after tMCAO. The infarcts (circled by blue line) are smaller in the MCC950 (100 µmol/l)-treated mice, which could be confirmed by b infarct volumetry (n = 5). c Neurologic scores were performed 1 d after tMCAO (n = 5). d Top: representative zymography with Coomassie staining depicting the amounts of secreted MMP9 (92 kDa) in ipsilesional cortical or basal ganglial brain lysates 1 d after tMCAO with and without NLRP3 inhibition (MCC950 100 µmol/l). Bottom: densitometric quantification of MMP9 within the brain lysates with normalization to the intensity of the total protein of the respective probe as displayed by the Coomassie staining (n = 11). e Representative immunohistological staining of albumin (red) and nuclei (DAPI, blue) of coronal brain slices 1 d after tMCAO in a vehicle (left) and MCC950 (100 µmol/l) treated mouse (right) using ×5 objective. scale bar = 2 mm. f Ratio of ipsilesional to contralesional albumin intensity of coronary brain slices 1 d after tMCAO in vehicle and MCC950 (100 µmol/l) treated mice (n = 5). Data were analyzed by unpaired t test. *p < 0.05; ***p < 0.001.
Fig. 7
Fig. 7. MCC950 (100 µmol/l) treatment reduces cell death within the vascular compartment after IS. Uncleaved GSDMD levels indicate reduced pyroptosis after inflammasome inhibition.
a The number of CD31- and TUNEL-positive cells within all CD31-positive cells (ipsilateral or contralateral) of vehicle or MCC950 (100 µmol/l) treated animals on day 1 after tMCAO (n = 10, two per animal). b Uncleaved GSDMD (52 kDa) protein content in the cortex or basal ganglia of vehicle or MCC950 (100 µmol/l) treated mice. For densitometric quantification actin was used as a loading control (expected mass ~42 kDa) (n = 7). c Representative brain sections from vehicle (left) or MCC950 (100 µmol/l) (right) treated mice 24 h after tMCAO immunolabeled for the marker CD31 (green), TUNEL (red) to depict apoptosis and DAPI (blue) for nuclei. White arrows highlight triple-positive cells. In all, ×20 objective, scale bar = 100 µm. Data were analyzed by unpaired t test. *p < 0.05; **p < 0.01.

References

    1. del Zoppo GJ, Saver JL, Jauch EC, Adams HP. Expansion of the time window for treatment of acute ischemic stroke with intravenous tissue plasminogen activator: a science advisory from the american heart association/american stroke association. Stroke. 2009;40:2945–8. doi: 10.1161/STROKEAHA.109.192535. - DOI - PMC - PubMed
    1. Wang X. Mechanisms of hemorrhagic transformation after tissue plasminogen activator reperfusion therapy for ischemic stroke. Stroke. 2004;35:2726–30. doi: 10.1161/01.STR.0000143219.16695.af. - DOI - PubMed
    1. Kelly MA, Shuaib A, Todd KG. Matrix metalloproteinase activation and blood–brain barrier breakdown following thrombolysis. Exp Neurol. 2006;200:38–49. doi: 10.1016/j.expneurol.2006.01.032. - DOI - PubMed
    1. Kassner A, Merali Z. Assessment of blood–brain barrier disruption in stroke. Stroke. 2015;46:3310–5. doi: 10.1161/STROKEAHA.115.008861. - DOI - PubMed
    1. Yang Y, Rosenberg GA. Blood–brain barrier breakdown in acute and chronic cerebrovascular disease. Stroke. 2011;42:3323–8. doi: 10.1161/STROKEAHA.110.608257. - DOI - PMC - PubMed

Publication types

MeSH terms