

Three topological features of regulatory networks control life-essential and specialized subsystems
- PMID: 34930908
- PMCID: PMC8688434
- DOI: 10.1038/s41598-021-03625-w
Three topological features of regulatory networks control life-essential and specialized subsystems
Abstract
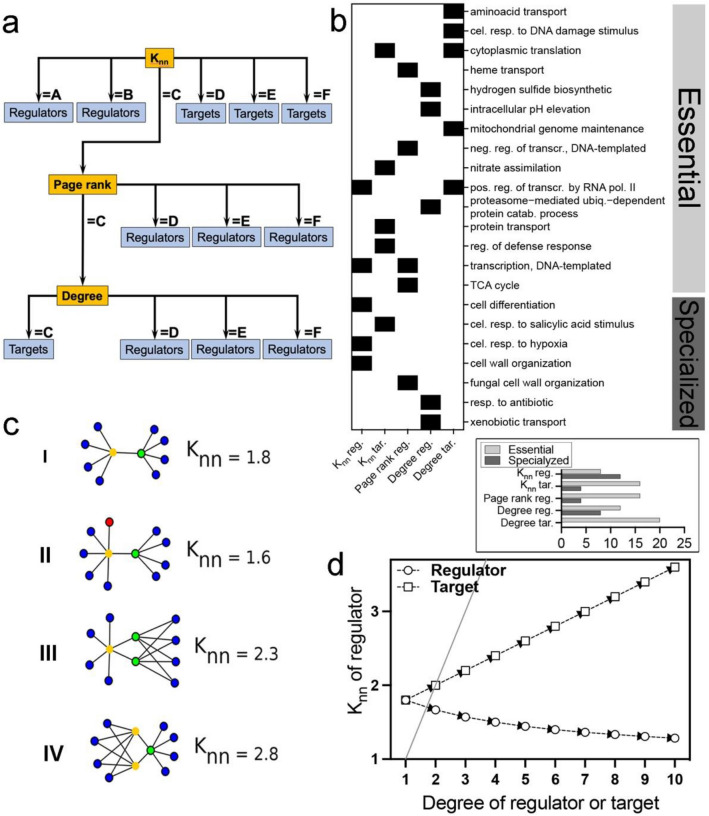
Gene regulatory networks (GRNs) play key roles in development, phenotype plasticity, and evolution. Although graph theory has been used to explore GRNs, associations amongst topological features, transcription factors (TFs), and systems essentiality are poorly understood. Here we sought the relationship amongst the main GRN topological features that influence the control of essential and specific subsystems. We found that the Knn, page rank, and degree are the most relevant GRN features: the ones are conserved along the evolution and are also relevant in pluripotent cells. Interestingly, life-essential subsystems are governed mainly by TFs with intermediary Knn and high page rank or degree, whereas specialized subsystems are mainly regulated by TFs with low Knn. Hence, we suggest that the high probability of TFs be toured by a random signal, and the high probability of the signal propagation to target genes ensures the life-essential subsystems' robustness. Gene/genome duplication is the main evolutionary process to rise Knn as the most relevant feature. Herein, we shed light on unexplored topological GRN features to assess how they are related to subsystems and how the duplications shaped the regulatory systems along the evolution. The classification model generated can be found here: https://github.com/ivanrwolf/NoC/ .
© 2021. The Author(s).
Conflict of interest statement
The authors declare no competing interests.
Figures

Similar articles
-
Systematic Discovery of Archaeal Transcription Factor Functions in Regulatory Networks through Quantitative Phenotyping Analysis.mSystems. 2017 Sep 19;2(5):e00032-17. doi: 10.1128/mSystems.00032-17. eCollection 2017 Sep-Oct. mSystems. 2017. PMID: 28951888 Free PMC article.
-
Lineage-specific transcription factors and the evolution of gene regulatory networks.Brief Funct Genomics. 2010 Jan;9(1):65-78. doi: 10.1093/bfgp/elp056. Epub 2010 Jan 16. Brief Funct Genomics. 2010. PMID: 20081217 Free PMC article. Review.
-
Network component analysis provides quantitative insights on an Arabidopsis transcription factor-gene regulatory network.BMC Syst Biol. 2013 Nov 14;7:126. doi: 10.1186/1752-0509-7-126. BMC Syst Biol. 2013. PMID: 24228871 Free PMC article.
-
Transcription Factors in the Fungus Aspergillus nidulans: Markers of Genetic Innovation, Network Rewiring and Conflict between Genomics and Transcriptomics.J Fungi (Basel). 2021 Jul 25;7(8):600. doi: 10.3390/jof7080600. J Fungi (Basel). 2021. PMID: 34436139 Free PMC article.
-
Gene regulatory evolution and the origin of macroevolutionary novelties: insights from the neural crest.Genesis. 2013 Jul;51(7):457-70. doi: 10.1002/dvg.22403. Epub 2013 Jun 25. Genesis. 2013. PMID: 23712931 Free PMC article. Review.
Cited by
-
An updated gene regulatory network reconstruction of multidrug-resistant Pseudomonas aeruginosa CCBH4851.Mem Inst Oswaldo Cruz. 2022 Oct 14;117:e220111. doi: 10.1590/0074-02760220111. eCollection 2022. Mem Inst Oswaldo Cruz. 2022. PMID: 36259790 Free PMC article.
-
Boolean modelling as a logic-based dynamic approach in systems medicine.Comput Struct Biotechnol J. 2022 Jun 17;20:3161-3172. doi: 10.1016/j.csbj.2022.06.035. eCollection 2022. Comput Struct Biotechnol J. 2022. PMID: 35782730 Free PMC article. Review.
-
Operating principles of interconnected feedback loops driving cell fate transitions.NPJ Syst Biol Appl. 2025 Jan 2;11(1):2. doi: 10.1038/s41540-024-00483-w. NPJ Syst Biol Appl. 2025. PMID: 39743534 Free PMC article.
-
Assessing the impact of sampling bias on node centralities in synthetic and biological networks.NPJ Syst Biol Appl. 2025 May 15;11(1):47. doi: 10.1038/s41540-025-00526-w. NPJ Syst Biol Appl. 2025. PMID: 40374666 Free PMC article.
-
'Intelligent' proteins.Cell Mol Life Sci. 2025 Jun 14;82(1):239. doi: 10.1007/s00018-025-05770-1. Cell Mol Life Sci. 2025. PMID: 40515853 Free PMC article. Review.
References
-
- Barabási AL, Oltvai ZN. Network biology: Understanding the cell’s functional organization. Nat. Rev. Genet. 2004;5:101–113. - PubMed
-
- Barclay SS, et al. Systems biology analysis of drosophila in vivo screen data elucidates core networks for DNA damage repair in SCA1. Hum. Mol. Genet. 2014;23:1345–1364. - PubMed
-
- Huang S, Eichler G, Bar-Yam Y, Ingber DE. Cell fates as high-dimensional attractor states of a complex gene regulatory network. Phys. Rev. Lett. 2005;94:128701. - PubMed
Publication types
LinkOut - more resources
Full Text Sources
Miscellaneous
