. 2021 Dec 20;4(1):171.
doi: 10.1038/s41746-021-00540-2.

Smartphone-based digital phenotyping for dry eye toward P4 medicine: a crowdsourced cross-sectional study

Affiliations

Smartphone-based digital phenotyping for dry eye toward P4 medicine: a crowdsourced cross-sectional study

Takenori Inomata et al. NPJ Digit Med. .

Abstract

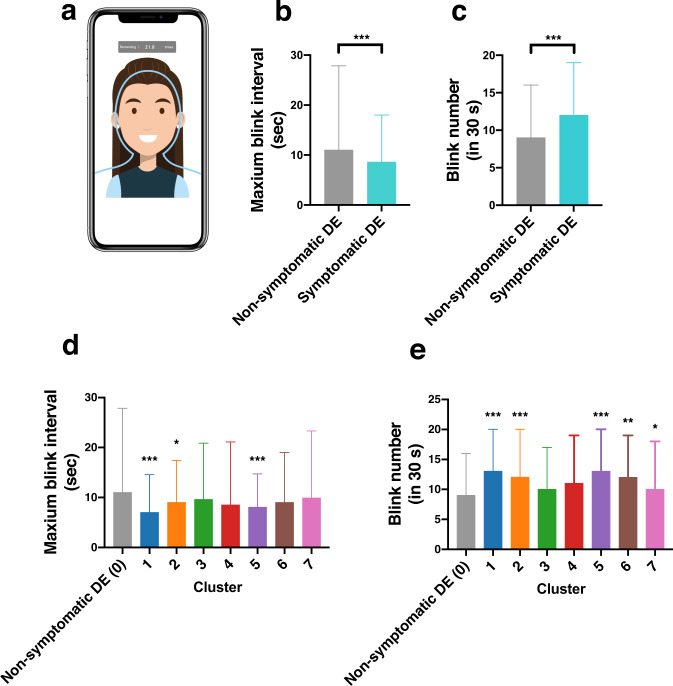
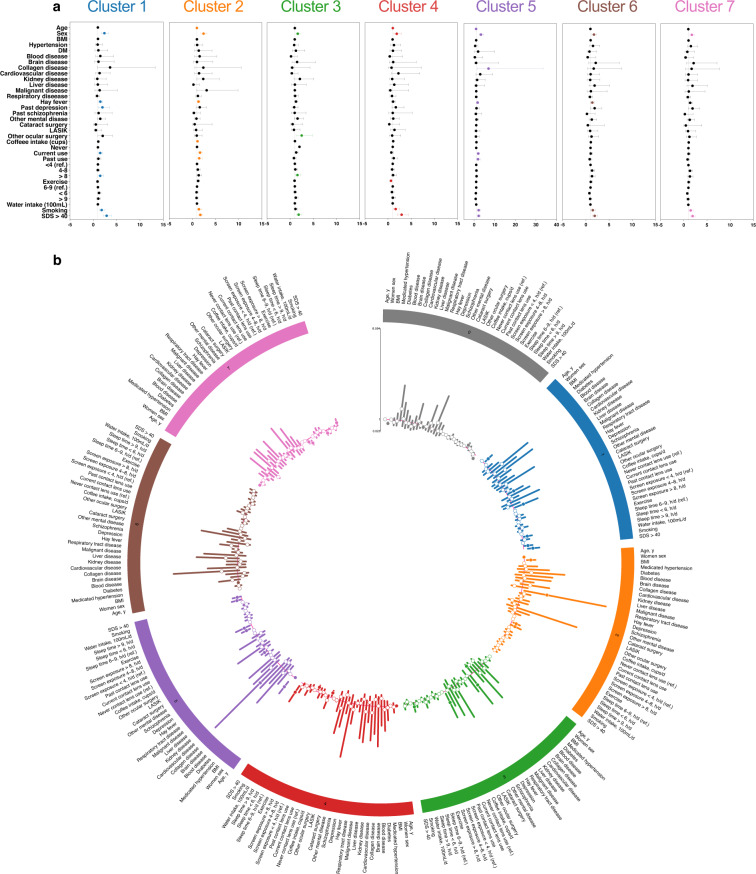
Multidimensional integrative data analysis of digital phenotyping is crucial for elucidating the pathologies of multifactorial and heterogeneous diseases, such as the dry eye (DE). This crowdsourced cross-sectional study explored a novel smartphone-based digital phenotyping strategy to stratify and visualize the heterogenous DE symptoms into distinct subgroups. Multidimensional integrative data were collected from 3,593 participants between November 2016 and September 2019. Dimension reduction via Uniform Manifold Approximation and Projection stratified the collected data into seven clusters of symptomatic DE. Symptom profiles and risk factors in each cluster were identified by hierarchical heatmaps and multivariate logistic regressions. Stratified DE subgroups were visualized by chord diagrams, co-occurrence networks, and Circos plot analyses to improve interpretability. Maximum blink interval was reduced in clusters 1, 2, and 5 compared to non-symptomatic DE. Clusters 1 and 5 had severe DE symptoms. A data-driven multidimensional analysis with digital phenotyping may establish predictive, preventive, personalized, and participatory medicine.


Conflict of interest statement

The DryEyeRhythm app was created using Apple’s ResearchKit (Cupertino, CA, USA) along with OHAKO, Inc. (Tokyo, Japan) and Medical Logue, Inc. (Tokyo, Japan). Y.O. and T.I. are the owners of InnoJin, Inc., Tokyo, Japan for developing DryEyeRhytm. T.I. reported receiving grants from Johnson & Johnson Vision Care, SEED Co., Ltd, Novartis Pharma K.K., and Kowa Company, Ltd. outside the submitted work, as well as personal fees from Santen Pharmaceutical Co., Ltd., and InnoJin, Inc. A.M. reported receiving grants from Johnson & Johnson Vision Care and Santen Pharmaceutical Co., Ltd. The remaining authors declare no competing interests.

Figures

Fig. 1
Fig. 1. Screenshot and the description of user experience of DryEyeRhythm.
(a) Screenshots of DryEyeRhythm (b) Description of the user experience of DryEyeRhythm. The copyright permission of the logo was obtained from Juntendo University, Tokyo, Japan.
Fig. 2
Fig. 2. Study cohort description.
Specific key performance indicators for DryEyeRhythm are shown in (a) impression times, (b) download times, and (c) session times. (d) Enrollment process of this study. (e) Geographic distribution of included participants (n = 3,593).
Fig. 3
Fig. 3. Stratification of subjective symptoms of DE.
Heterogeneous and diverse subjective symptoms of DE were stratified using the 12 items of the J-OSDI. (a) An overview of the stratification process of heterogeneous and diverse subjective symptoms of DE using DryEyeRhythm. (b) Among symptomatic DE individuals, normalized maximum eigengap values were used to estimate the number of clusters during spectral clustering. Seven clusters were determined by eigengaps of the normalized affinity matrix. (c) Dimension reduction of individuals with symptomatic DE—via UMAP with spectral clustering identified by unsupervised clustering analysis (n = 2619 individuals collected by DryEyeRhythm)—depicted seven clusters when stratified for subjective symptoms based on the 12 items of the J-OSDI. (d) UMAP plots depicting subjective symptom severity of DE based on three subcategories of the J-OSDI. (e) Fraction of individuals within each cluster visualized on the left most panel, along with a corresponding heat map of subjective symptoms from individuals within the identified clusters. (f) Violin plots of total J-OSDI scores and each subscale, including ocular symptoms, vision-related function, and environmental triggers per cluster. Abbreviations: DE dry eye, J-OSDI Japanese version of Ocular Surface Disease Index, UMAP Uniform Manifold Approximation and Projection.
Fig. 4
Fig. 4. Chord diagram and co-occurrence network analysis.
Chord diagrams visualizing the quantified interrelationships between each pair of stratified clusters, and the 12 items of the J-OSDI were placed around a circle. (a) Chord diagrams showing the J-OSDI-to-cluster interrelations for J-OSDI items with a score higher than 1 (left), 2 (middle left), 3 (middle right), and 4 (right). (b) The interrelationships of the stratified clusters and the 12 items of the J-OSDI are displayed separately for each cluster. (c) Co-occurrence network analysis displaying significant connection relationships between each of the 12 J-OSDI questions within each cluster. Co-occurrence network analyses were performed with wTO measure, which enables normalization of all shared correlations between a pair of parameters. In the co-occurrence network analysis representations, nodes (the 12 items of the J-OSDI) are represented as circles, and links between the nodes (inter-item correlations) are represented as lines. The size of each node is proportional to the frequency of a DE symptom that corresponds to a J-OSDI item. The width of the lines reflects the strength of the pairwise correlations on the 12 J-OSDI domains. To enable the comparison of edge strength across networks, a thicker edge identified across all networks implied a stronger association. Purple edges represent positive interconnections, whereas green edges represent negative interconnections. Abbreviations: J-OSDI Japanese version of Ocular Surface Disease Index, wTO weighted topological overlap, DE dry eye.
Fig. 5
Fig. 5. Characteristics of identified clusters.
(a) The duration of the participants’ MBI and 30-s blinking frequency were recorded by DryEyeRhythm. (b) MBI in each cluster (Kruskal-Wallis test, n = 3593, *P = 0.016. ***P < 0.001). (c) Blink frequency (blink number) in each cluster (Kruskal-Wallis test, n = 3593, *P = 0.027. **P = 0.005, ***P < 0.001). Abbreviation: MBI maximum blink interval, DE dry eye.
Fig. 6
Fig. 6. Risk stratification in each cluster.
(a) Risk factors for each cluster in symptomatic DE compared with non-symptomatic DE. (b) Risk factors for each cluster in symptomatic DE compared with other clusters visualized in a circular layout. Abbreviation: DE dry eye.

References

    1. Craig JP, et al. TFOS DEWS II Definition and Classification Report. Ocul. Surf. 2017;15:276–283. - PubMed
    1. Tsubota K, et al. New Perspectives on Dry Eye Definition and Diagnosis: A Consensus Report by the Asia Dry Eye Society. Ocul. Surf. 2017;15:65–76. - PubMed
    1. Kaido M, Ishida R, Dogru M, Tsubota K. The relation of functional visual acuity measurement methodology to tear functions and ocular surface status. Jpn J. Ophthalmol. 2011;55:451–459. - PubMed
    1. Belmonte C, et al. TFOS DEWS II pain and sensation report. Ocul. Surf. 2017;15:404–437. - PMC - PubMed
    1. Yamada M, Mizuno Y, Shigeyasu C. Impact of dry eye on work productivity. Clinicoecon Outcomes Res. 2012;4:307–312. - PMC - PubMed