. 2022 Feb;14(2):196-207.
doi: 10.1038/s41557-021-00840-w. Epub 2021 Dec 20.

Deciphering how naturally occurring sequence features impact the phase behaviours of disordered prion-like domains

Affiliations

Deciphering how naturally occurring sequence features impact the phase behaviours of disordered prion-like domains

Anne Bremer et al. Nat Chem. 2022 Feb.

Abstract

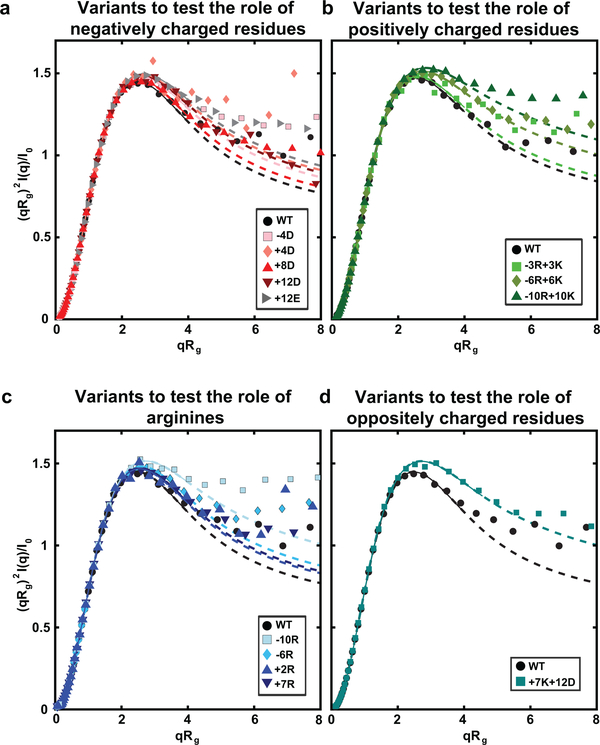
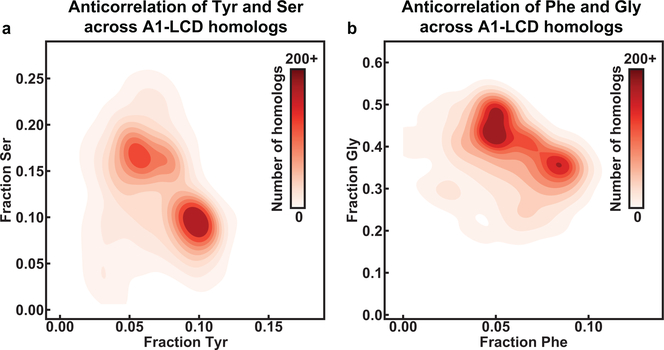
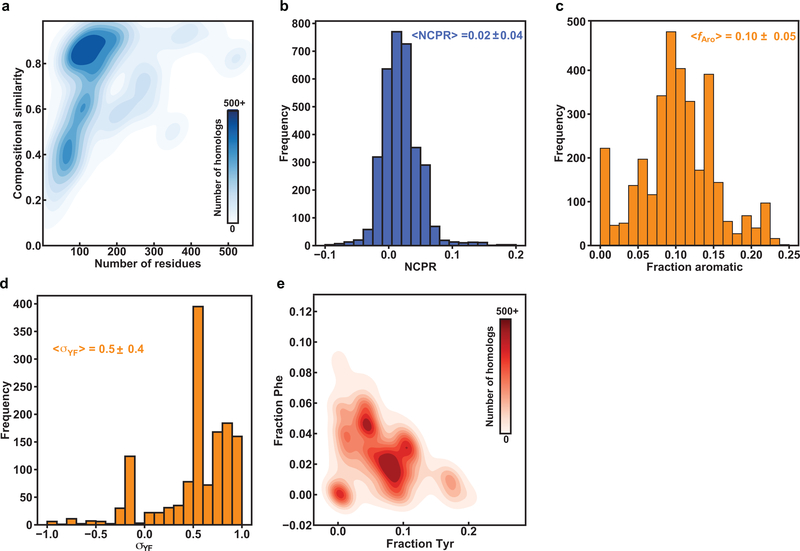
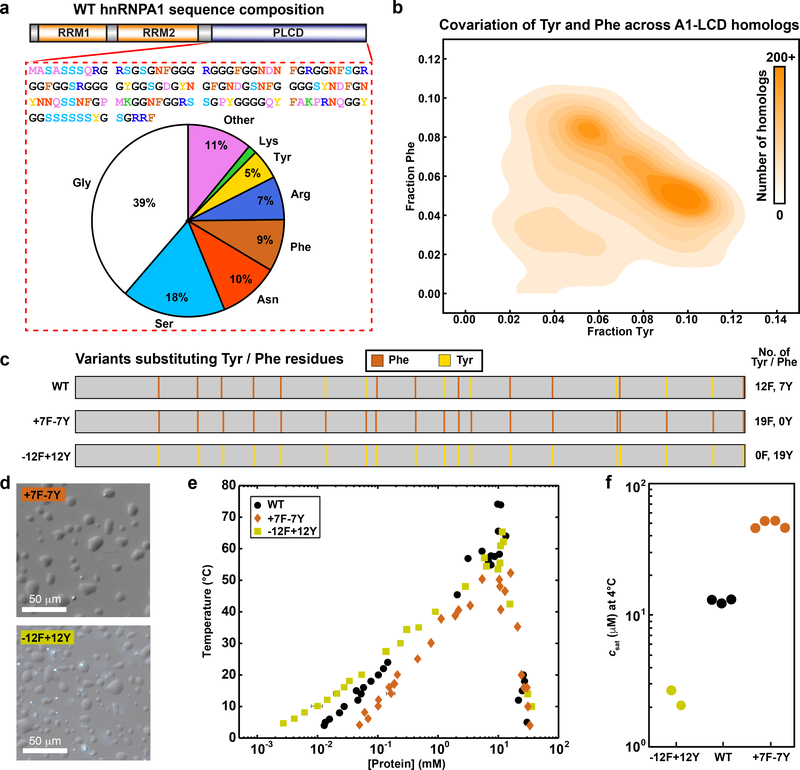
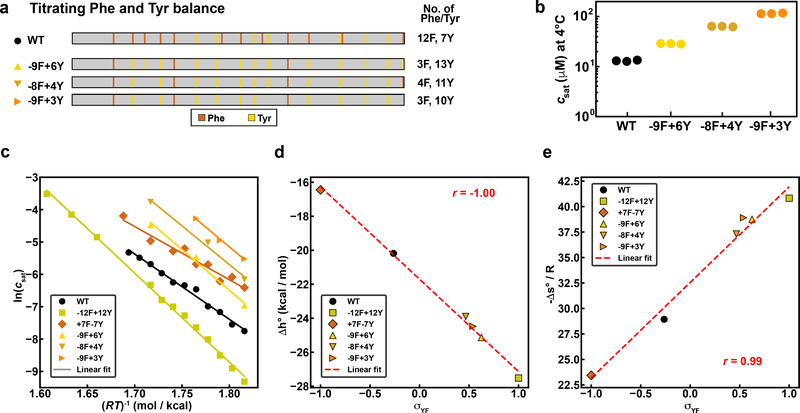
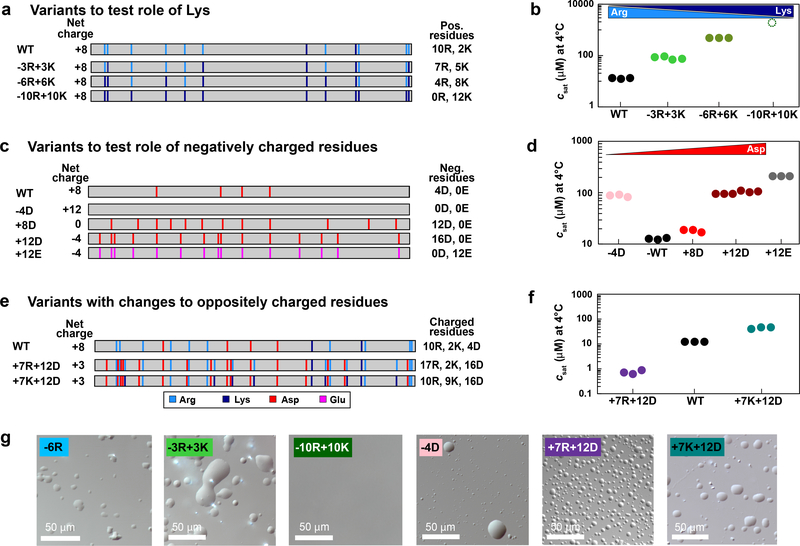
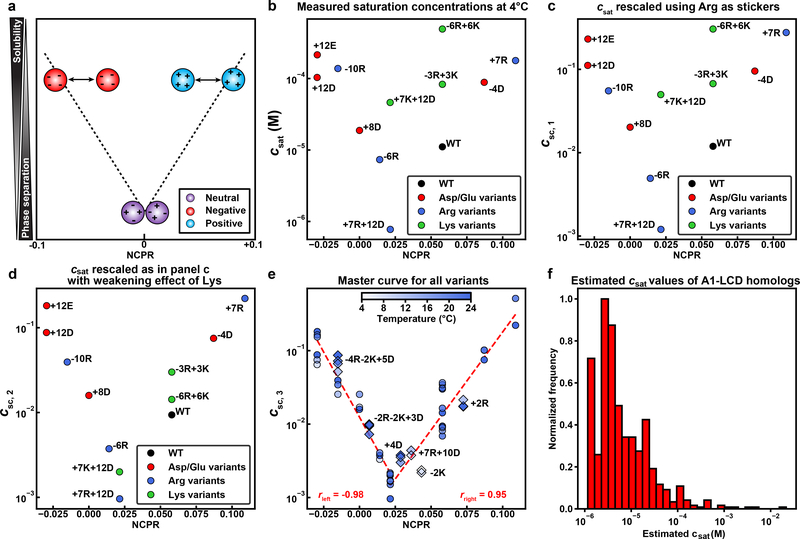
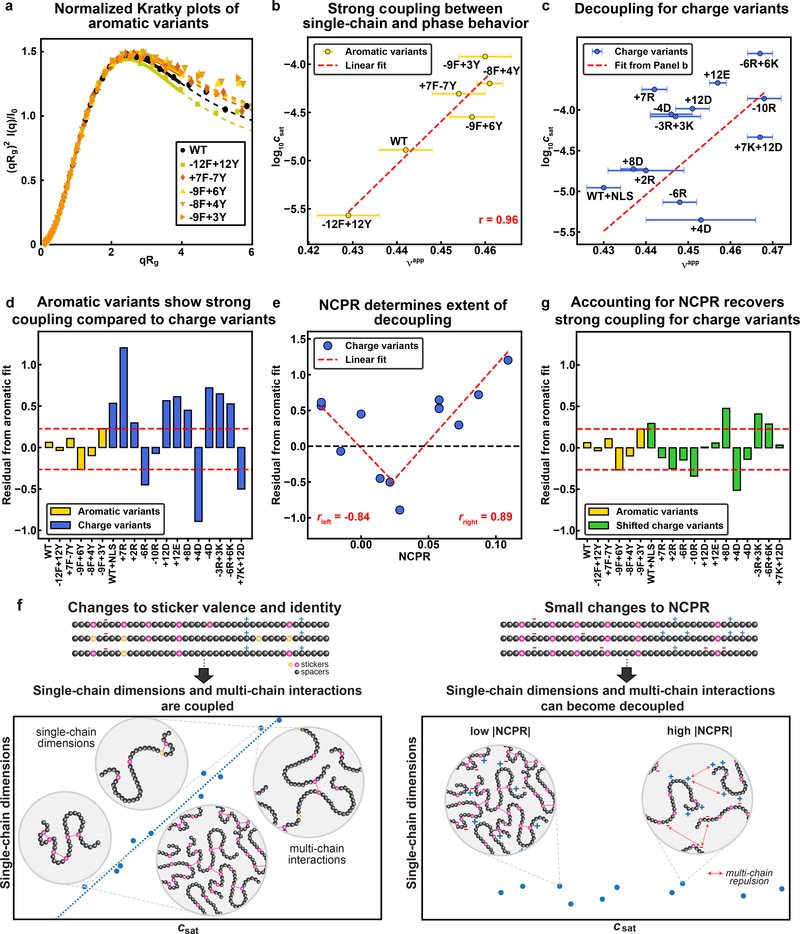
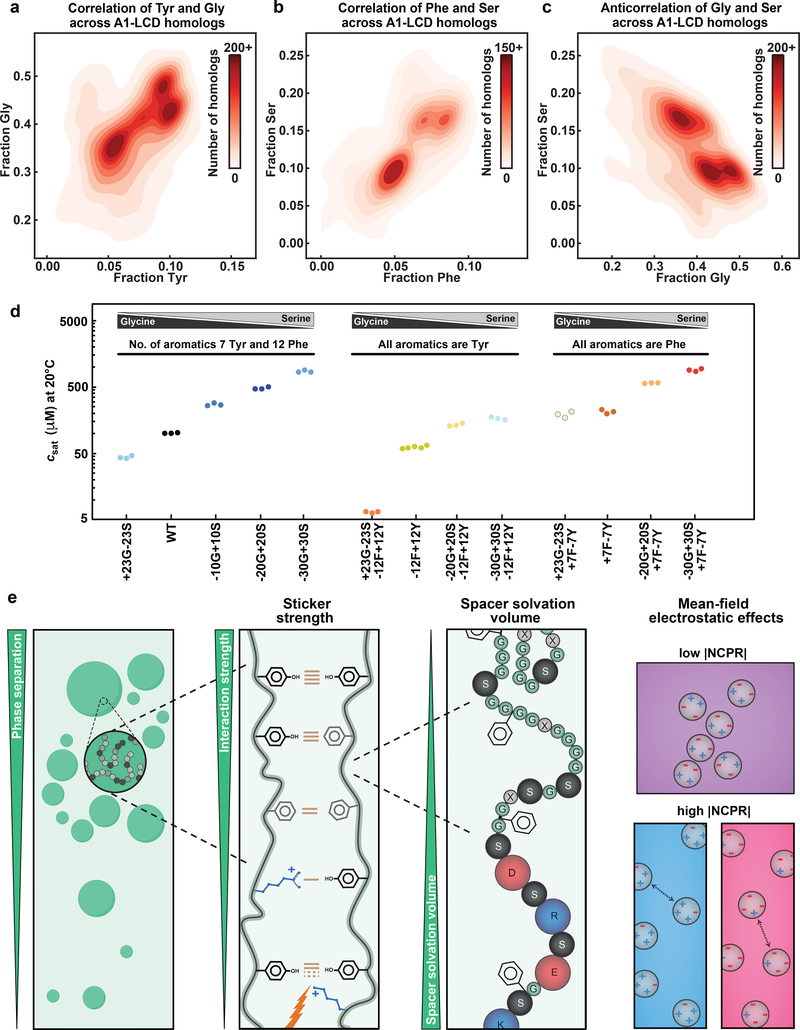
Prion-like low-complexity domains (PLCDs) have distinctive sequence grammars that determine their driving forces for phase separation. Here we uncover the physicochemical underpinnings of how evolutionarily conserved compositional biases influence the phase behaviour of PLCDs. We interpret our results in the context of the stickers-and-spacers model for the phase separation of associative polymers. We find that tyrosine is a stronger sticker than phenylalanine, whereas arginine is a context-dependent auxiliary sticker. In contrast, lysine weakens sticker-sticker interactions. Increasing the net charge per residue destabilizes phase separation while also weakening the strong coupling between single-chain contraction in dilute phases and multichain interactions that give rise to phase separation. Finally, glycine and serine residues act as non-equivalent spacers, and thus make the glycine versus serine contents an important determinant of the driving forces for phase separation. The totality of our results leads to a set of rules that enable comparative estimates of composition-specific driving forces for PLCD phase separation.


Conflict of interest statement

Competing Interests Statement

R.V.P is a member of the scientific advisory board of Dewpoint Therapeutics Inc and T.M. is a consultant of Faze Medicines, Inc. The work reported here has not been influenced by either of these affiliations. All other authors declare no competing interests.

Figures

Extended Data Figure 1:
Extended Data Figure 1:. Compositional analysis of PLCDs from homologs of hnRNPA1.
(a) 2D histogram quantifying the joint distribution of lengths of PLCDs derived from homologs of hnRNPA1 and the compositional similarities, in terms of cosine values, to A1-LCD. (b) Distribution of fractions of aromatic residues (Tyr, Phe, and Trp). (c) Distributions of fractions of Glu and Asp residues. Numerical values are mean values of the respective distribution ± the standard deviations.
Extended Data Figure 2:
Extended Data Figure 2:. 1H,15N HSQC spectrum of the A1-LCD variant +7K+12D.
The plot on the right is an expansion of a crowded area of the spectrum (indicated by a box on the left). Spectra were collected in homogenous samples in the absence of phase separation. The lack of chemical shift dispersion indicates that the protein remains primarily disordered. Despite the significant overlap, 80% of the amide chemical shifts were assigned to their respective amino acid residues (i.e., 110 of the 135 non-proline residues).
Extended Data Figure 3:
Extended Data Figure 3:. Aromatic residues are the main stickers in A1-LCD variant +7K+12D.
Panel on the left shows an overlay of 1H,15N HSQC spectra of WT A1-LCD Δhexa variant (missing residues 259–264, red) as reported in (Martin et al. ) and of A1-LCD variant +7K+12D (blue). The amino acid substitutions result in large-scale changes in resonance frequencies across the spectrum compared to the A1-LCD Δhexa. This may be expected due to the high number of charged amino acid substitutions and their widespread distribution. The panel on the right shows 15N R2 relaxation profiles for WT A1-LCD Δhexa (top) and the +7K+12D variant (bottom). The R2 relaxation rates are sensitive to differences in local dynamics due to intramolecular interactions. The solid black profile represents a pure Gaussian fit, whereas the black dashed fit represents multiple regions of enhanced relaxation centered at aromatic residues (yellow) with the blue line representing the underlying Gaussian profile from this fit with a persistence length of 7.8 amino acid residues. R2 rates for +7K+12D show clusters of enhanced rates in similar sequence positions as the WT, with an additional cluster found in the hexapeptide region that is deleted in the WT and where two aromatic residues are located. This is consistent with the aromatic residues remaining stickers. These data support our prediction that Lys and Asp residues do not act as stickers. Instead, they modulate the driving forces for phase separation through a combination of increased effective solvation volume, electrostatic repulsions, and weakening attractive interactions among primary and auxiliary stickers.
Extended Data Figure 4:
Extended Data Figure 4:. Measured pH-dependence of csat validates the prediction that the minimum value for csat is realized at positive values of NCPR.
(a) Saturation concentration of A1-LCD +7K+12D was measured at 4°C as a function of pH. Individual data points are shown as black crosses, the mean as green symbols, vertical lines represent the standard deviation. (b) Table summarizing the theoretical net charge of A1-LCD +7K+12D and the number of Lys residues that are calculated to be protonated at each pH. (c) Measured csat values for +7K+12D were rescaled using the equation for csc,2. Here, we compare the csc,2 values when we account for all nine Lys residues (red diamonds) or only the number of protonated Lys residues (green diamonds). The latter conform to the master curve, whereas the former deviate significantly from the master curve.
Extended Data Figure 5:
Extended Data Figure 5:. Kratky plot of the raw SEC-SAXS of A1-LCD variants.
Data are shown for variants testing the roles of (a) negatively charged residues, (b) positively charged residues, (c) arginines, and (d) oppositely charged residues. Data were logarithmically smoothed into 40 bins. Solid lines are fits to system-specific empirical molecular form factors (MFF).
Extended Data Figure 6:
Extended Data Figure 6:. Compositional analysis of aromatic stickers and Gly/Ser spacers.
(a) 2D histogram quantifying the joint distribution of the fractions of Tyr and Ser across PLCDs from 770 homologs of hnRNPA1. (b) 2D histogram quantifying the joint distribution of the fractions of Phe and Ser across PLCDs from 770 homologs of hnRNPA1. The solution conditions for all experiments were 20 mM HEPES, 150 mM NaCl, pH 7.0.
Extended Data Figure 7:
Extended Data Figure 7:. Examining the effects of other spacer residues on A1-LCD phase behavior.
(a) Diagram of variants to understand the contributions of Asn, Gln and Thr to effective solvation volumes of A1-LCD. In variant −14N-4Q+18G, the role of Asn and Gln residues in comparison to Gly spacers is assessed. In variants −14N+14Q and −23S+23T, residues with similar intrinsic free energies of solvation but different steric bulk are substituted. Vertical bars in the schematics indicate the position of residue types, namely Asn (red), Gln (yellow), Gly (green), Ser (black) and Thr (purple). (b) Measured binodals of A1-LCD variants from (a) as a function of temperature. (c) A focused view on the dilute arms (saturation concentrations) of the binodals in (b). The solution conditions for all experiments were 20 mM HEPES, 150 mM NaCl, pH 7.0.
Extended Data Figure 8:
Extended Data Figure 8:. Compositional biases in PLCDs drawn from homologs of the FUS / FET family of proteins.
(a) 2D histogram quantifying the distributions of lengths of PLCDs from FUS / FET family homologs and their compositional similarities to WT A1-LCD. (b) Histogram of the distribution of NCPR values; (c) Histogram of fraction of aromatic residues (Tyr, Phe, and Trp); (d) distribution of Tyr versus Phe asymmetries for LCDs from FUS / FET family homologs; numerical values are mean values of the respective distribution ± the standard deviation. (e) 2D histogram quantifying covariations in fractions of Tyr versus Phe residues across PLCDs.
Fig. 1:
Fig. 1:. Compositional analysis and covariation of aromatic content of hnRNPA1.
(a) Amino acid sequence and compositional statistics for the PLCD from isoform a of hnRNPA1 – referred to in the text as A1-LCD. (b) 2D histogram quantifying covariations in fractions of Tyr versus Phe residues across PLCDs. (c) Diagram of aromatic content type and placement in variants. Numbers next to each schematic indicate the number of residues of a certain type. Vertical bars in the schematics indicate the positions of Phe (brown) and Tyr (yellow) residues. (d) Differential interference contrast (DIC) images showing dense liquid droplets. Solution conditions were 20 mM HEPES, 150 mM NaCl, pH 7.0. (e) Binodals of A1-LCD variants as a function of temperature in 20 mM HEPES, 150 mM NaCl, pH 7.0. (f) A1-LCD variant saturation concentrations measured at 4°C.
Fig. 2:
Fig. 2:. Aromatic residue type and content influences balance of entropic and enthalpic contributions to phase separation.
(a) Diagram of aromatic content type and placement in variants. (b) A1-LCD variant saturation concentrations measured at 4°C. Solution conditions were 20 mM HEPES, 150 mM NaCl, pH 7.0. (c) Results from van’t Hoff analysis of select A1-LCD aromatic variants. Each data point is an average saturation concentration taken from at least 3 measurements at the given temperature. (d) Inferred values of Δh° plotted against σYF for all A1-LCD aromatic variants used in this study. Solid lines are linear fits to the data. Estimates for Δh°(d) and –Δs°/R (e) extracted from the van’t Hoff analysis. Red dashed lines are the linear fits to the data. Here, R= 0.00199 kcal/mol*K.
Fig. 3:
Fig. 3:. Role of charged residues in PLCD phase separation.
(a) Distribution of NCPR values and (b) distributions of fractions of Arg and Lys residues across A1-LCD homologs. Numerical values are mean values of the respective distribution ± the standard deviations. (c) Diagram of Arg/Lys content and placement across variants that test the role of Arg residues. Numbers next to each schematic indicate the number of Arg residues. Vertical bars in the schematics indicate the position of Arg residues (light blue). (d) Saturation concentrations of variants from (c) measured at 4°C. Solution conditions were 20 mM HEPES, 150 mM NaCl, pH 7.0. For binodals of variants see Supplementary Fig. 2. (e) Tyr and Phe sidechain planes of 13C-resolved 1Haromatic-1Haliphatic NOESY spectrum show NOEs between sidechain protons of Tyr/Phe and Hδ protons of Arg. Degenerate Arg Hδ proton resonances are shown as strips of (H)CC(CO)NH spectrum. A single (H)CC(CO)NH strip (corresponding to G63/N62) corresponds to the upfield carbon NOE resonance frequency. The other NOEs could not be unambiguously assigned. NMR spectra of A1-LCD Δhexa were recorded at 40°C to enable high enough concentrations without phase separation.
Fig. 4:
Fig. 4:. Role of charged residues in PLCD phase separation.
(a) Diagram of Arg / Lys content and placement across variants that test the role of Lys residues. (b) Saturation concentrations of variants from (a) measured at 4°C. (c) Diagram of Asp/Glu content and placement in variants that test the role of negatively charged residues. (d) Saturation concentrations of variants from (c) measured at 4°C. (e) Diagram of Arg, Lys, Asp, and Glu content and placement in variants that test the role of oppositely charged residues. (f) Saturation concentrations of variants from (e) measured at 4°C. (g) DIC images showing dense droplets for select variants from Fig. 3 and 4. Solution conditions were 20 mM HEPES, 150 mM NaCl, pH 7.0. For binodals of variants see Supplementary Fig. 2.
Fig. 5:
Fig. 5:. NCPR modulates A1-LCD phase separation.
(a) Diagram illustrating the expected effect of net charge on driving force for phase separation. (b) csat values from data measured at 4 °C, plotted against NCPR for a subset of the sequence variants. Each data point is an average saturation concentration taken from at least 3 measurements at the given temperature. (c) Results of rescaling csat to account for the effects of Arg stickers. (d) Results of rescaling that accounts for the destabilizing effects of Lys in addition to accounting for the effects of Arg stickers. (e) Results of rescaling data using the approaches that lead to panels (b) and (c) combined with an accounting for the temperature-dependent variations to csat. The result is a master curve onto which all csat data for all measured temperatures collapse. The legends show the Pearson r-values that quantify the negative and positive linear correlations of the left and right arms, respectively. Variants not used for parameterization of the mean-field model were generated and their data shown as diamonds. (f) Histogram of calculated csat values for 770 PLCDs from the set of 848 sequences derived from hnRNPA1 homologs. These csat values were calculated using the mean-field model that yields csc,3 in (e).
Fig. 6:
Fig. 6:. Mean-field electrostatic effects can disrupt the strong coupling between driving forces for single-chain contraction and phase separation.
(a) Normalized Kratky plot of SEC-SAXS data for aromatic variants of A1-LCD. Solid lines are fits to an empirical molecular form factor (MFF). Dashed lines show the predicted behavior at larger q values, where the experimental data are noisy. (b) Correlation between log10(csat) and inferred values of νapp for the aromatic variants. Red dashed line is the linear fit to the data. (c) Correlation between log10(csat) and inferred νapp values for the charge variants. The dashed line is the linear fit of the aromatic variants from (b). (d) Residuals from the correlation in (b) for all variants. Data for charge variants are shown using unmodified and shifted csat values as in (c) and (e), respectively. Red dashed lines indicate the bounds of the aromatic residuals. (e) Residuals from the correlation in (b) versus NCPR for the charge variants. Red dashed lines show two linear fits, i.e., for the variants whose NCPR is less than or equal to that of the +7K+12D variant and greater than or equal to that of the +7K+12D variant on the left and right, respectively. (f) Residuals from the linear correlation of log10(csat, shift) vs. νapp for charge variants. Here, csat, shift refers to the csat values that are shifted based on the linear fits in (e). Red dashed lines indicate the bounds of the aromatic residuals. (g) Schematic showing strong coupling of single-chain dimensions and driving force for phase separation across variants titrating sticker strength and valence, but the potential for decoupling for variants with small changes to NCPR. Error bars associated with νapp values in (b) and (c) represent uncertainty from fitting SAXS data to MFFs. Saturation concentrations were measured independently at least 3 times for each variant.
Fig. 7:
Fig. 7:. Gly and Ser are spacers with different effective solvation volume.
(a-c) 2D histograms quantifying covariations in fractions of Tyr versus Gly (a), Phe versus Ser (b), and Ser versus Gly (c) residues across A1-LCD homologs. (d) A1-LCD variant saturation concentrations measured at 20°C. Gly vs. Ser content is titrated in the WT A1-LCD (left), in the background of the variant in which all aromatic residues are Tyr (middle), or in the background of the variant in which all aromatic residues are Phe (right). (e) Cartoon highlighting the hierarchy of physicochemical effects underlying the driving force of phase separation encoded in the evolutionarily conserved composition of PLCDs. Cohesive interactions between disordered chains made up of sticker and spacer residues (beads of grey shades) result in condensates (green droplets). Tyr-Tyr, Tyr-Phe and Phe-Phe interactions have, in order, decreasing pairwise interaction strengths. Arg residues act as auxiliary stickers with aromatic residues if the NCPR is favorable. Lys residues weaken sticker-sticker interactions via 3-body effects. Glycine, serine and charged residues are spacer residues that modulate the driving forces for phase separation through their effects on the ves of spacers. The higher the ves, the weaker is the driving force for phase separation. The NCPR of PLCDs affects phase separation via mean-field electrostatic effects, modulating the saturation concentration by up to three orders of magnitude. NCPR values close to electroneutrality favor phase separation whereas unbalanced charges increase solubility and weaken phase separation.

References

    1. Brangwynne CP, Eckmann CR, Courson DS, Rybarska A, Hoege C, Gharakhani J, et al. Germline P granules are liquid droplets that localize by controlled dissolution/condensation. Science 2009, 324(5935): 1729–1732. - PubMed
    1. Li P, Banjade S, Cheng H-C, Kim S, Chen B, Guo L, et al. Phase transitions in the assembly of multivalent signalling proteins. Nature 2012, 483(7389): 336–340. - PMC - PubMed
    1. Sabari BR, Dall’Agnese A, Boija A, Klein IA, Coffey EL, Shrinivas K, et al. Coactivator condensation at super-enhancers links phase separation and gene control. Science 2018, 361(6400): eaar3958. - PMC - PubMed
    1. Riggs CL, Kedersha N, Ivanov P, Anderson P. Mammalian stress granules and P bodies at a glance. Journal of Cell Science 2020, 133(16): jcs242487. - PMC - PubMed
    1. Yang P, Mathieu C, Kolaitis RM, Zhang P, Messing J, Yurtsever U, et al. G3BP1 Is a Tunable Switch that Triggers Phase Separation to Assemble Stress Granules. Cell 2020, 181(2): 325–345 e328. - PMC - PubMed

Publication types

MeSH terms