. 2022 Feb;18(2):161-170.
doi: 10.1038/s41589-021-00919-y. Epub 2021 Dec 20.

A counter-enzyme complex regulates glutamate metabolism in Bacillus subtilis

Affiliations

A counter-enzyme complex regulates glutamate metabolism in Bacillus subtilis

Vijay Jayaraman et al. Nat Chem Biol. 2022 Feb.

Abstract

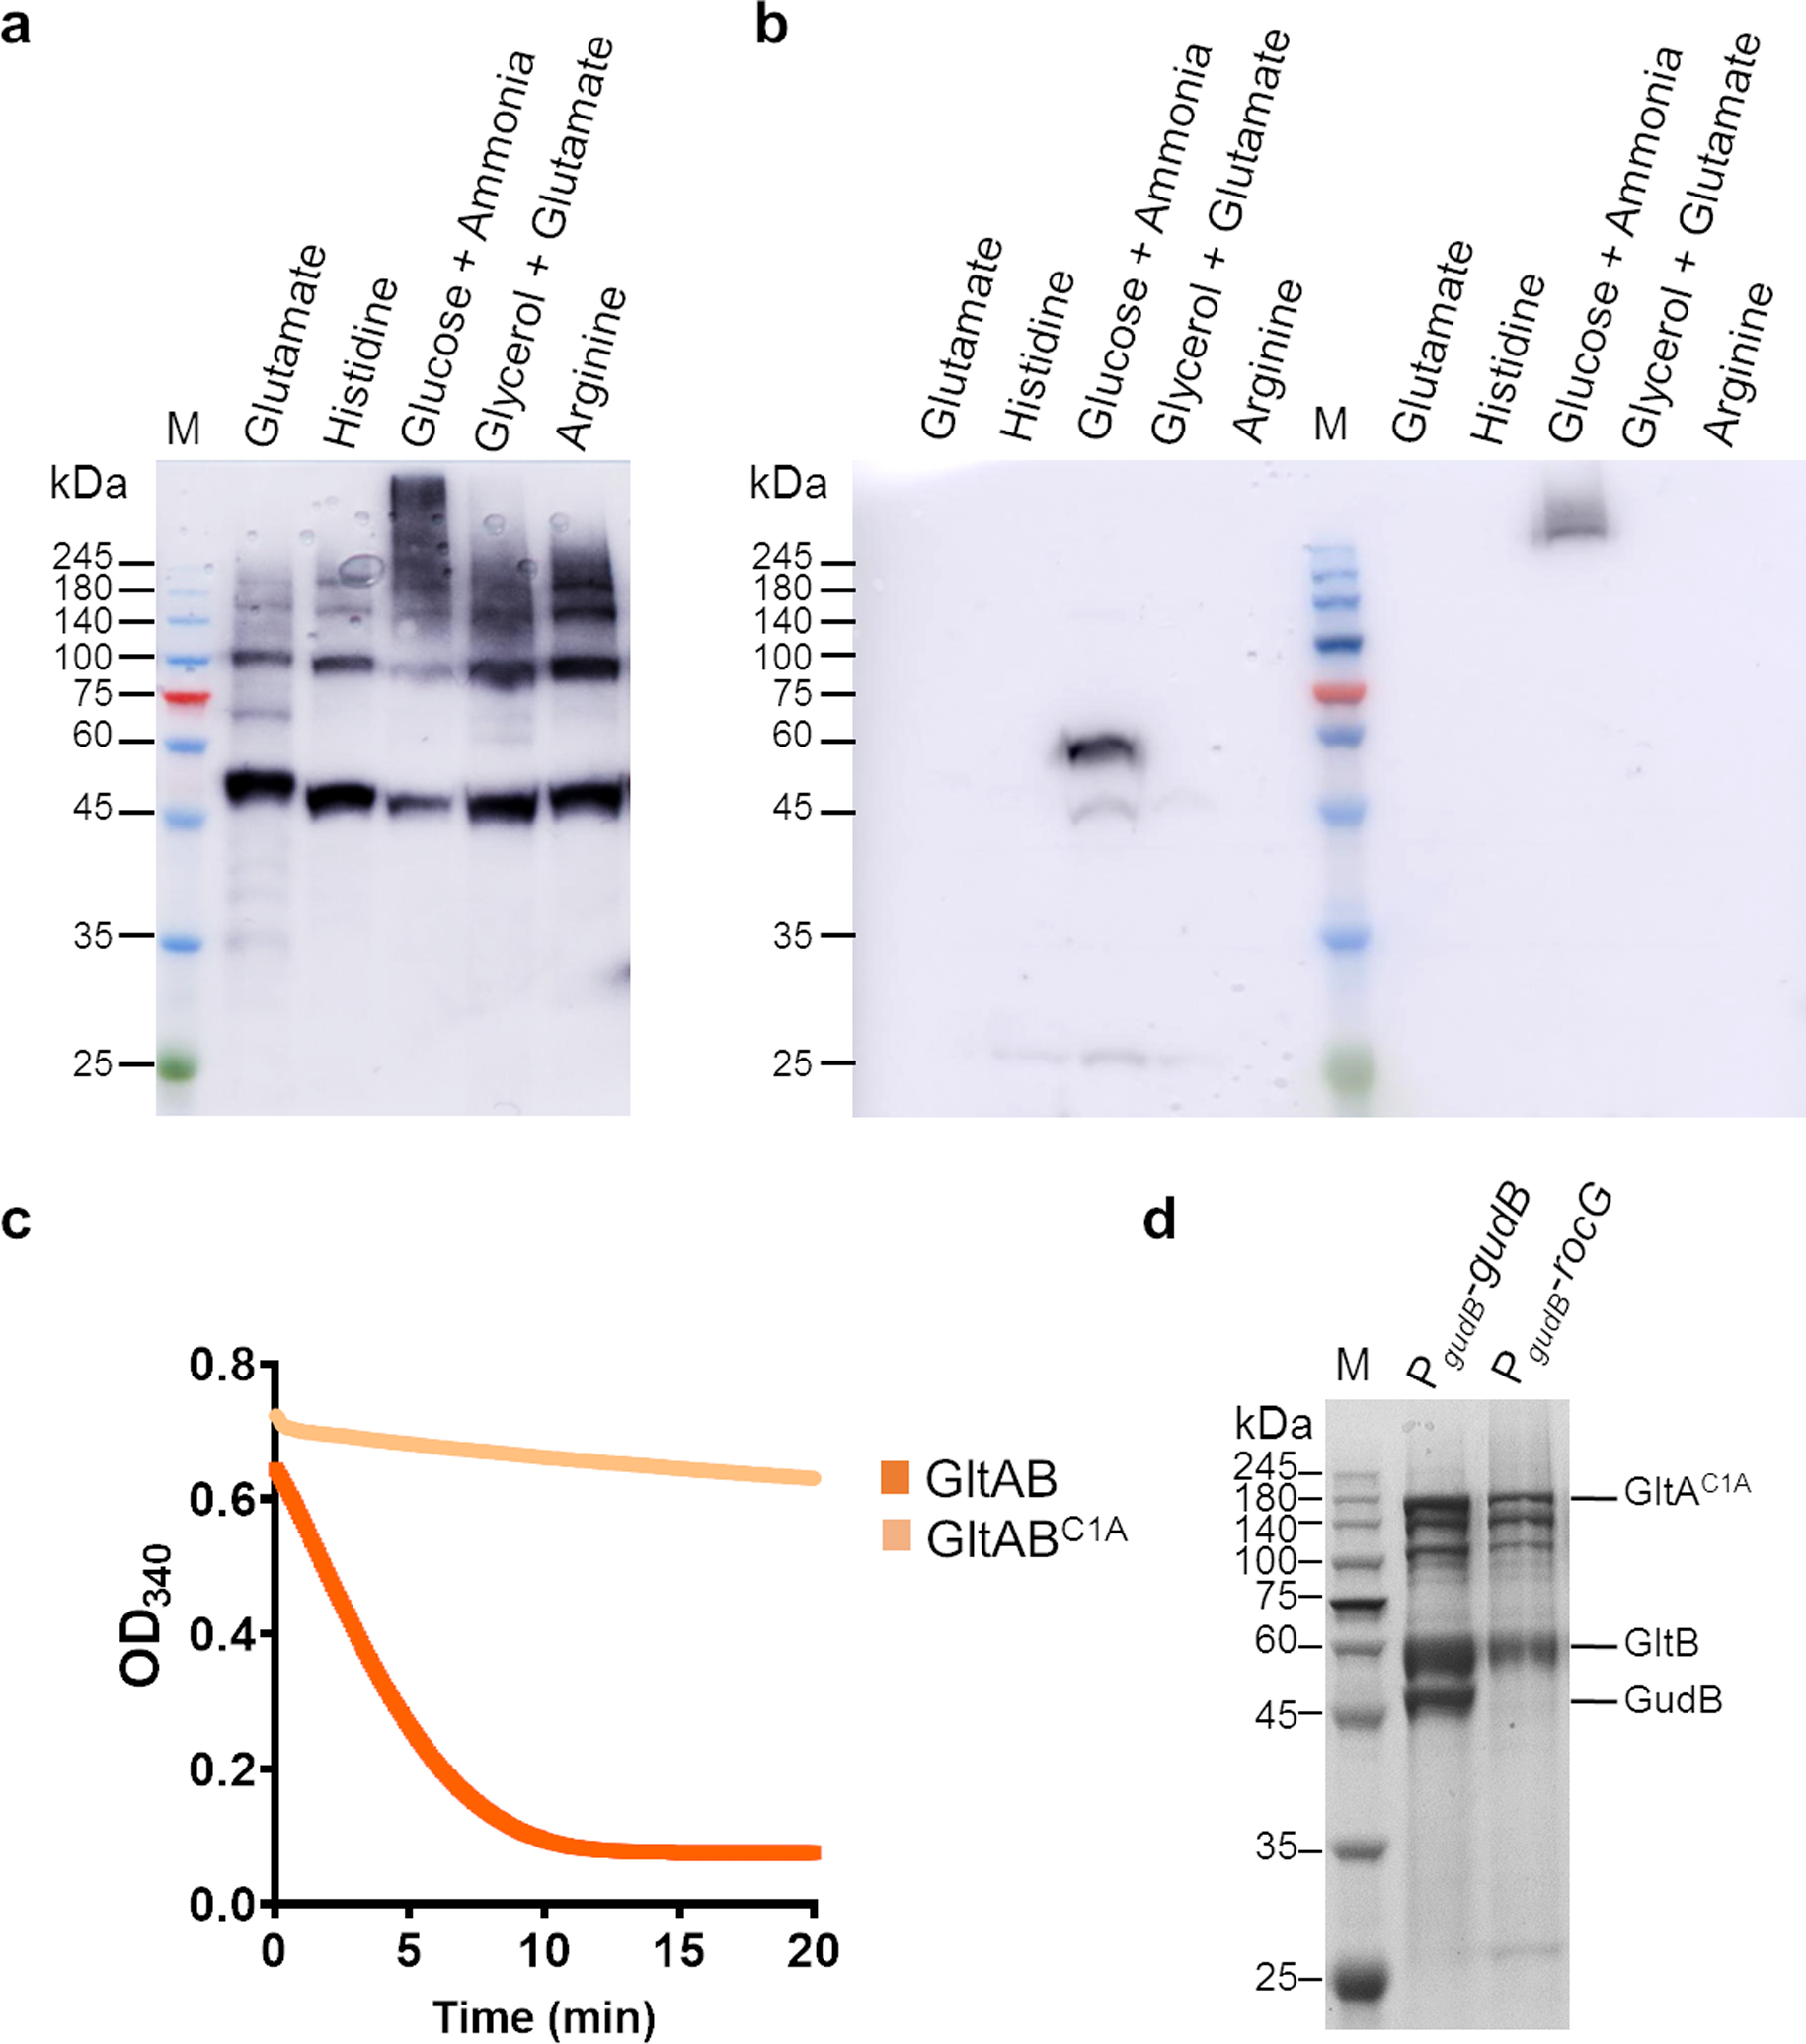
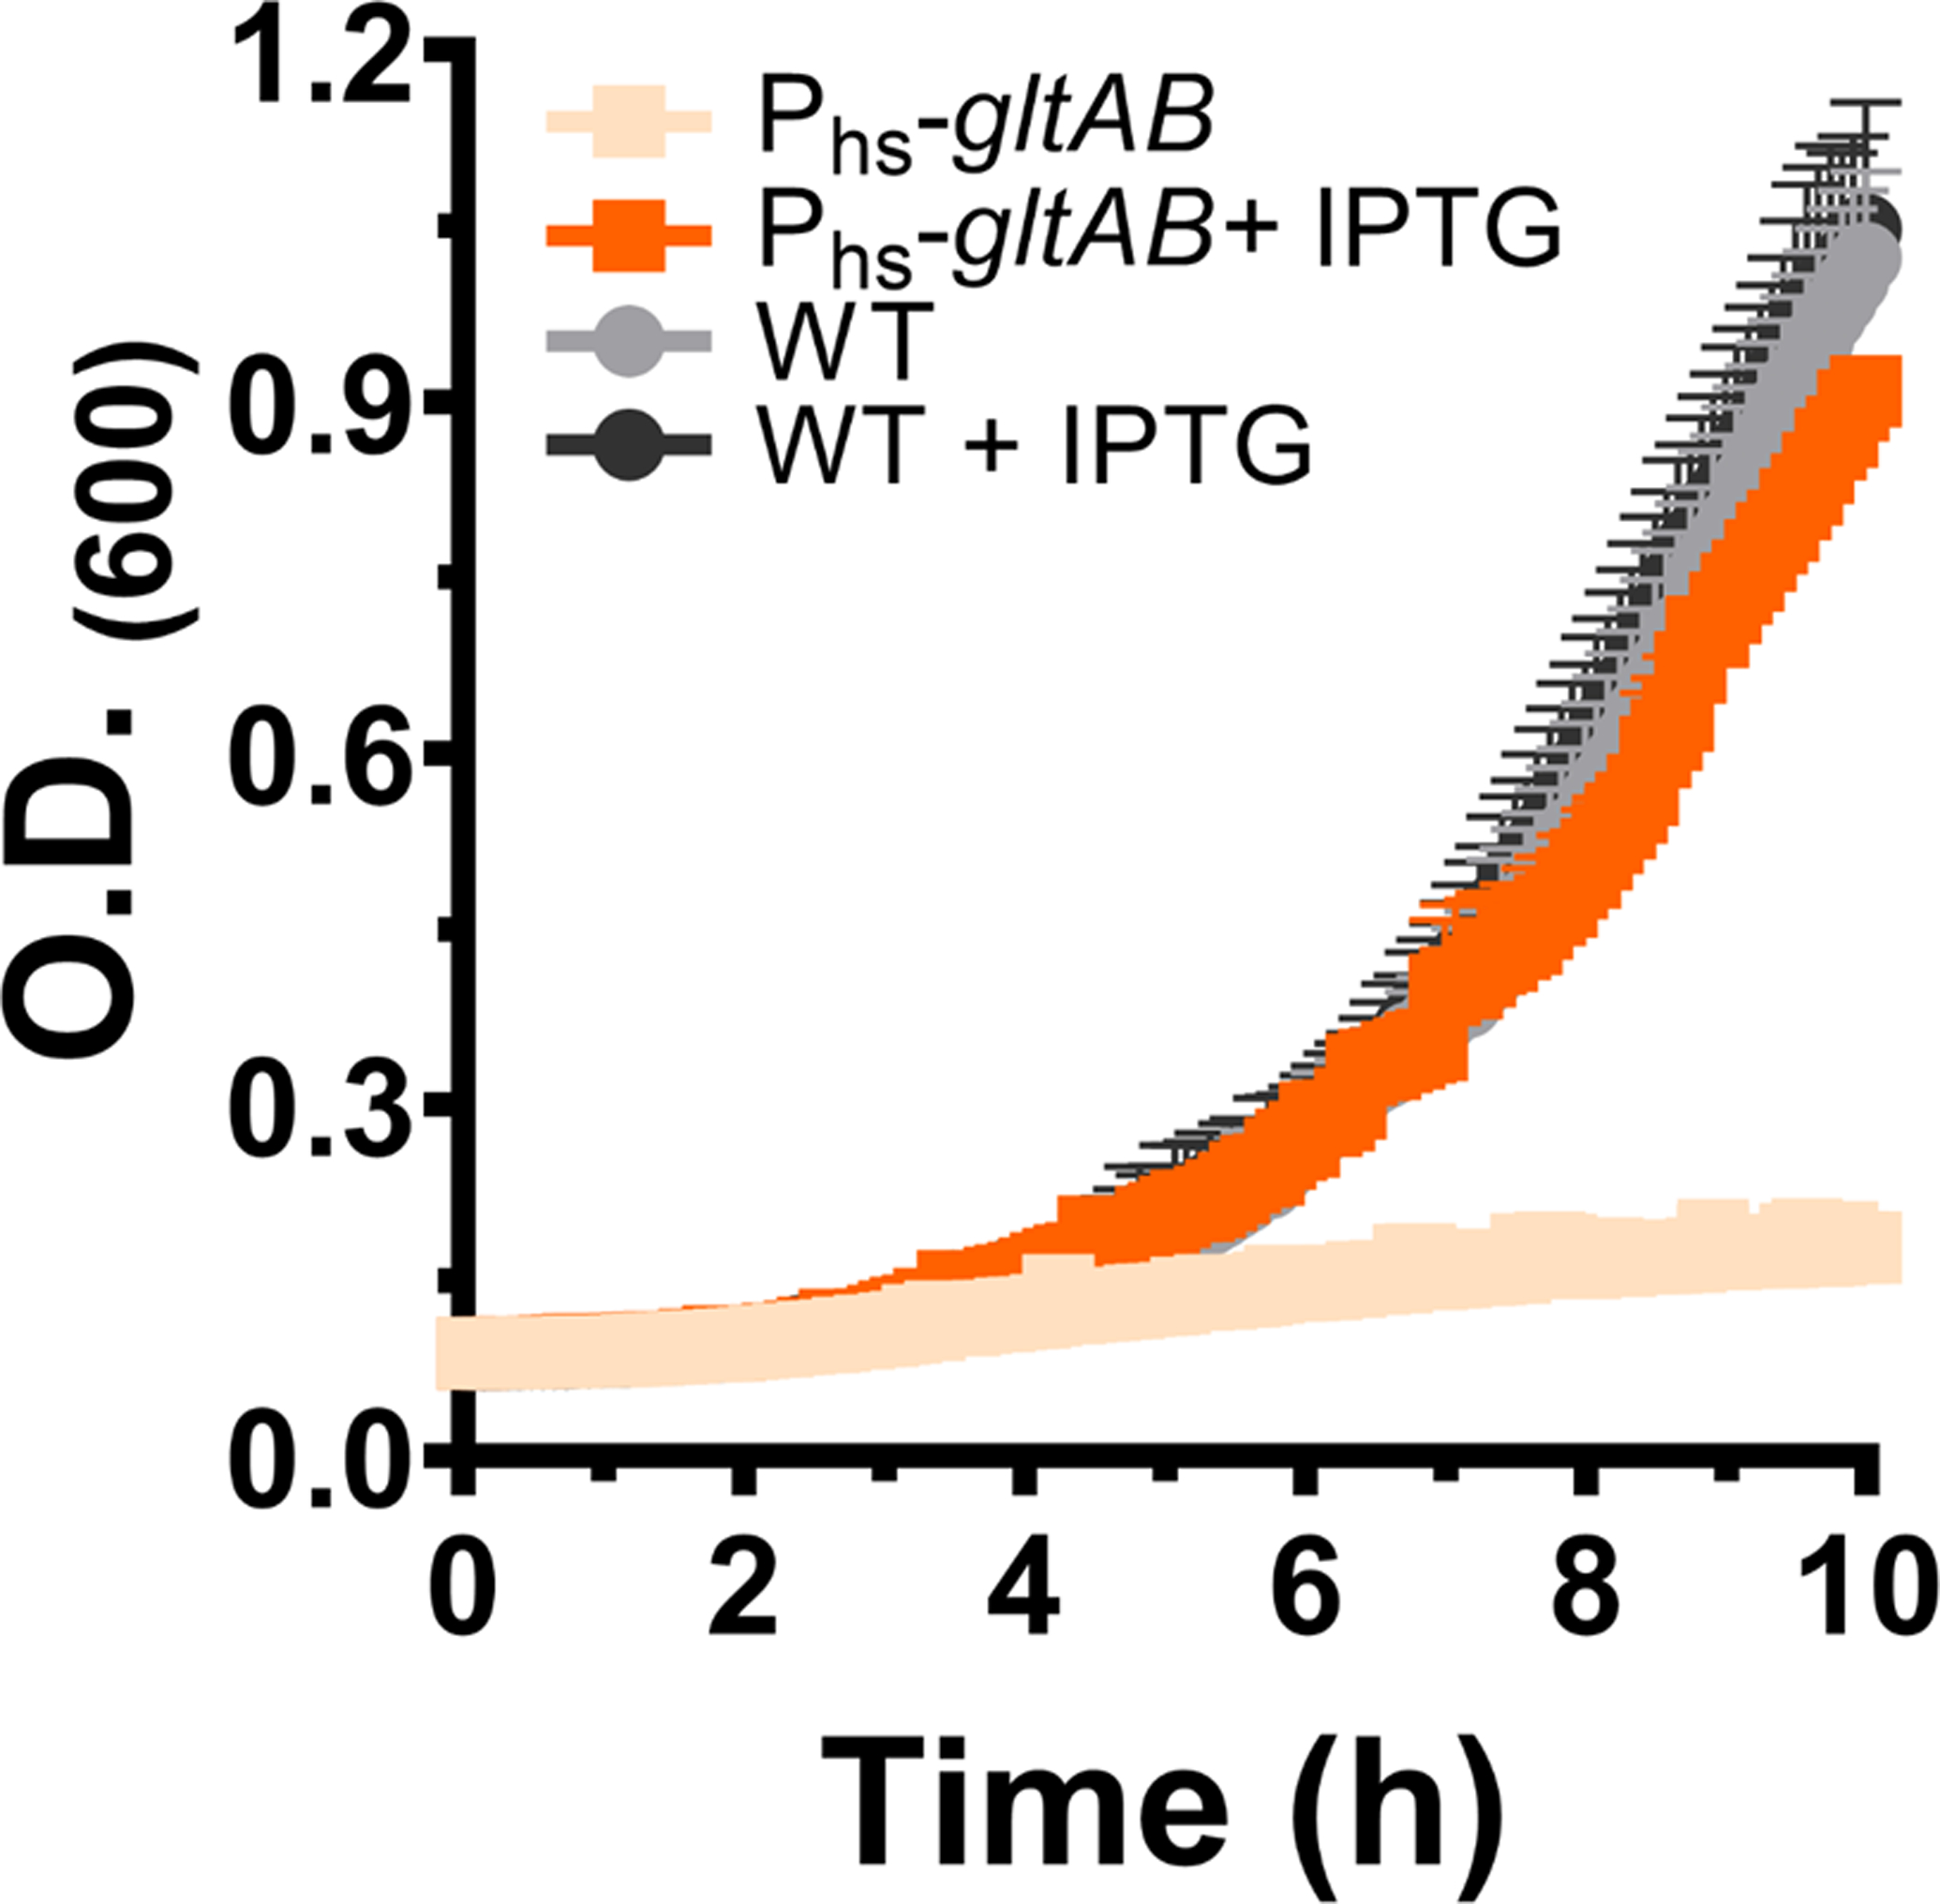
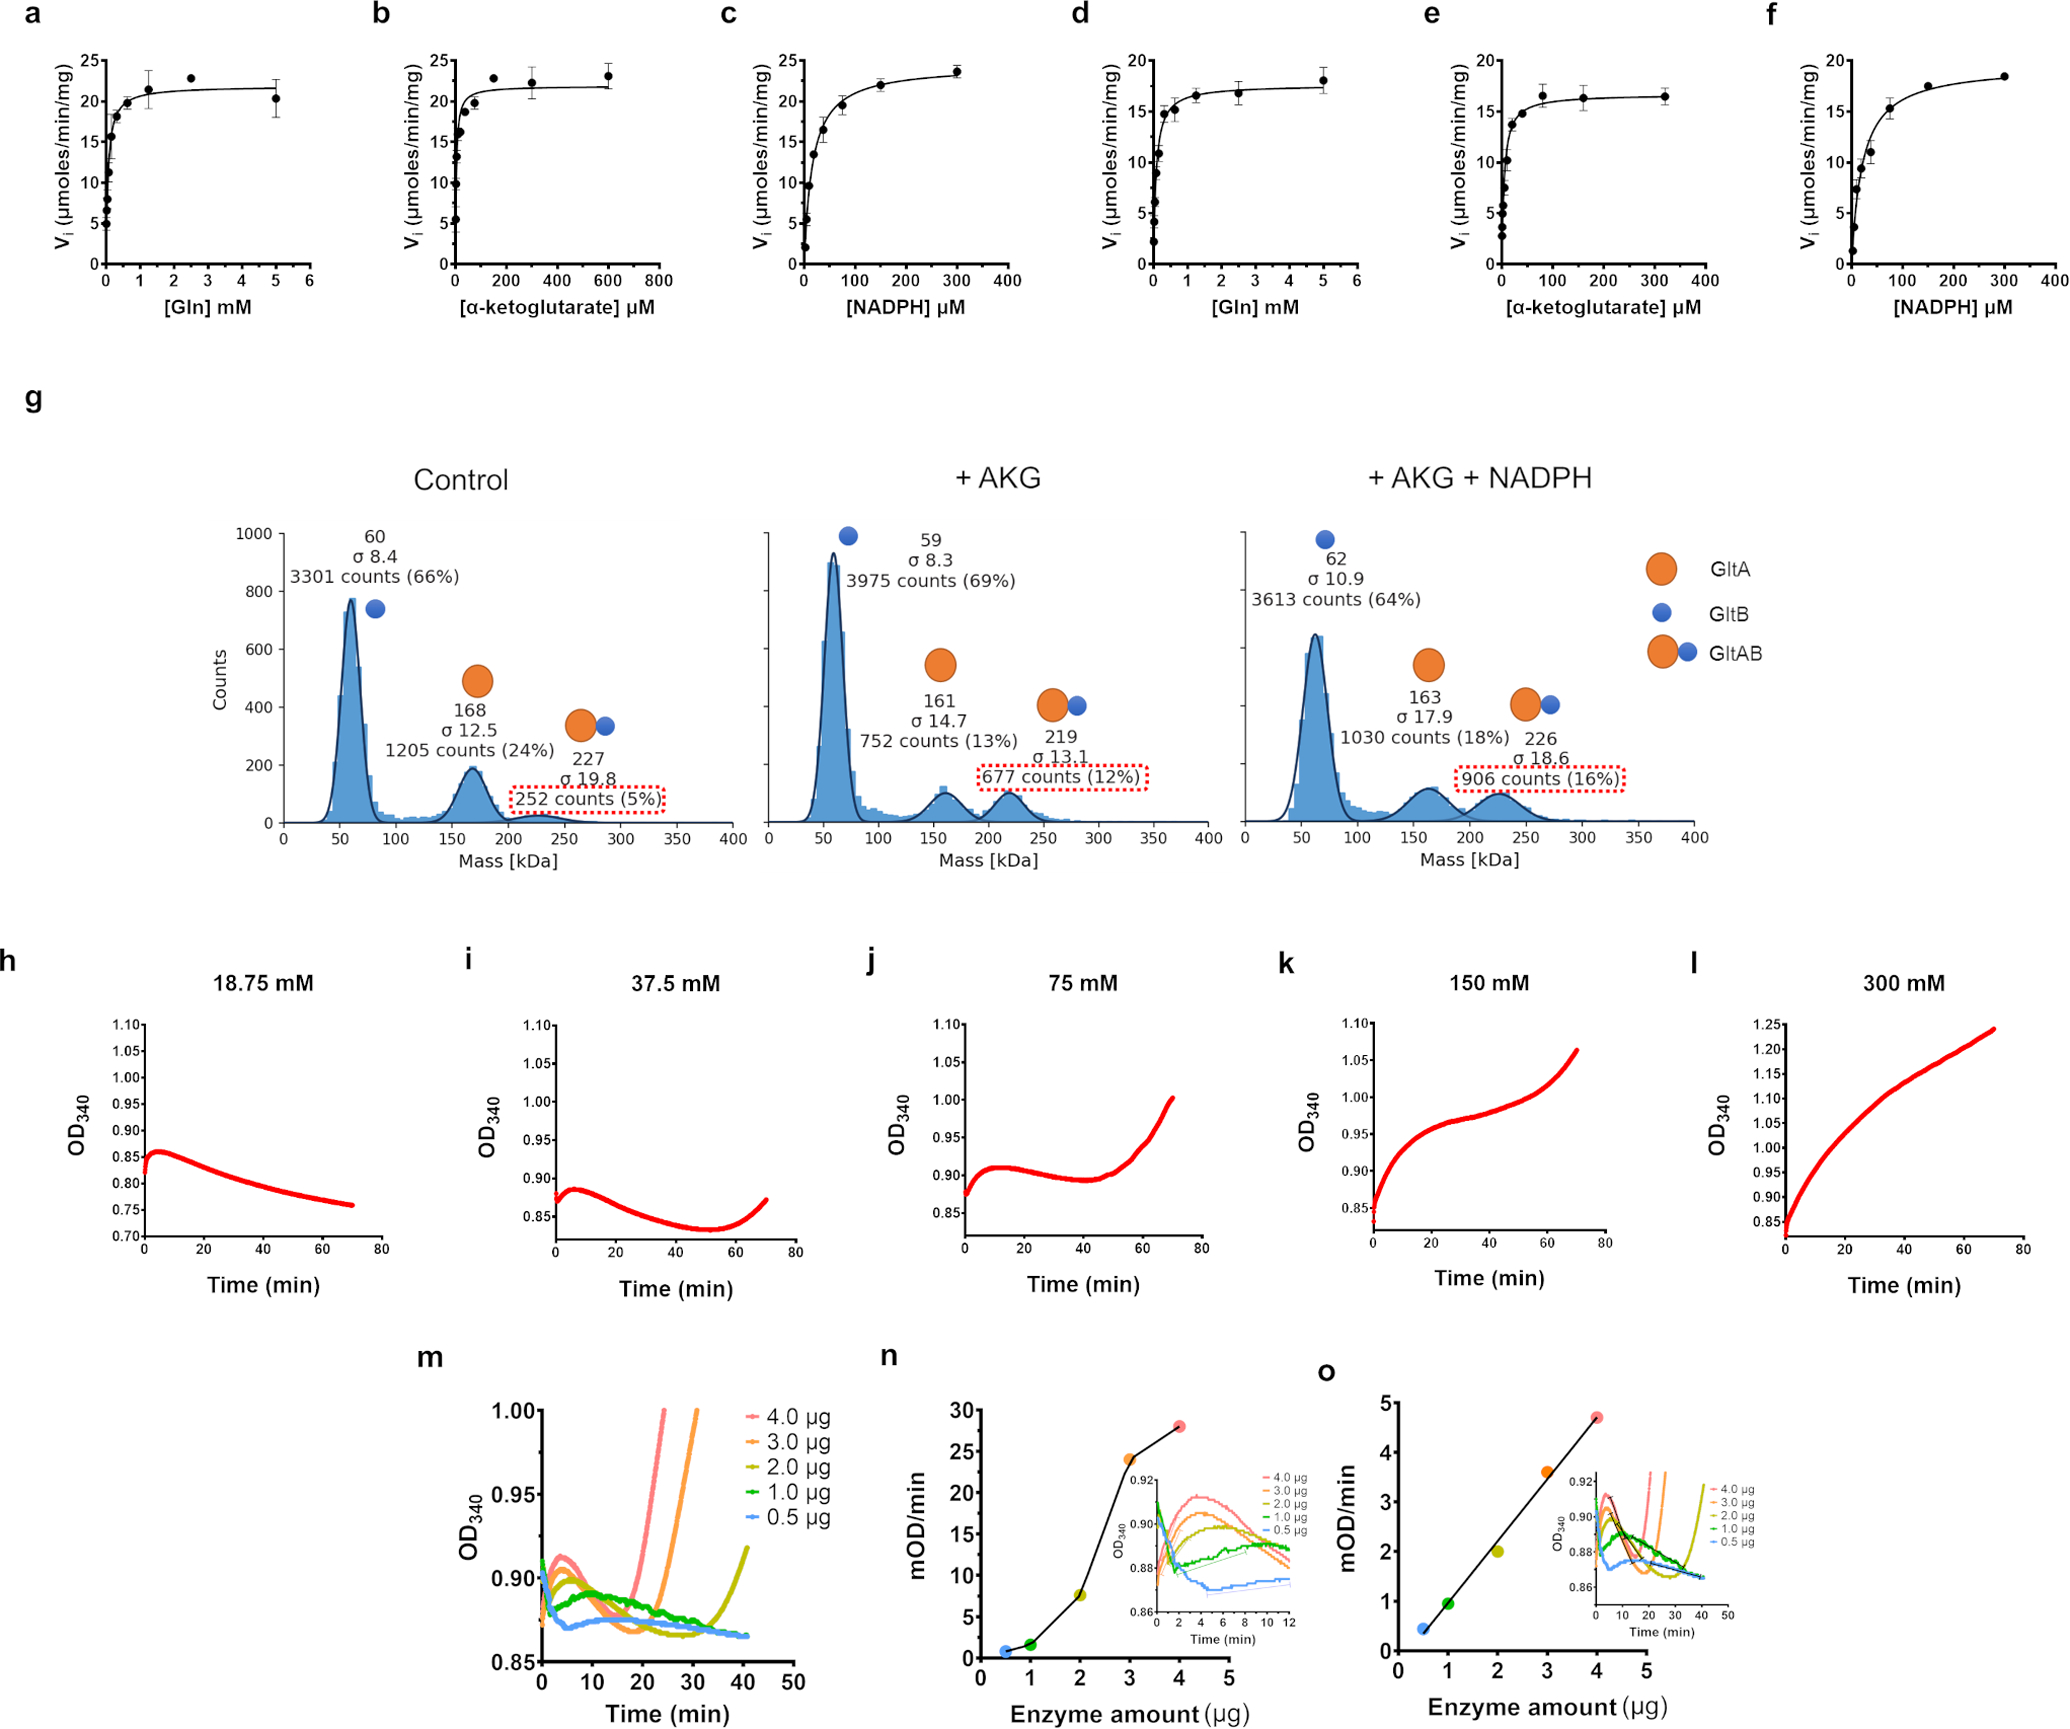
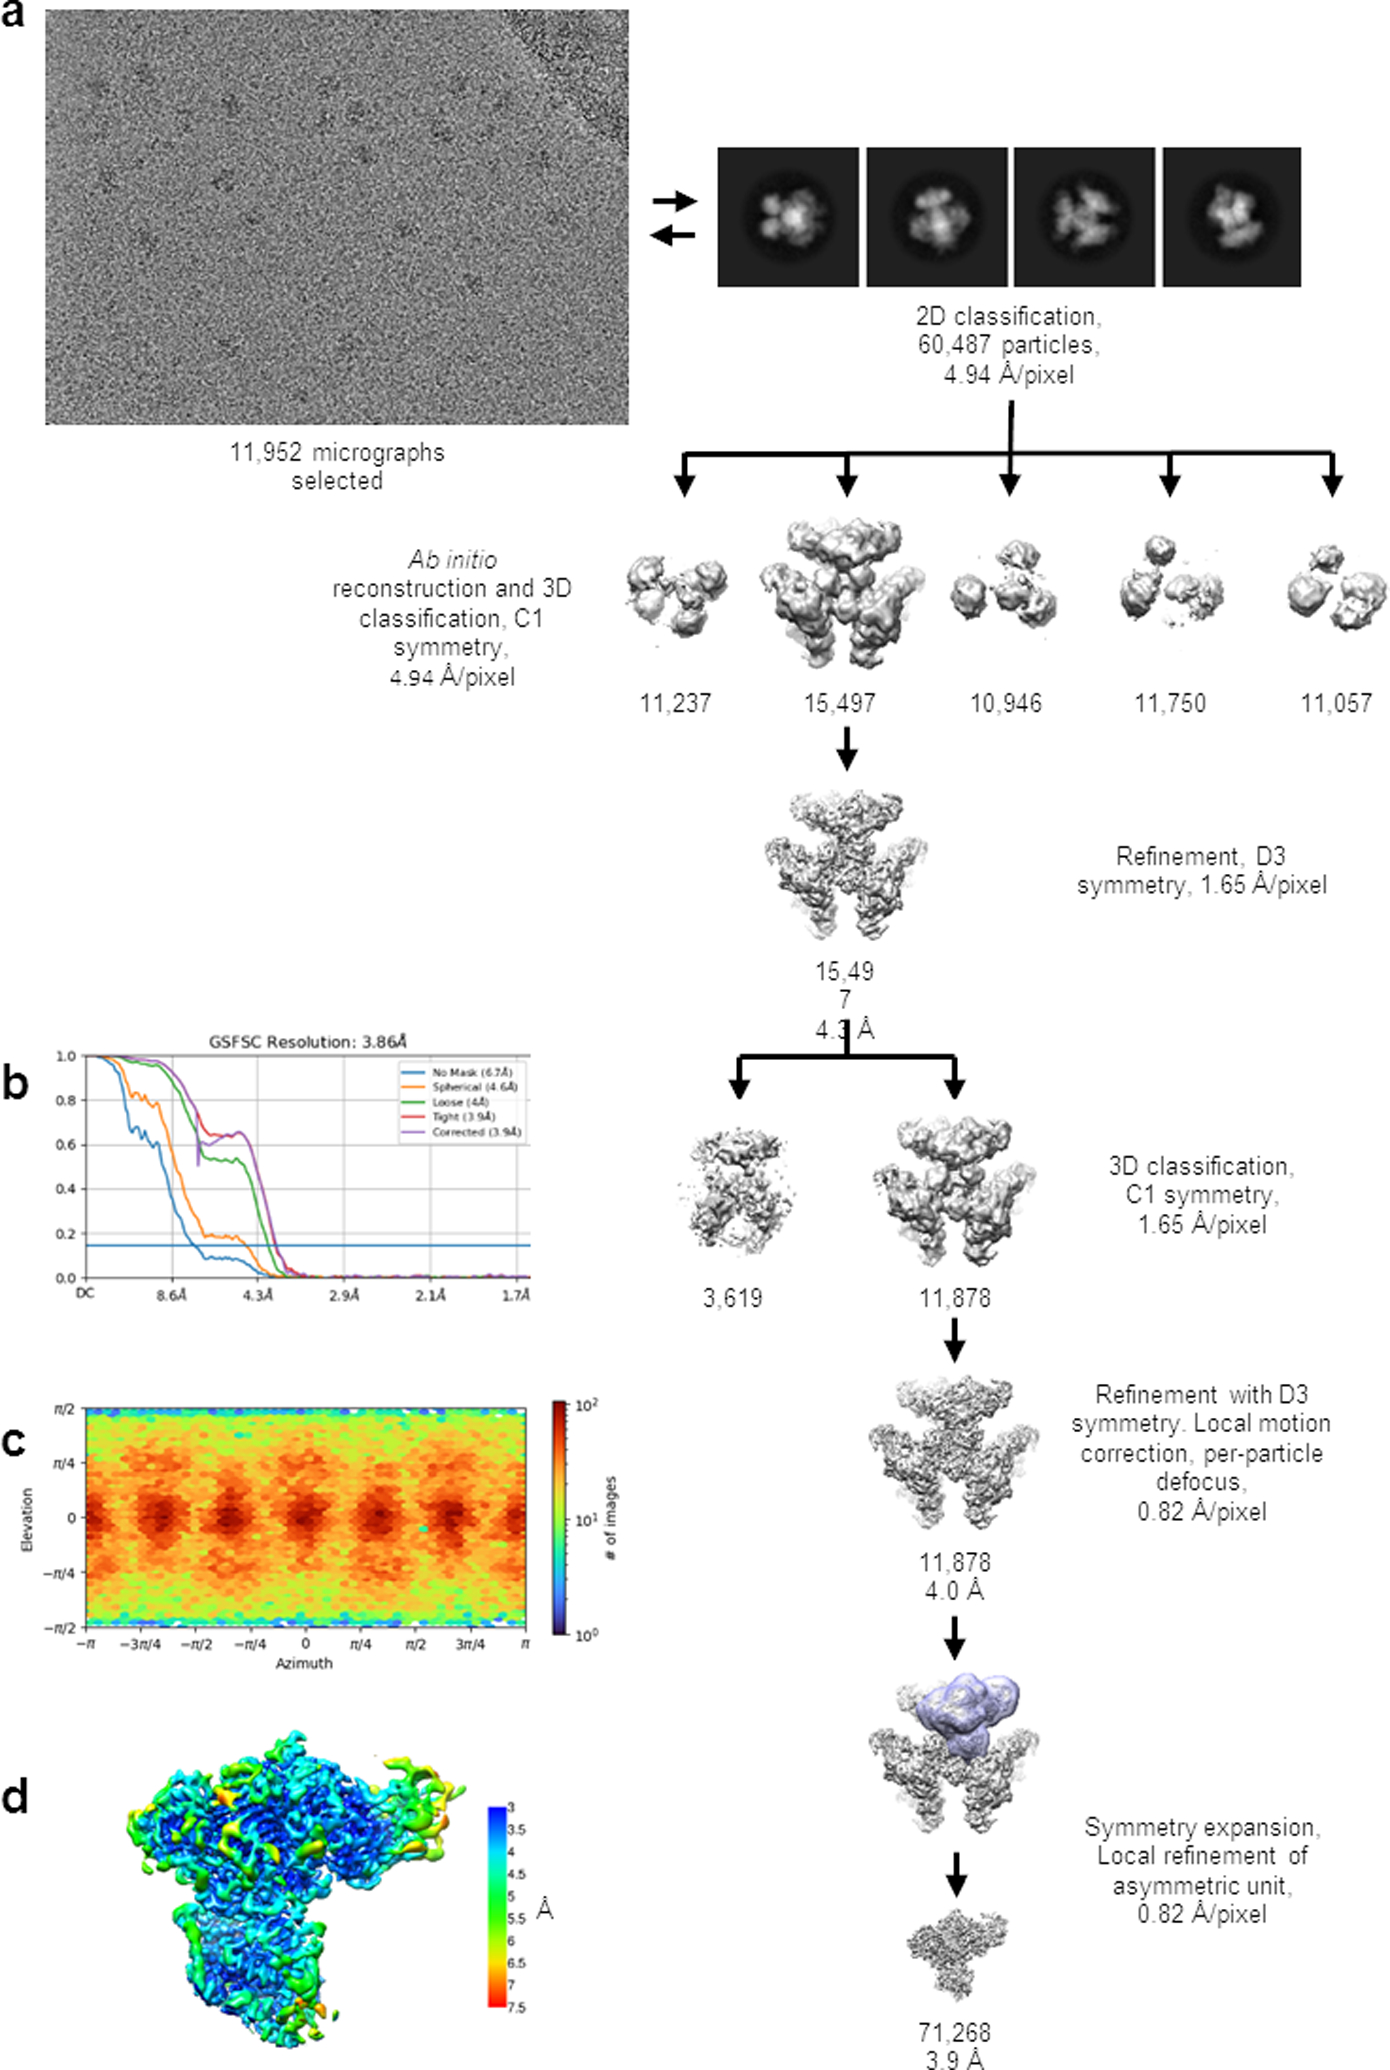
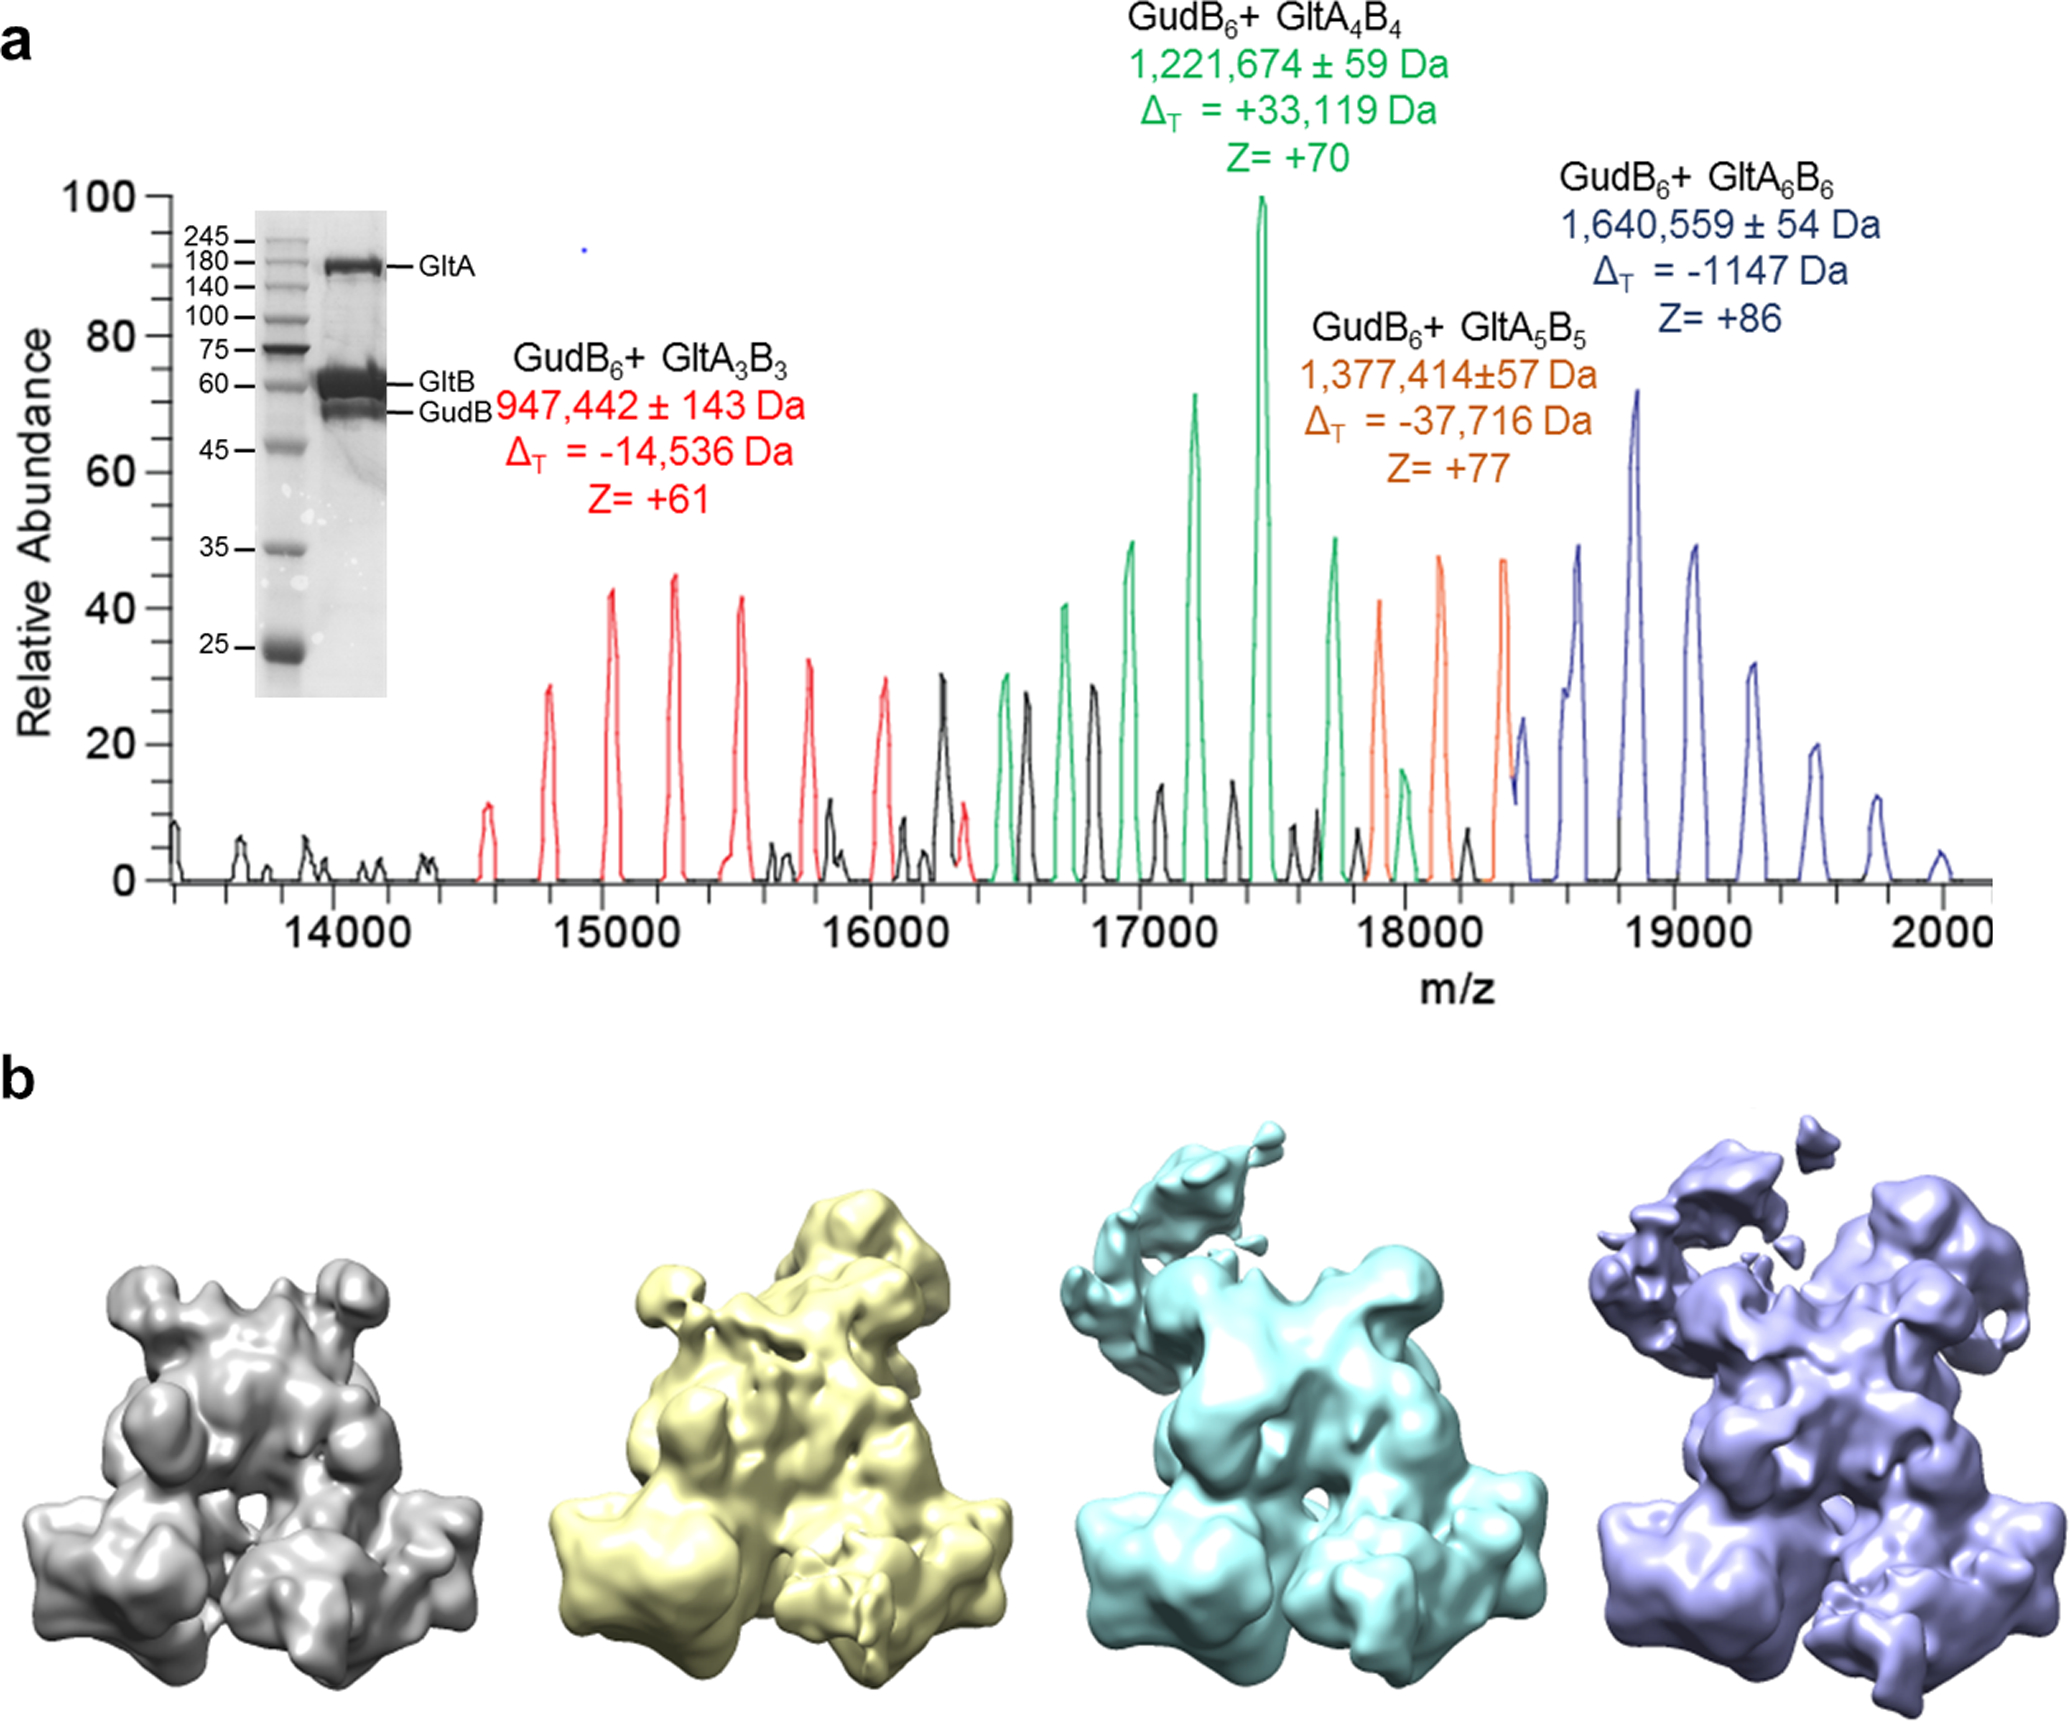
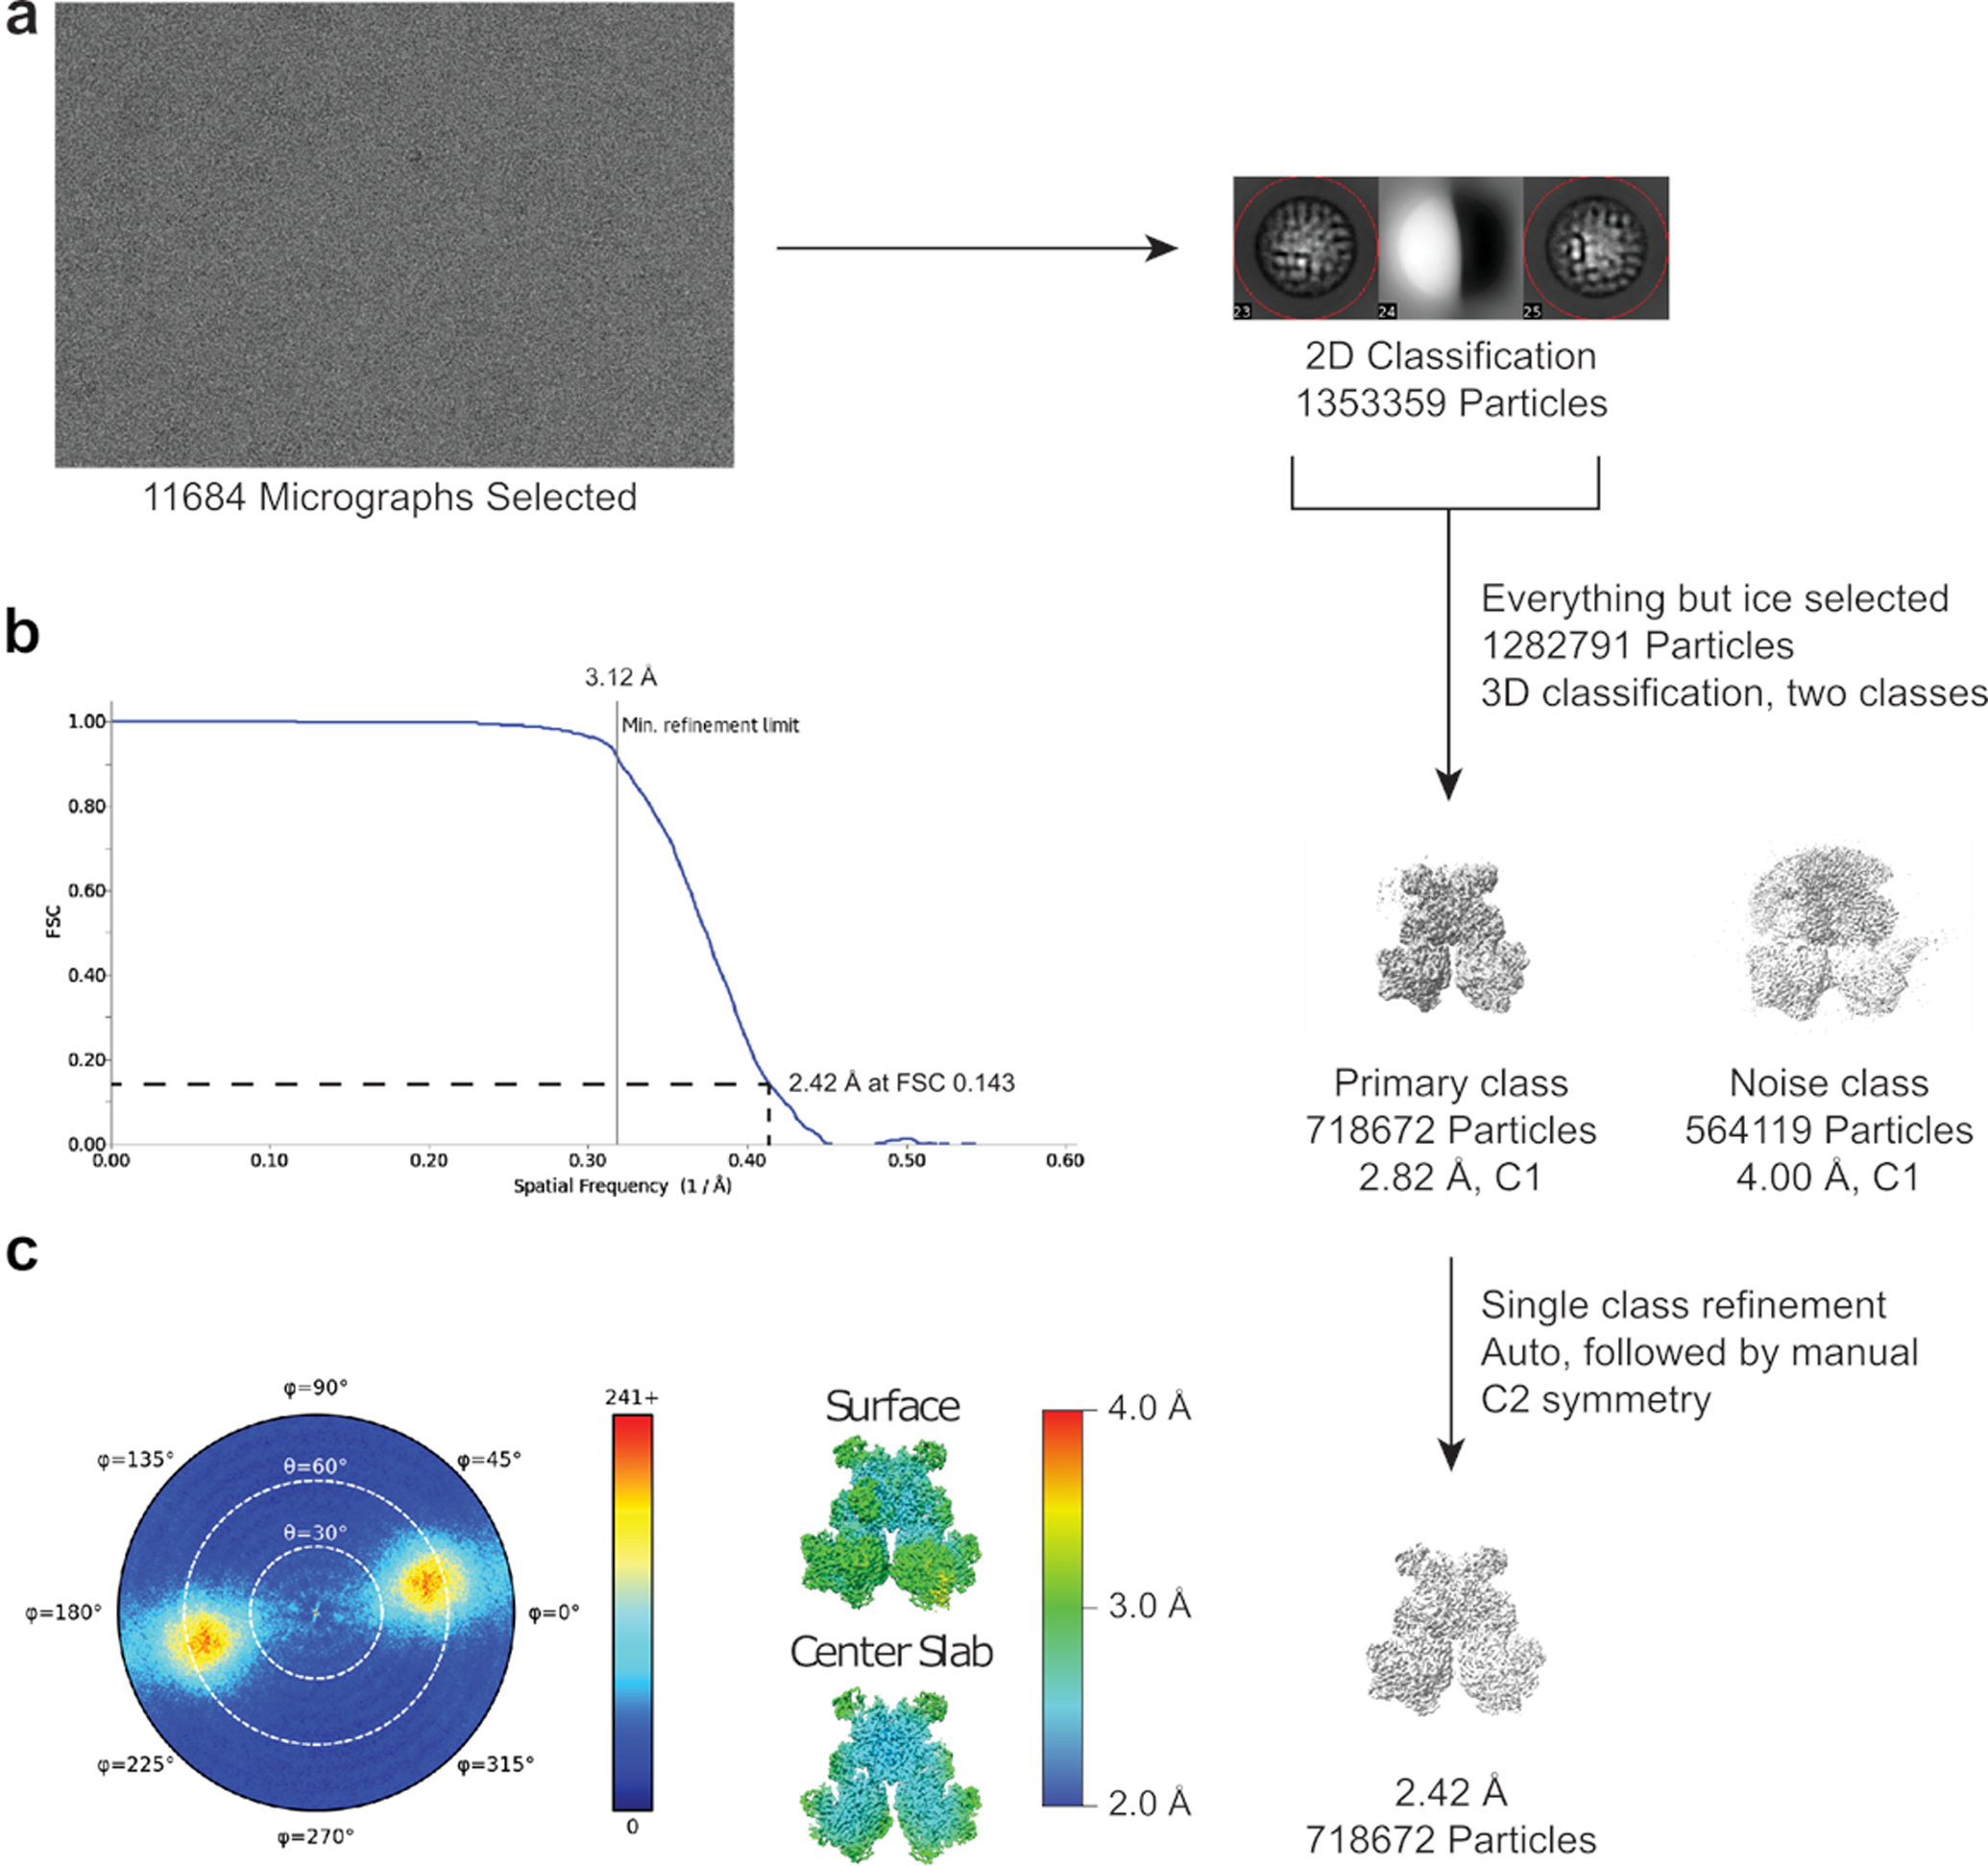
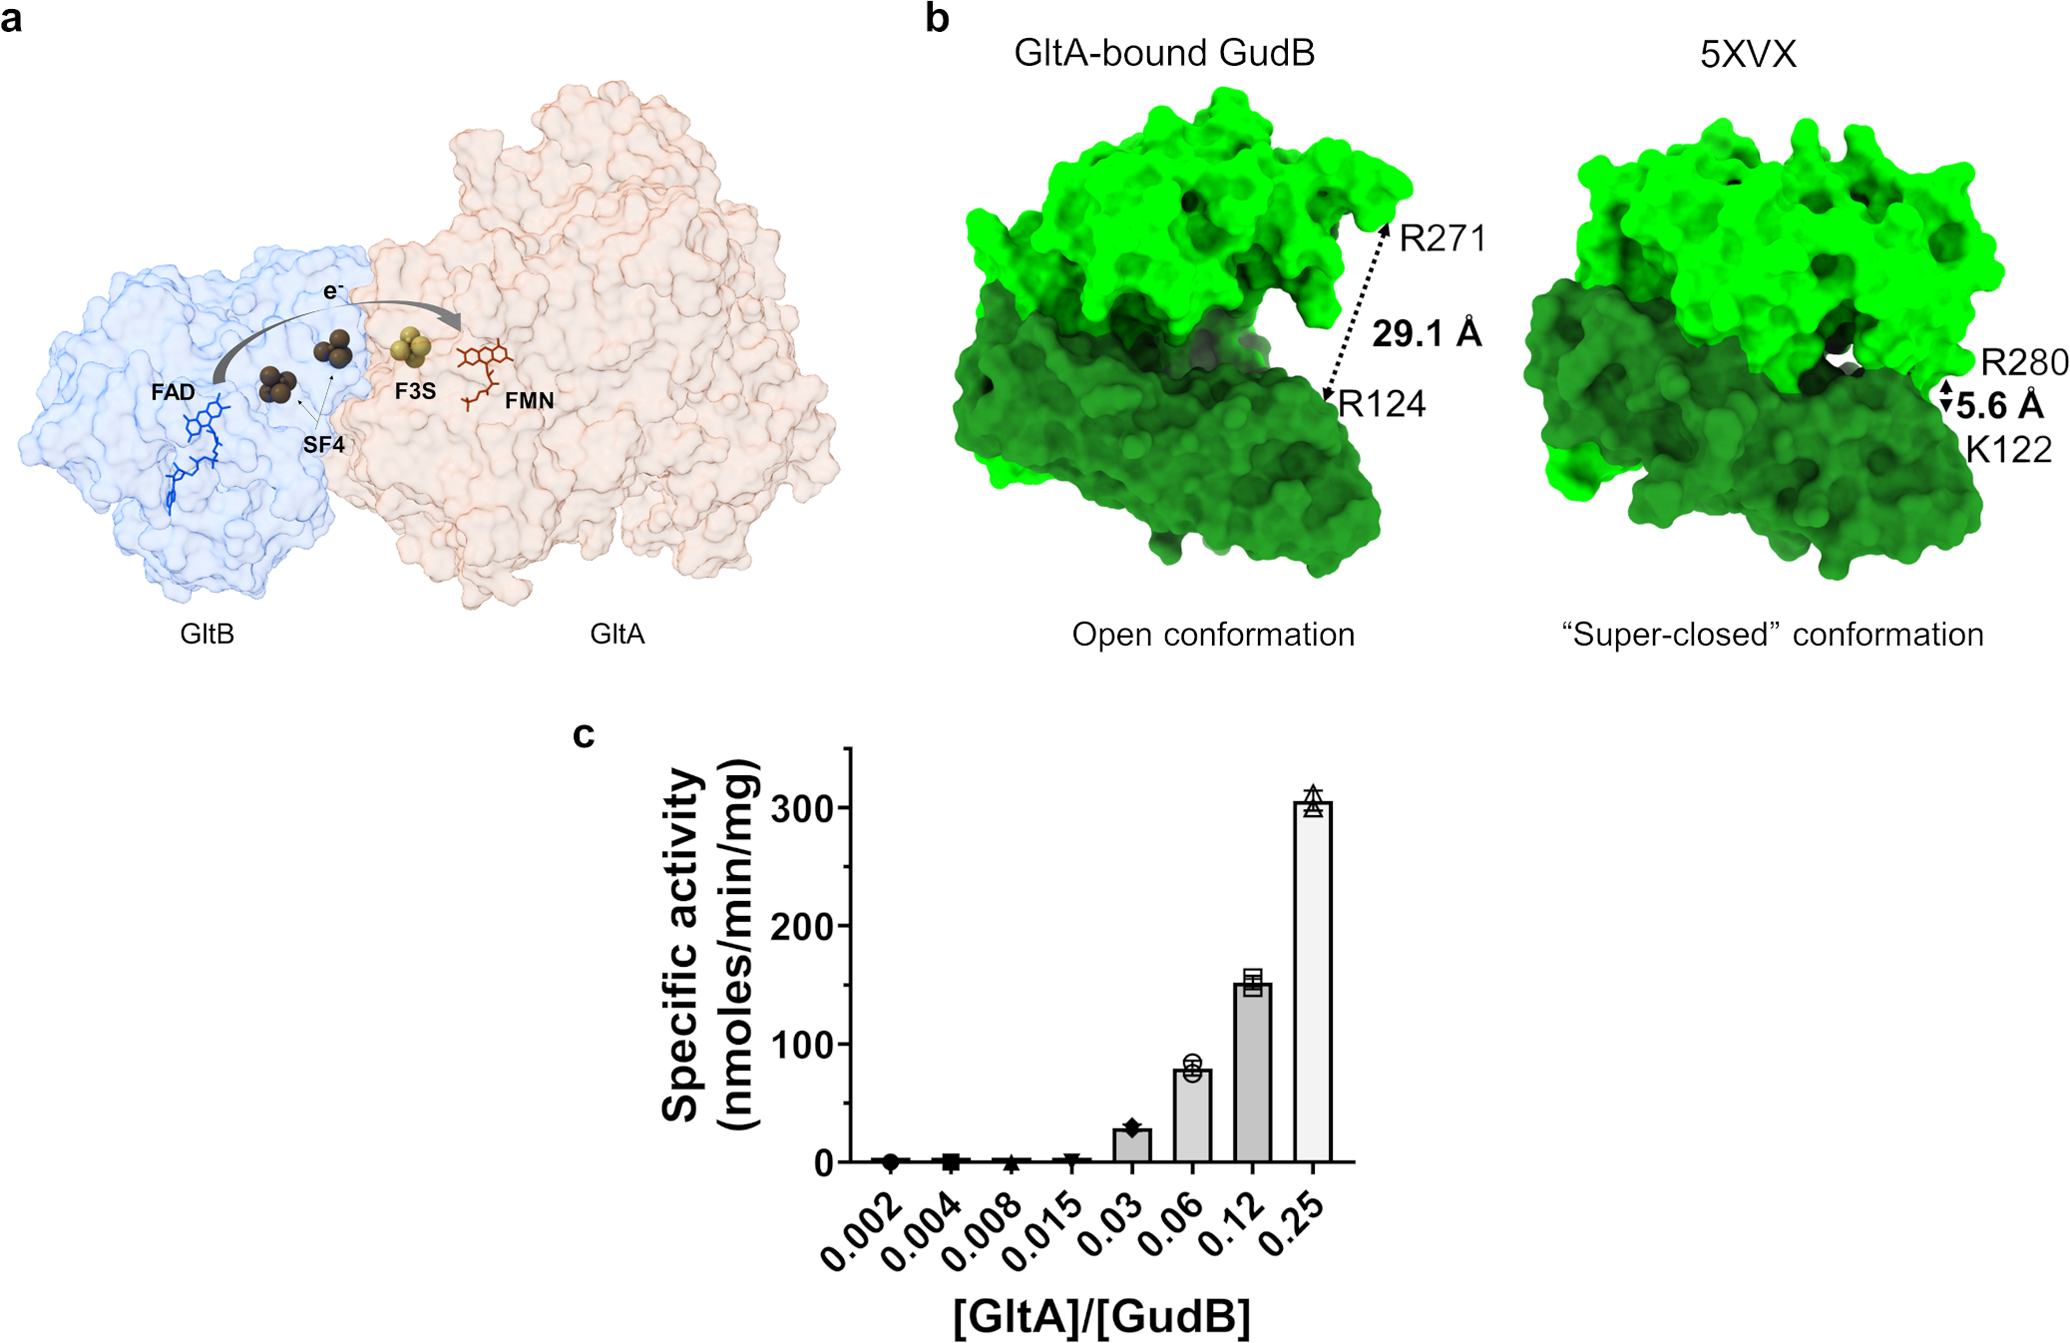
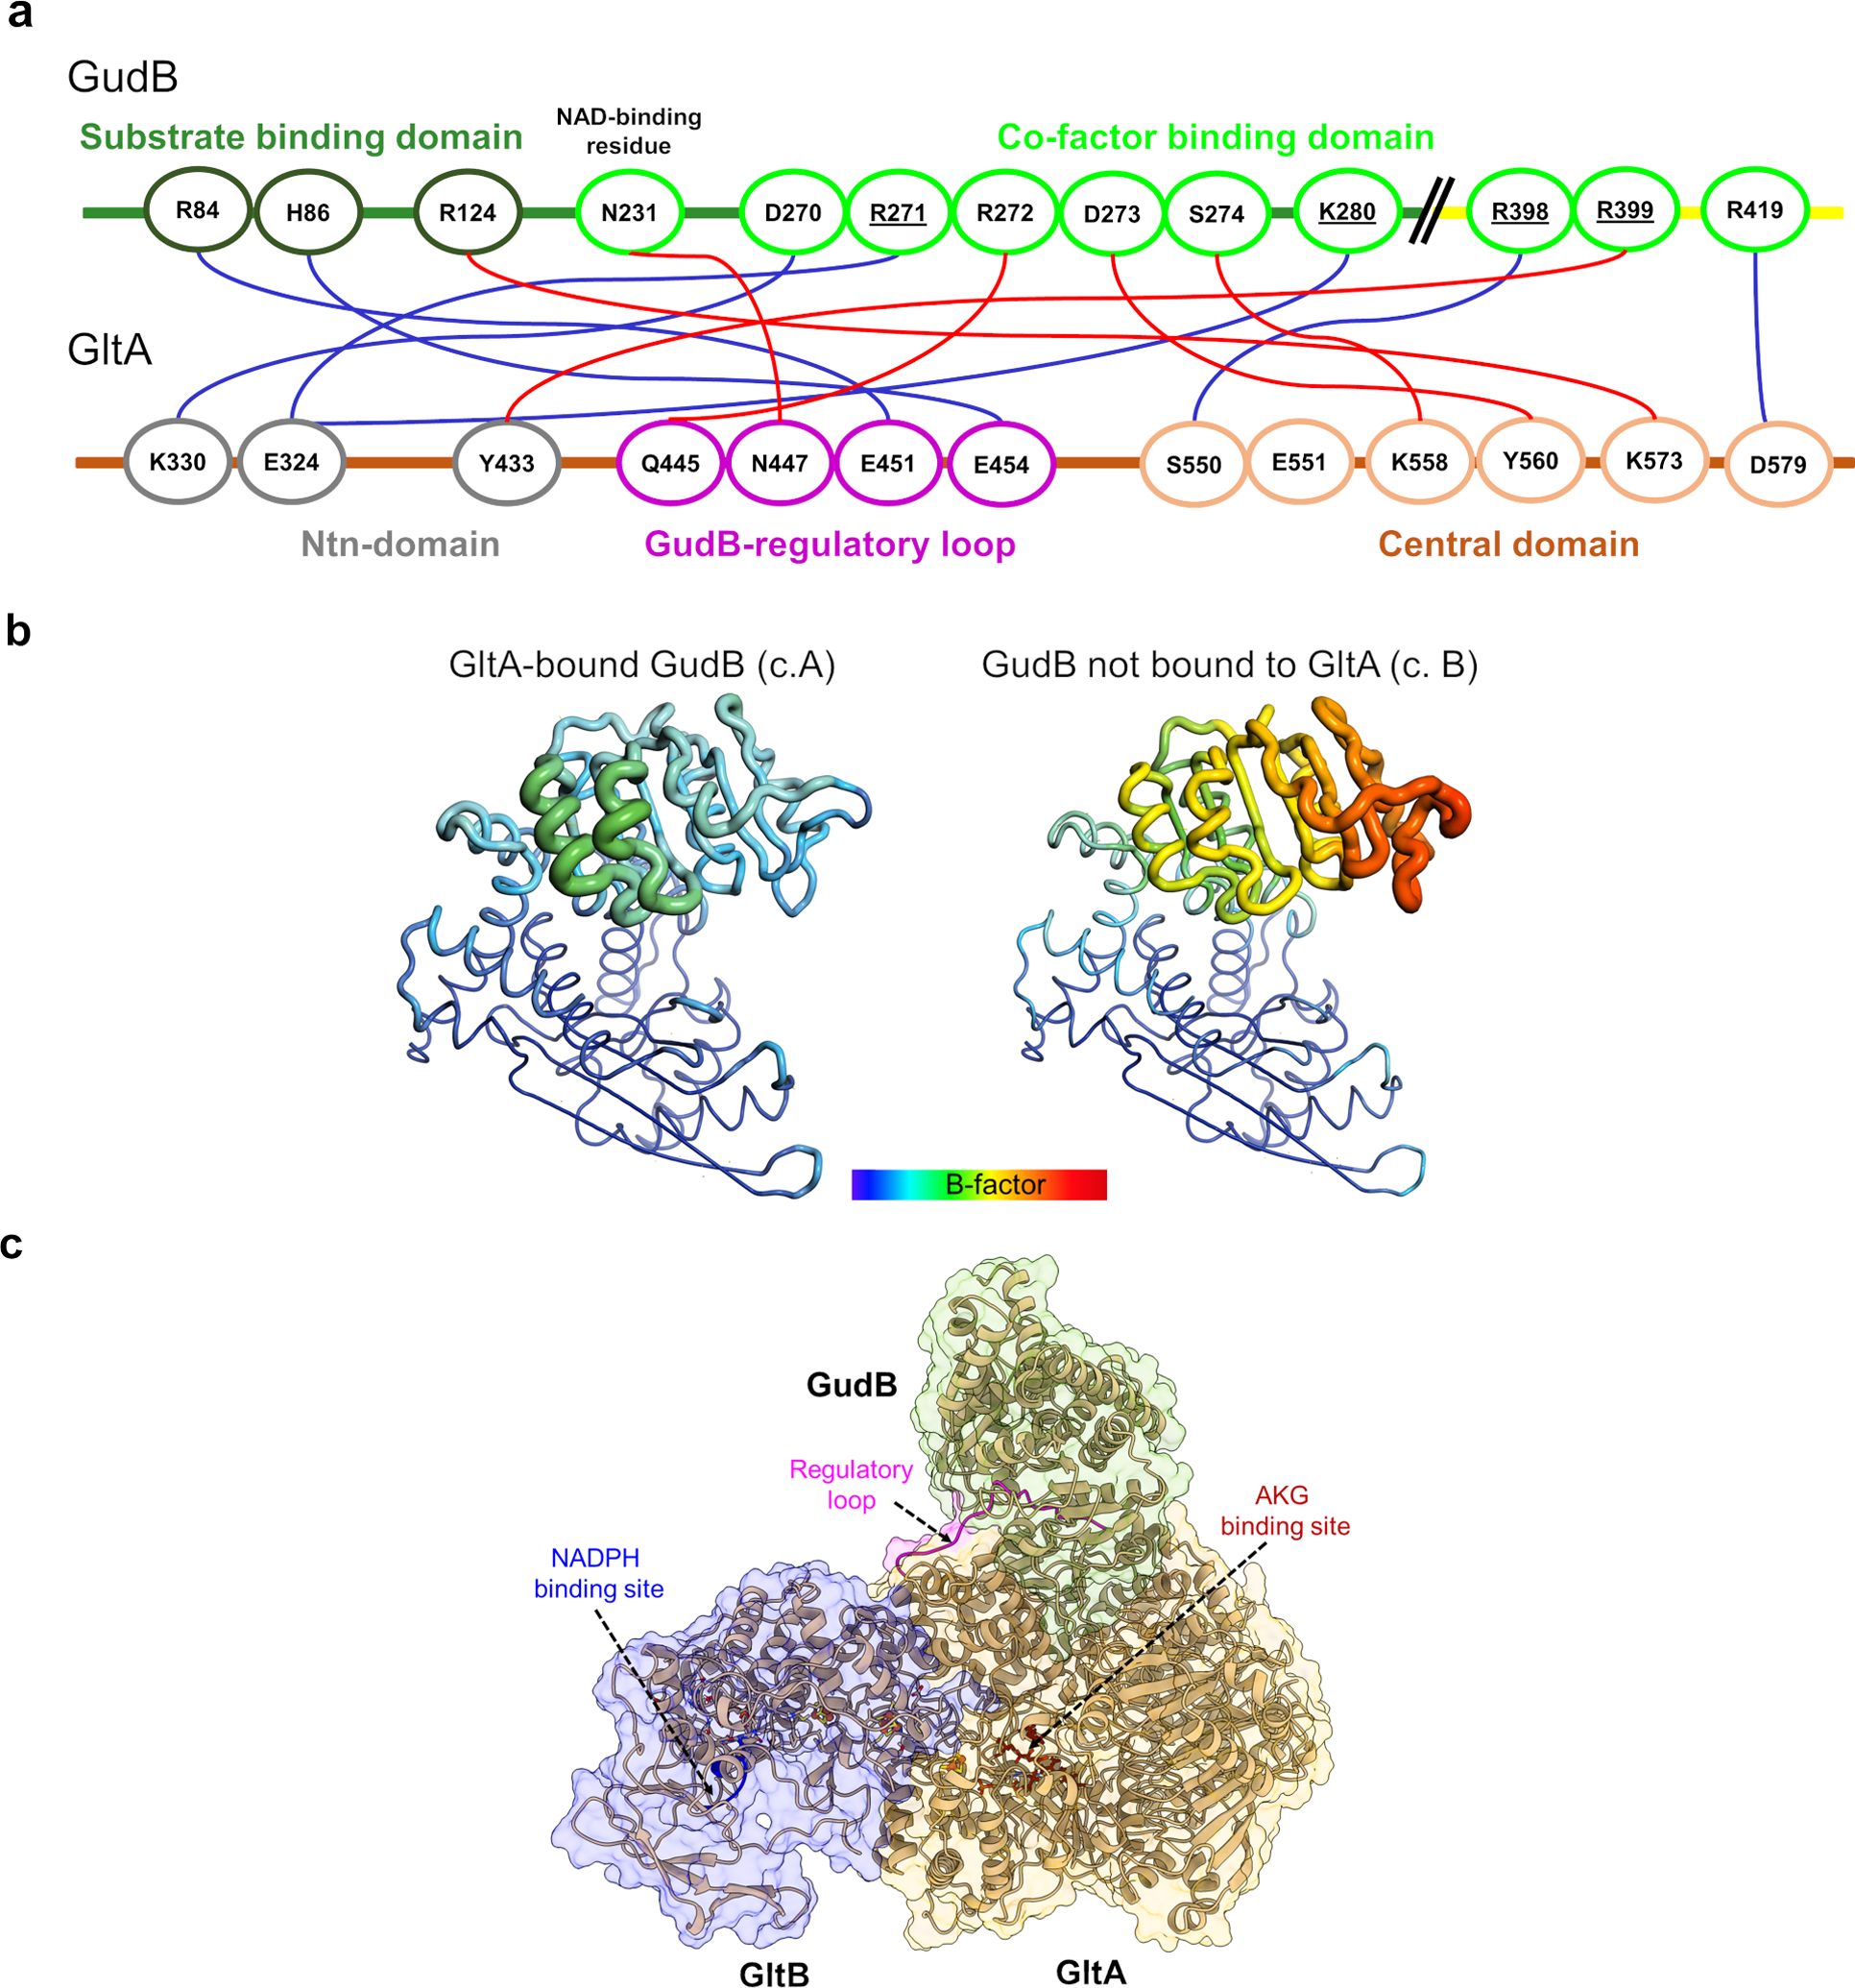
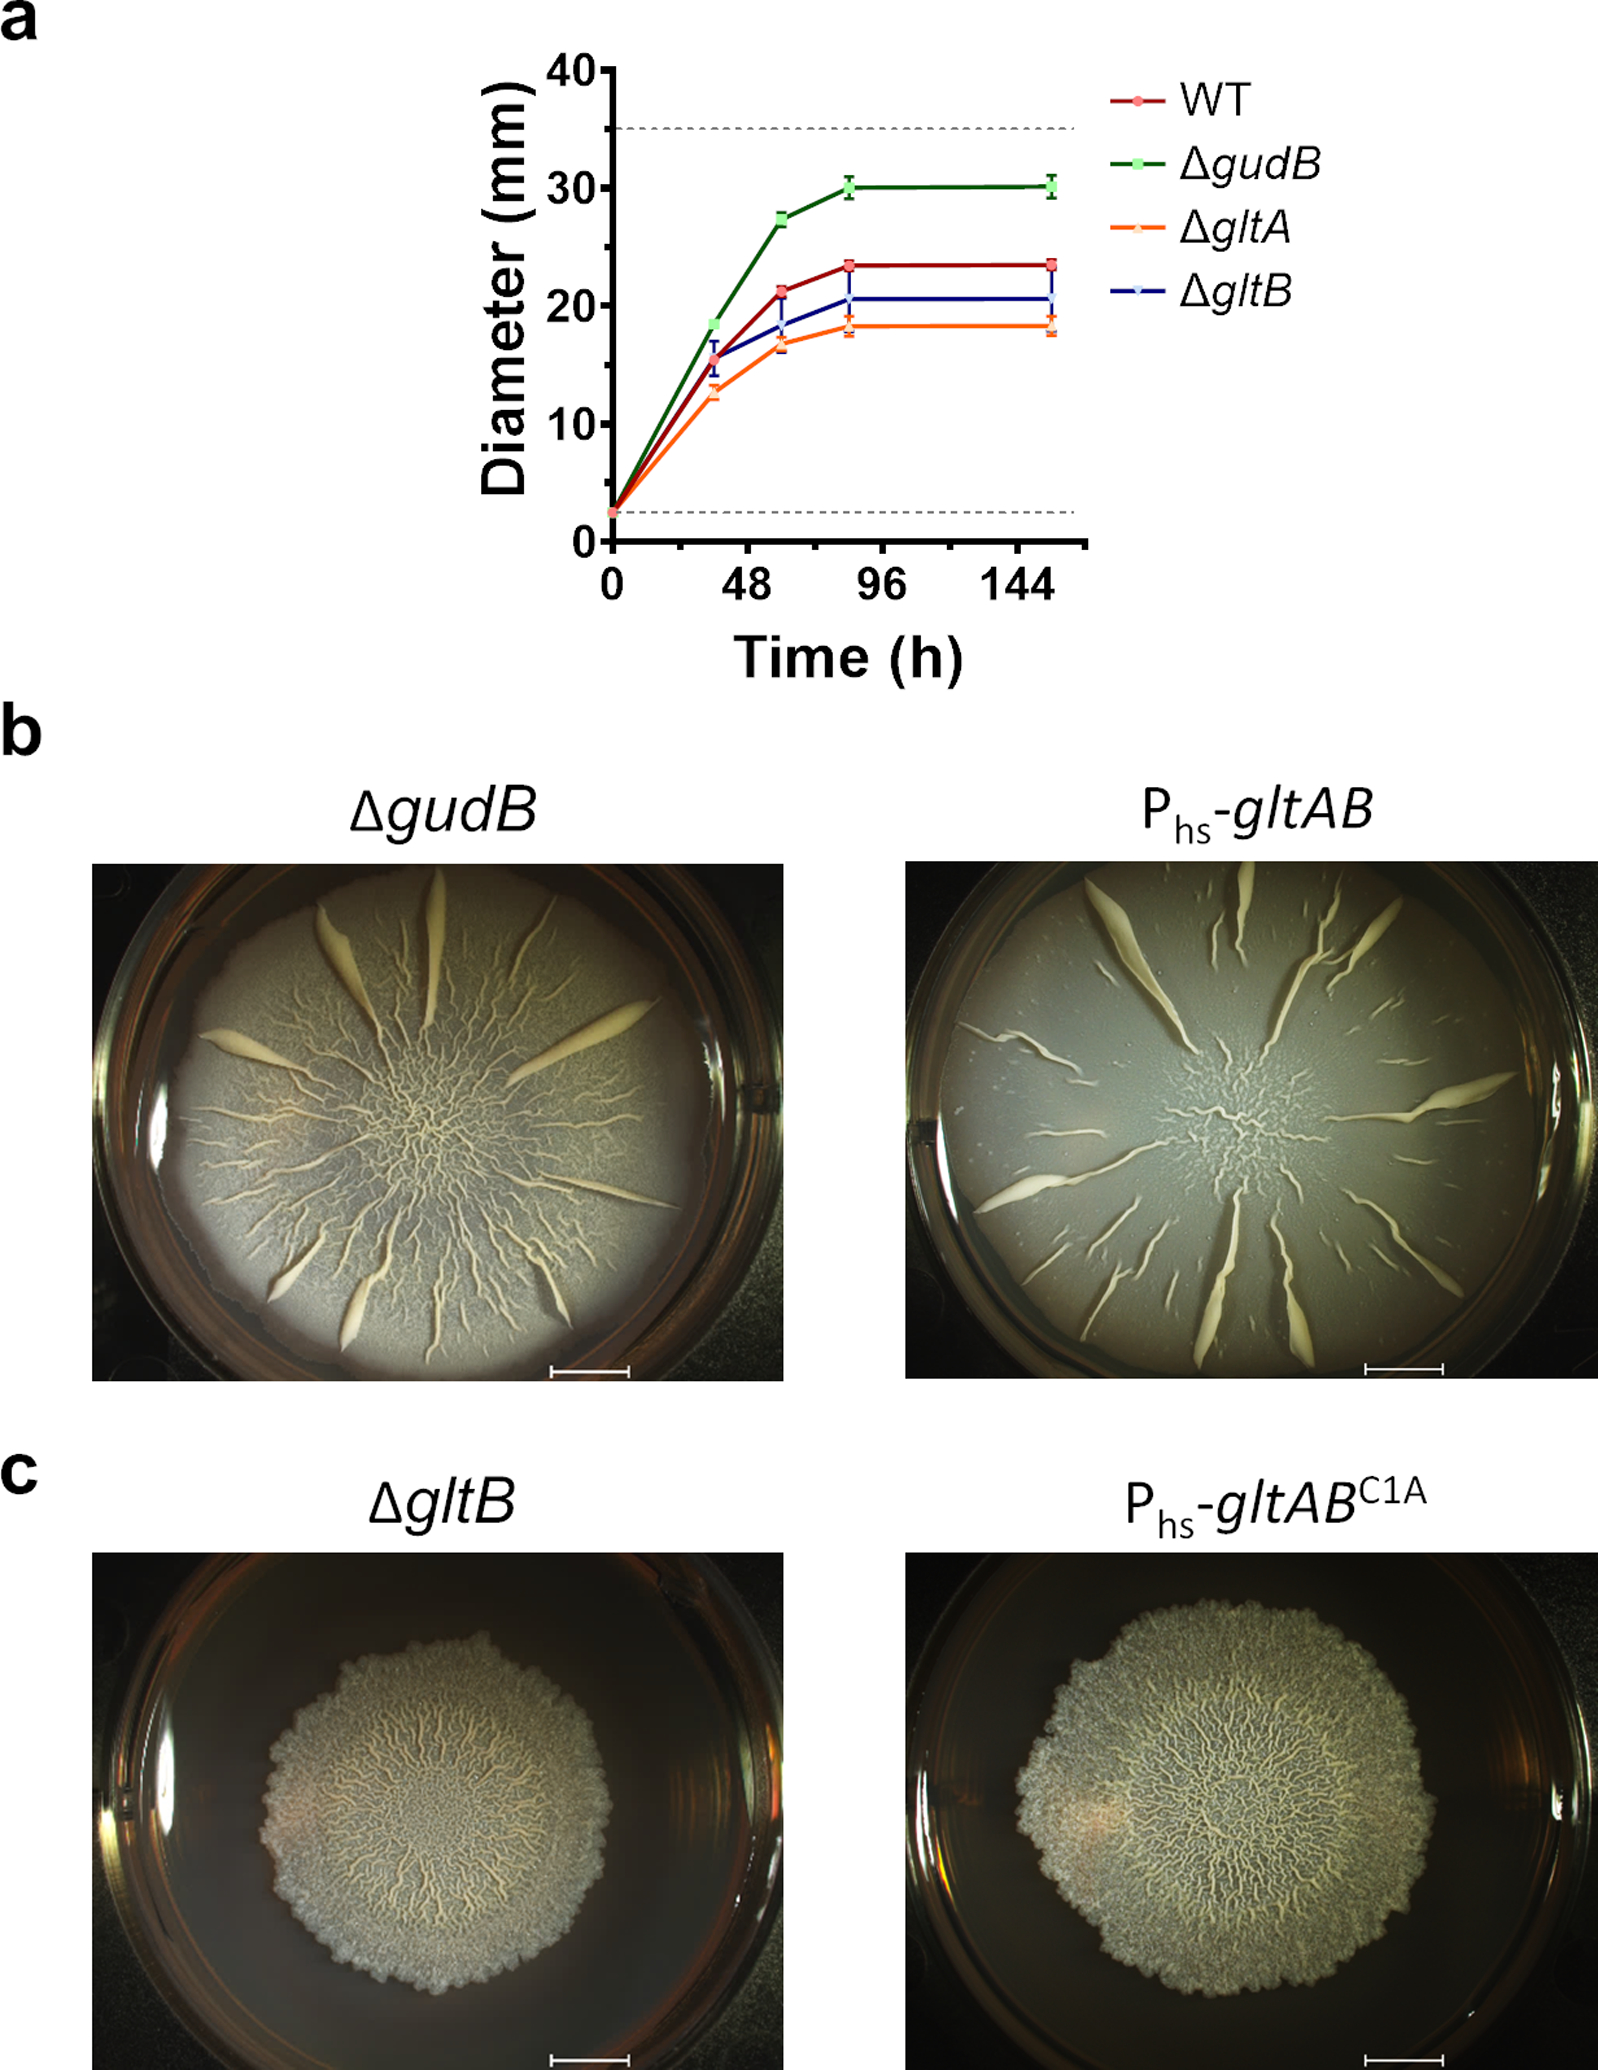
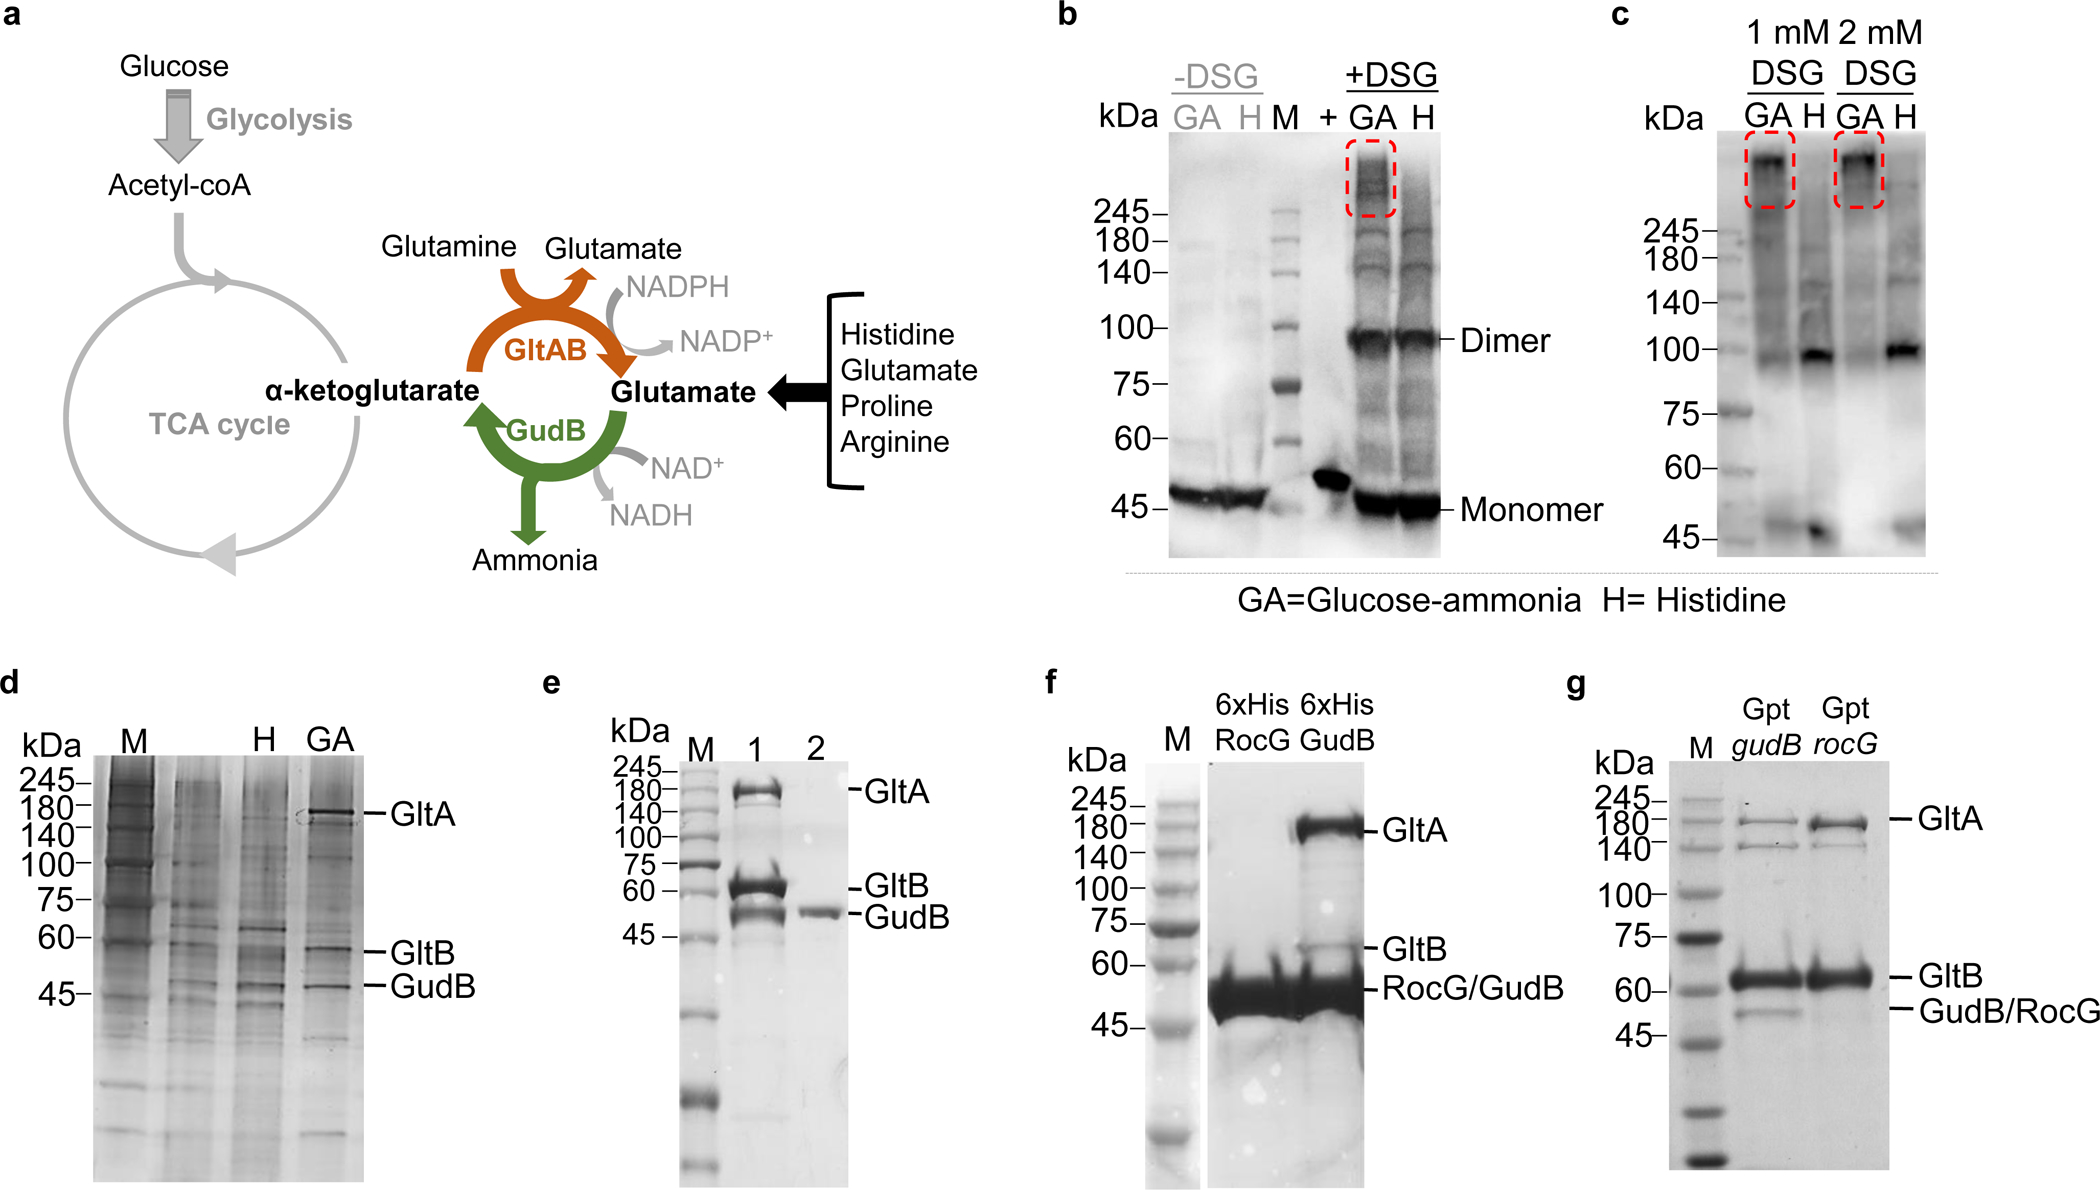
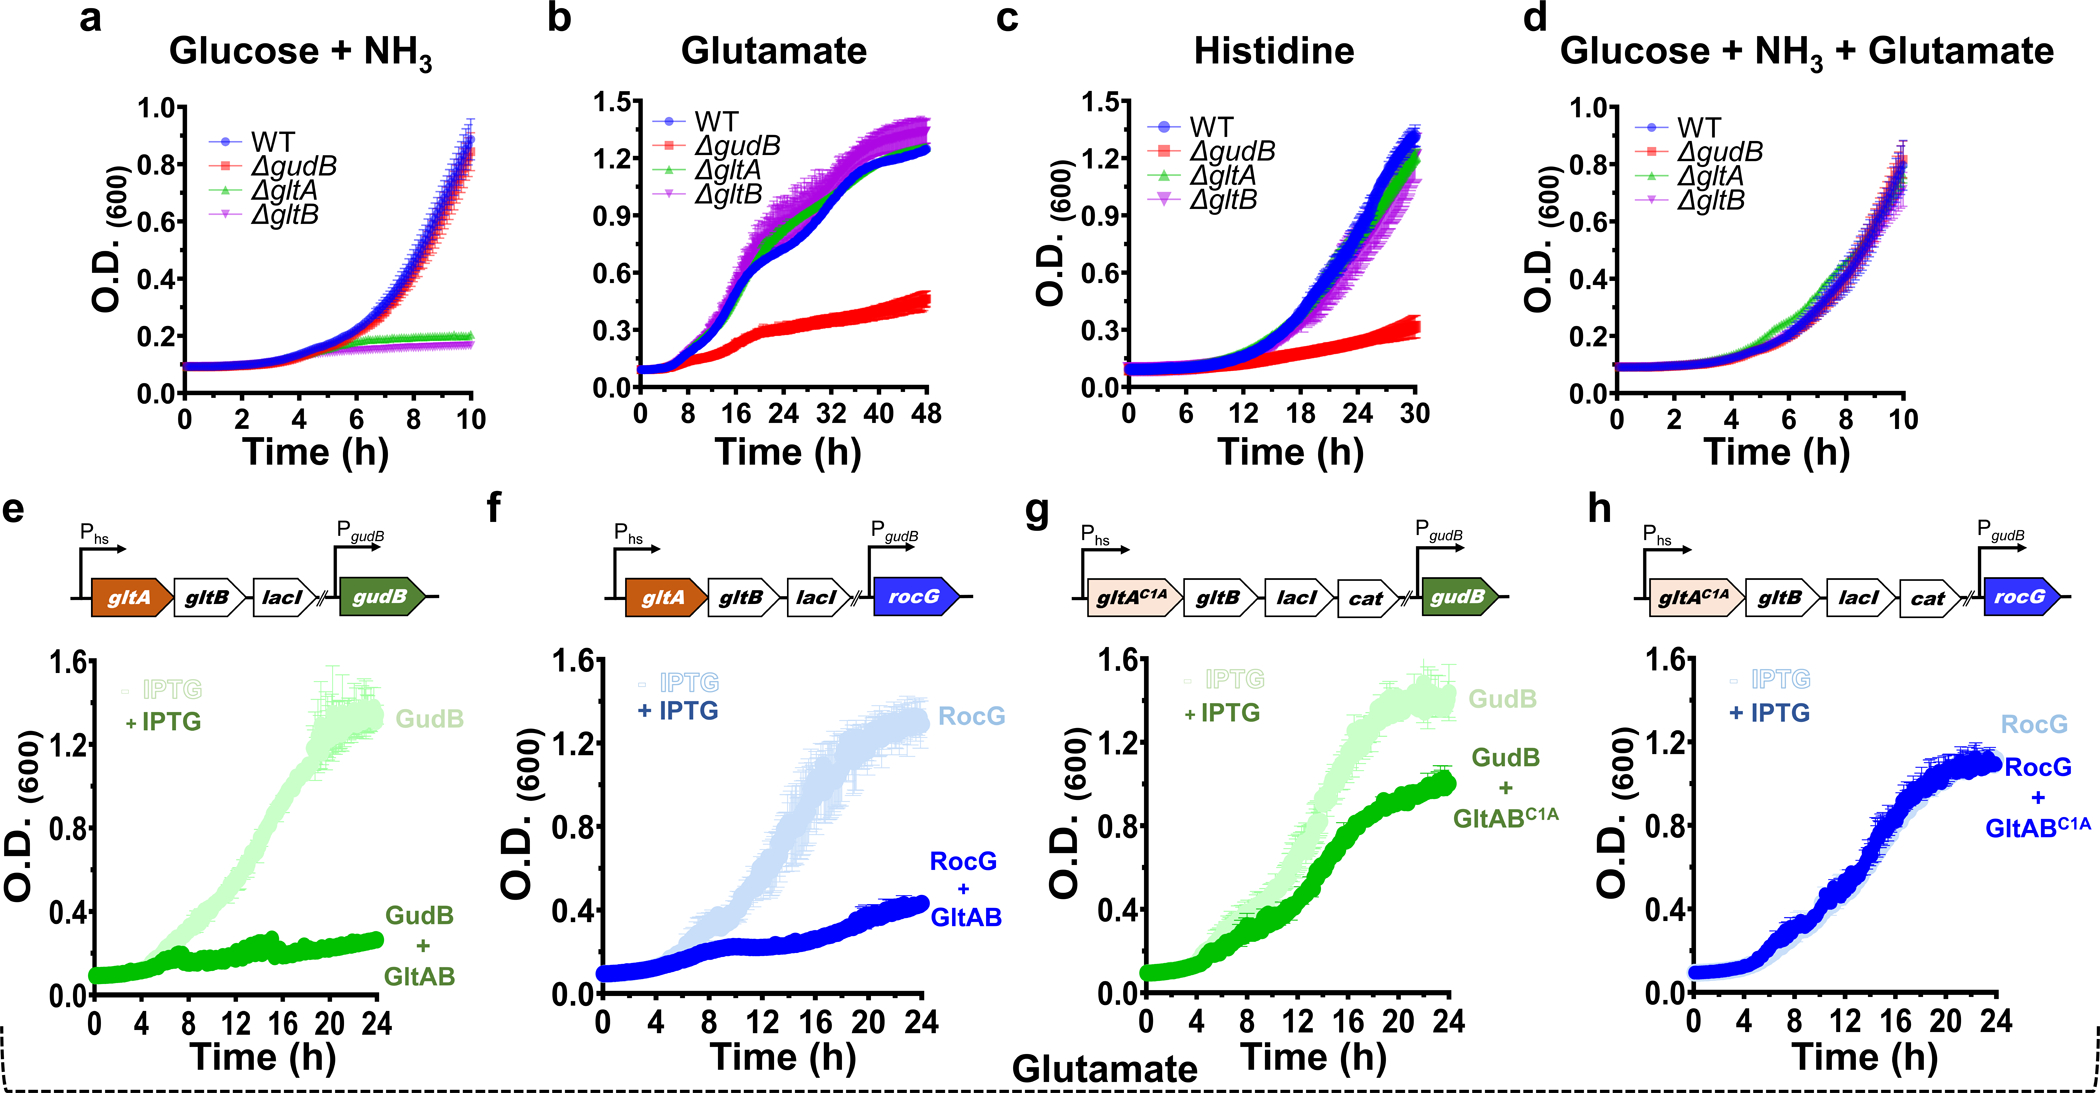
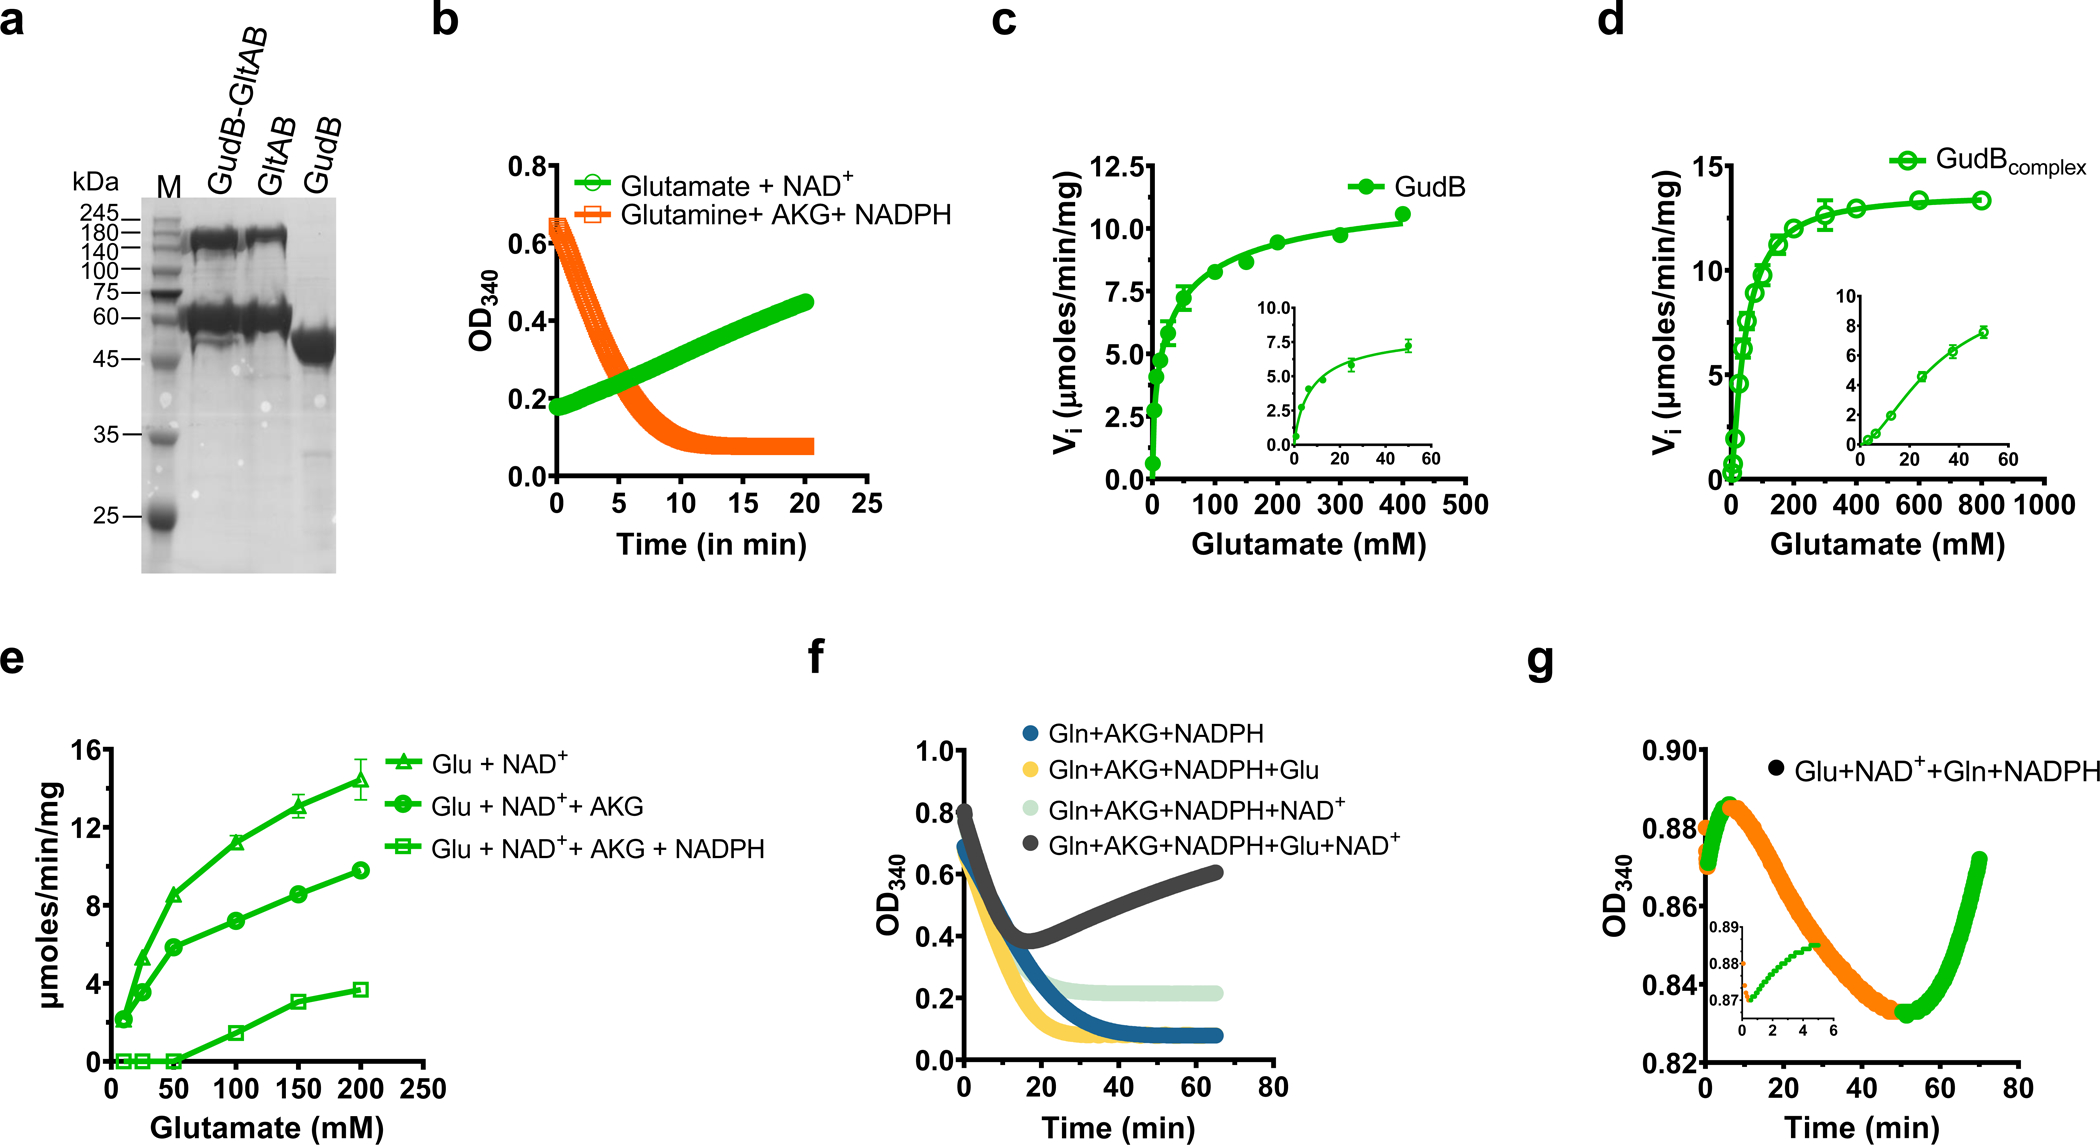
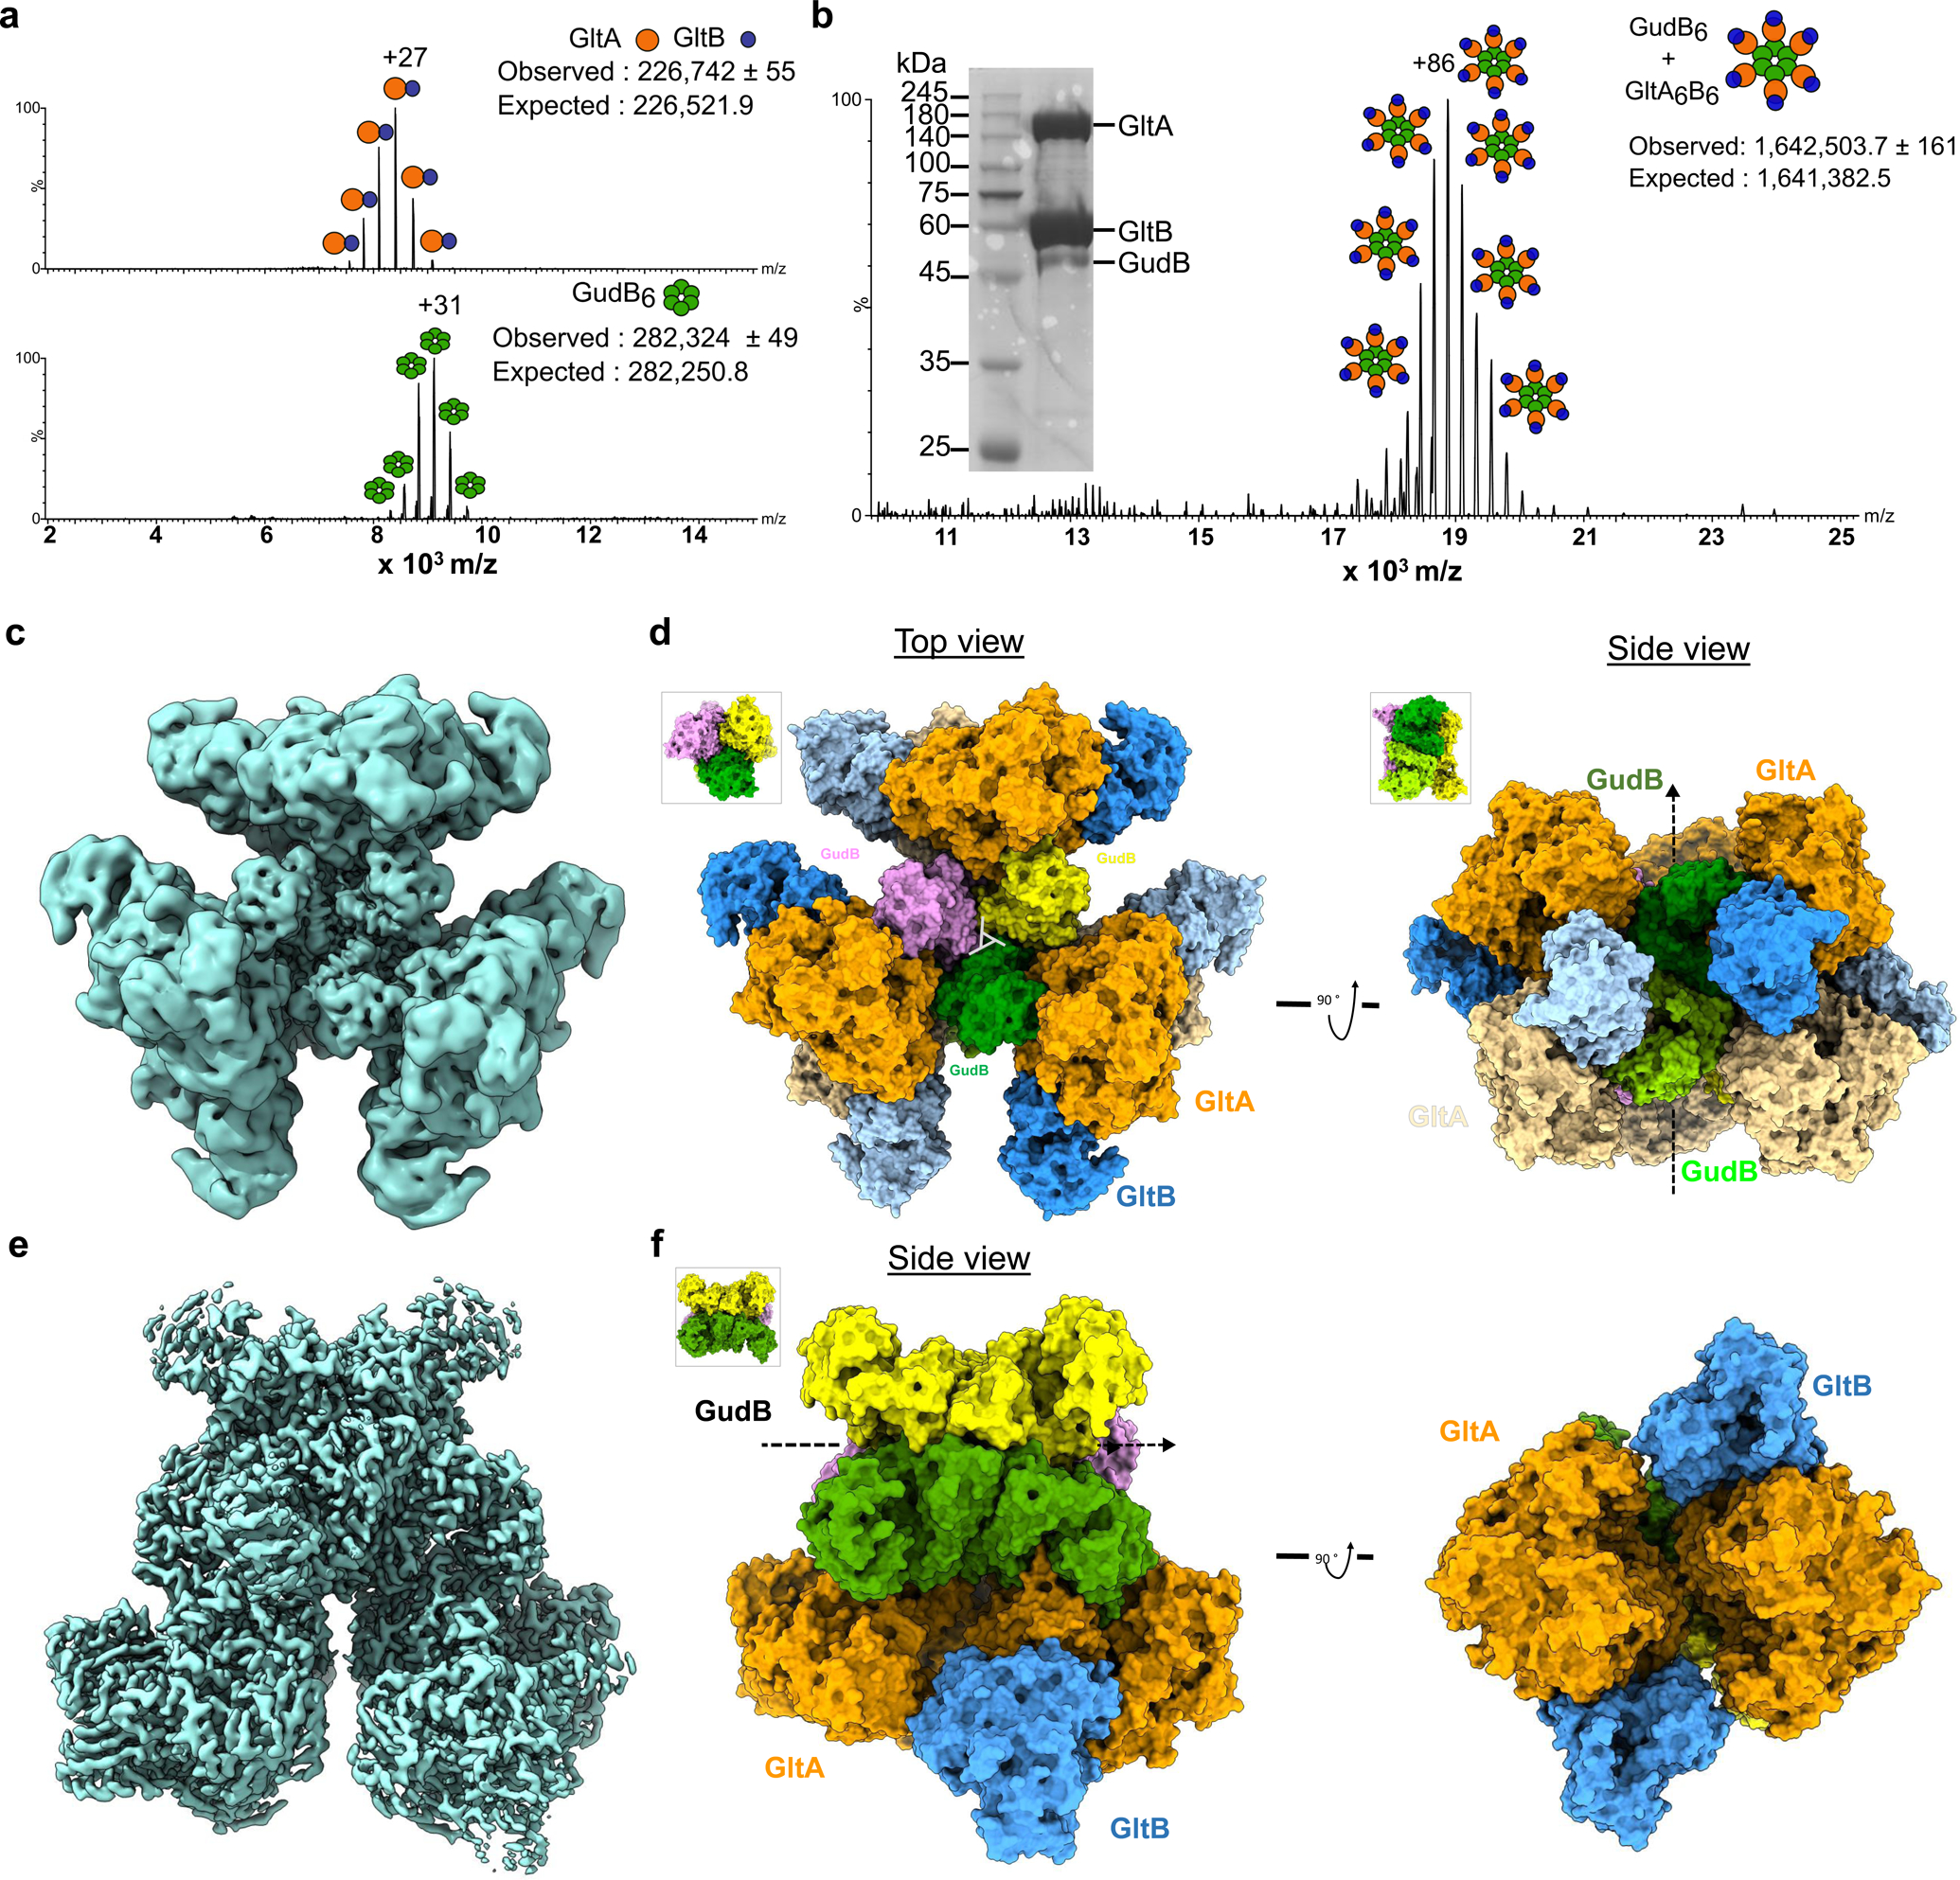
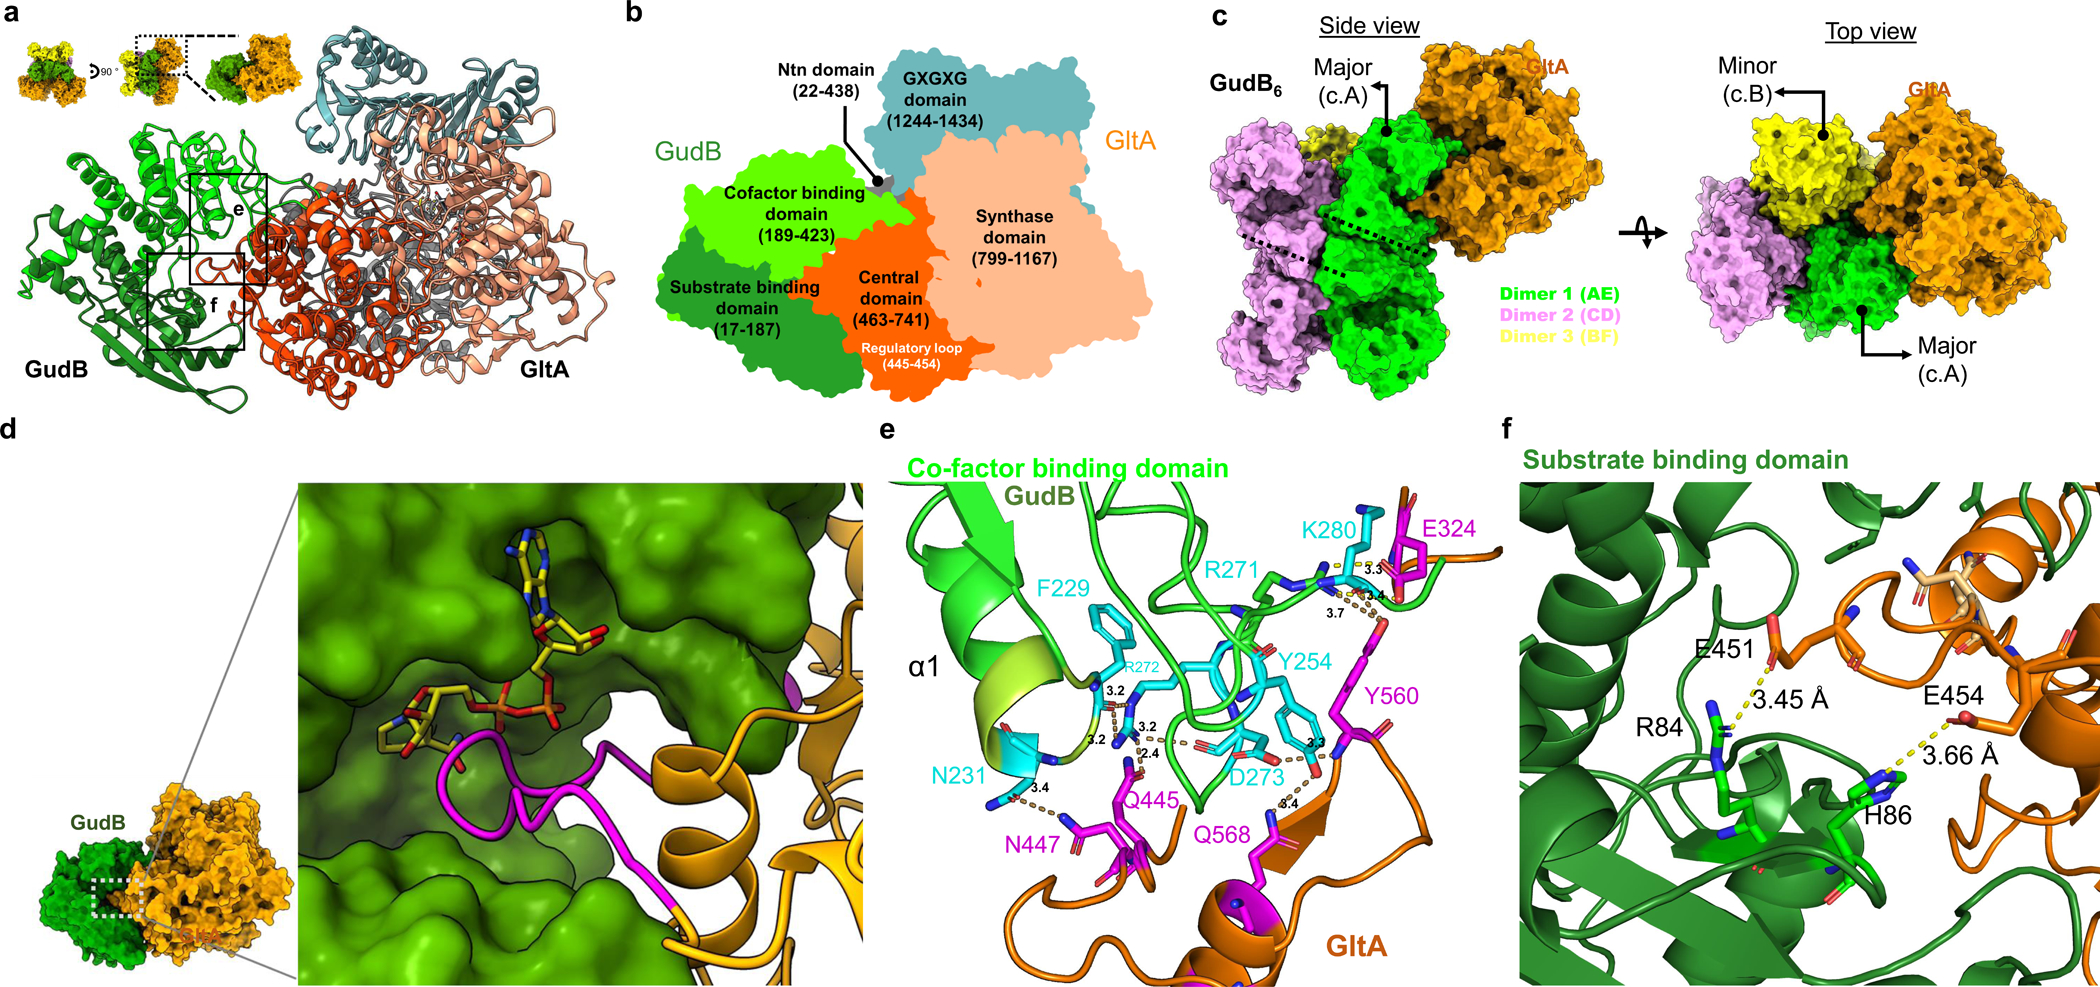
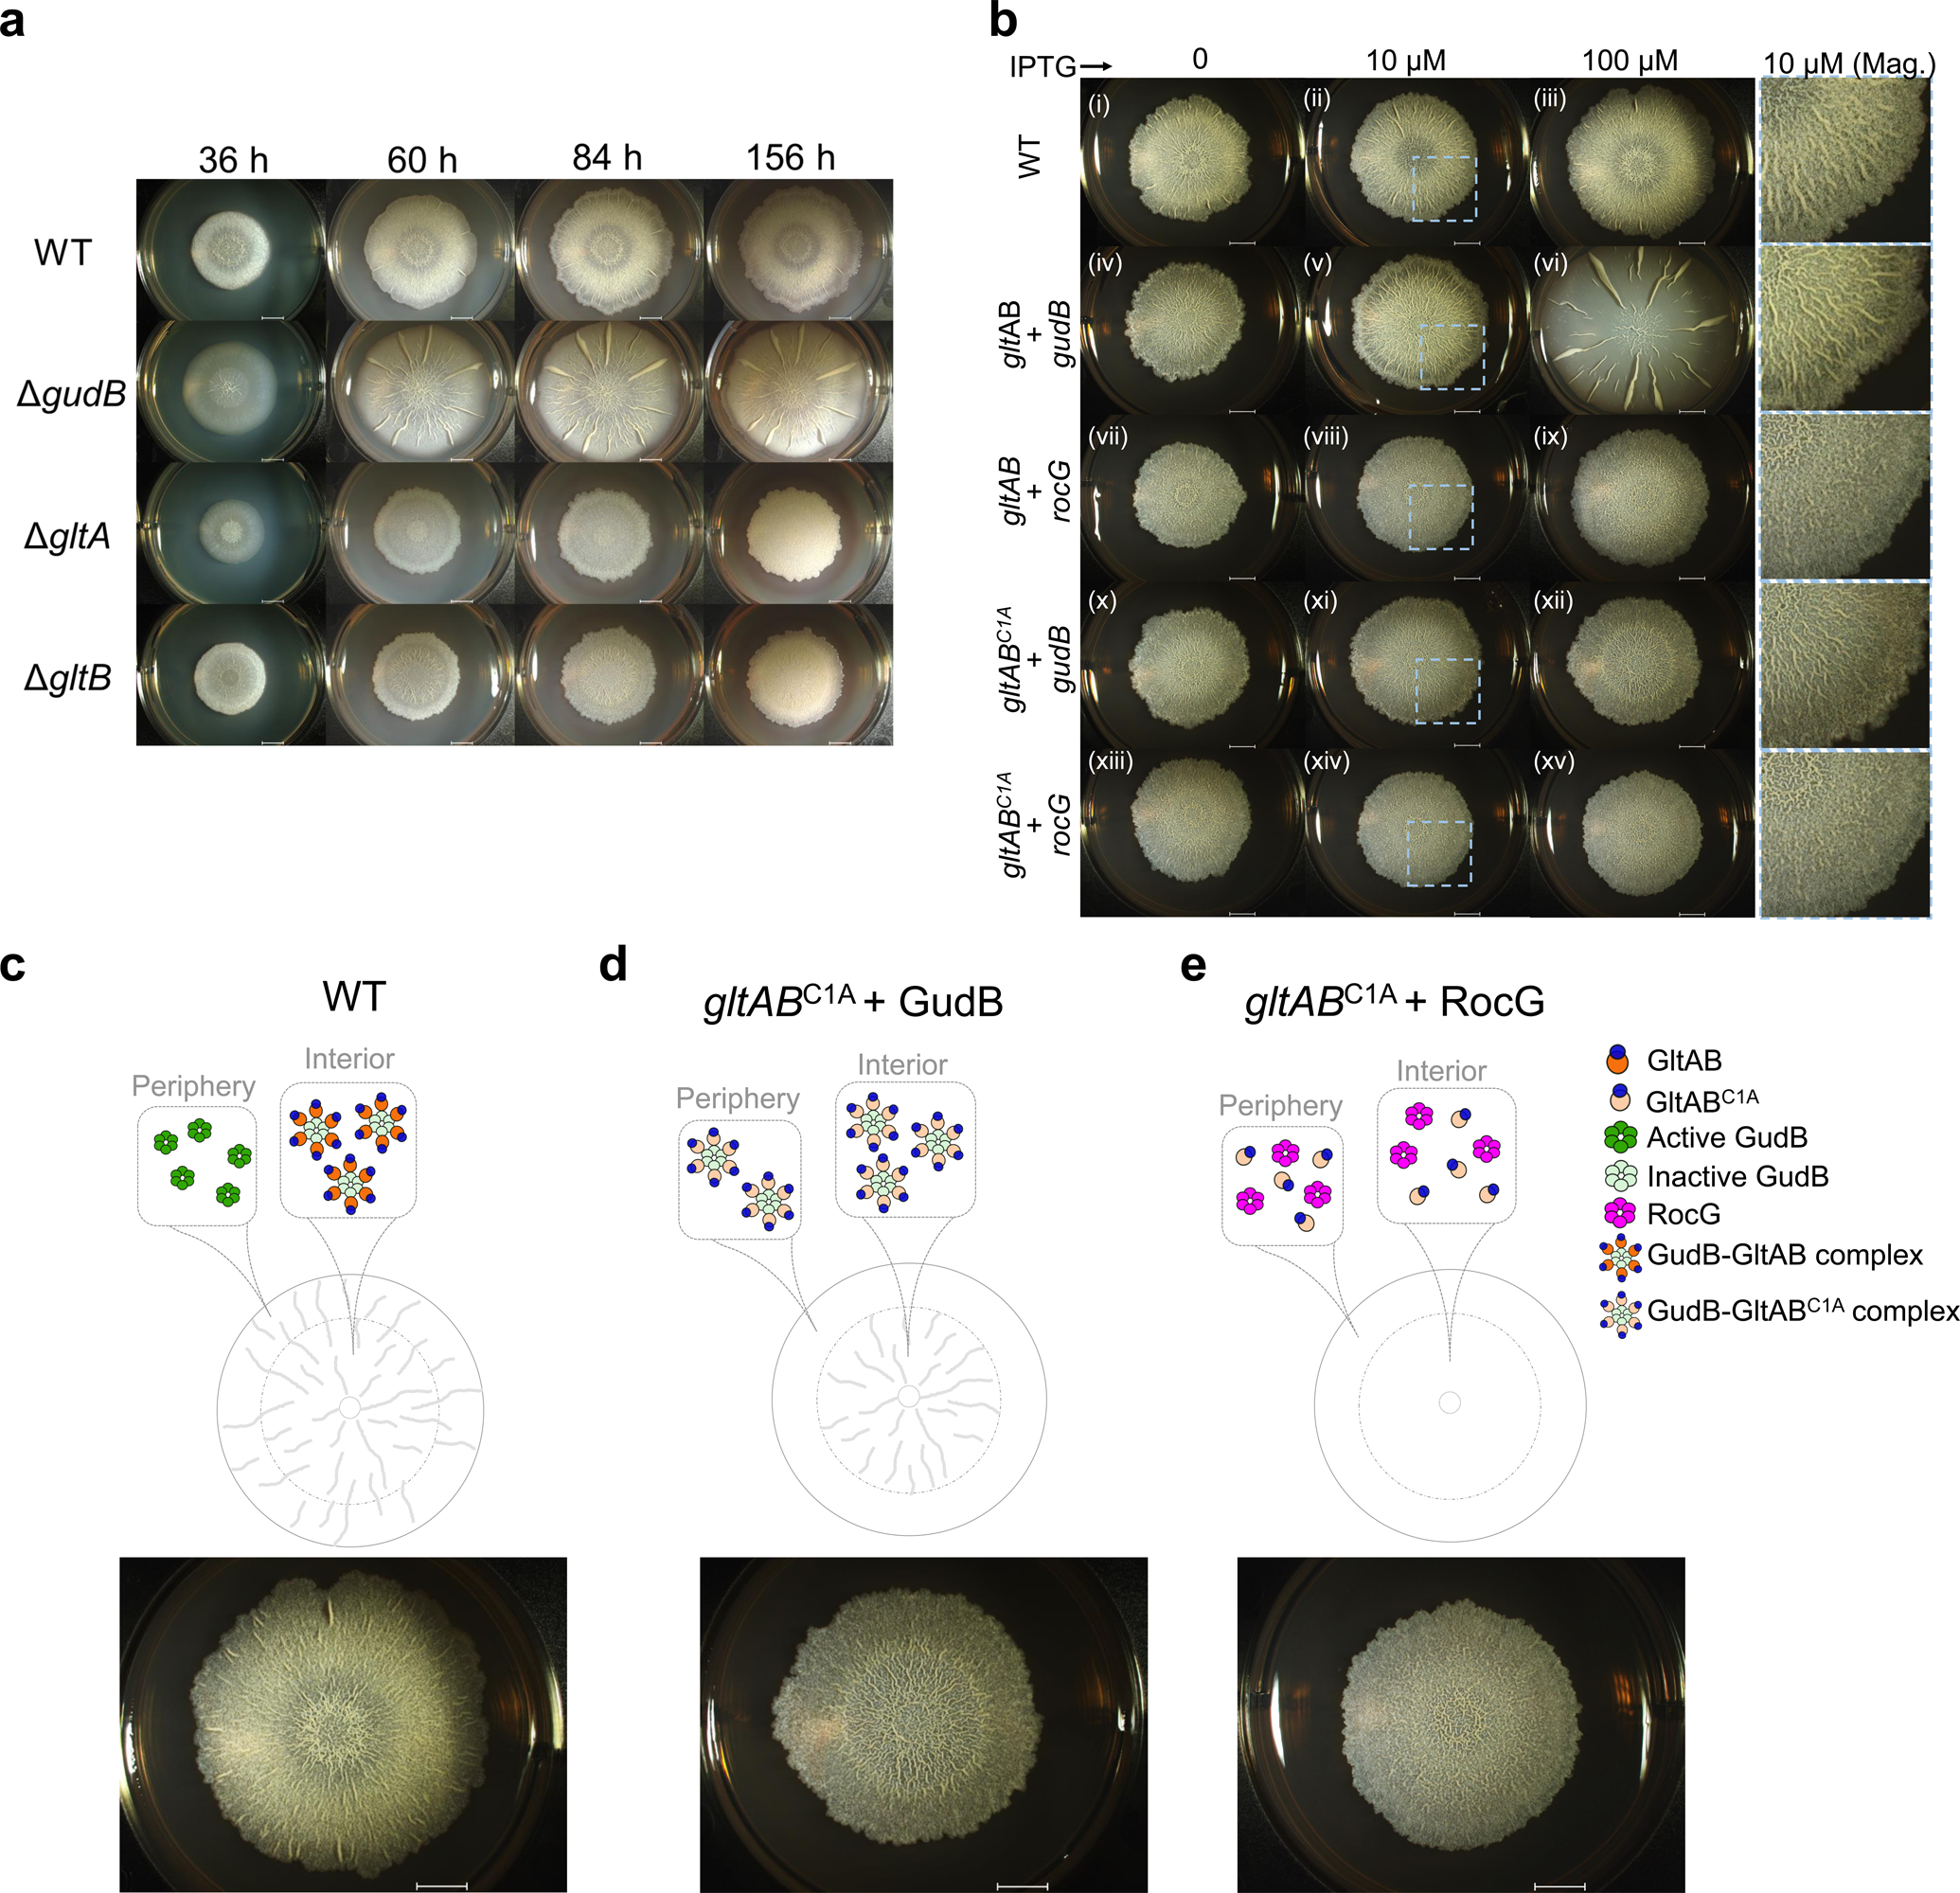
Multi-enzyme assemblies composed of metabolic enzymes catalyzing sequential reactions are being increasingly studied. Here, we report the discovery of a 1.6 megadalton multi-enzyme complex from Bacillus subtilis composed of two enzymes catalyzing opposite ('counter-enzymes') rather than sequential reactions: glutamate synthase (GltAB) and glutamate dehydrogenase (GudB), which make and break glutamate, respectively. In vivo and in vitro studies show that the primary role of complex formation is to inhibit the activity of GudB. Using cryo-electron microscopy, we elucidated the structure of the complex and the molecular basis of inhibition of GudB by GltAB. The complex exhibits unusual oscillatory progress curves and is necessary for both planktonic growth, in glutamate-limiting conditions, and for biofilm growth, in glutamate-rich media. The regulation of a key metabolic enzyme by complexing with its counter enzyme may thus enable cell growth under fluctuating glutamate concentrations.


Conflict of interest statement

Declaration of Interests:

The authors declare no conflict of interests

Figures

Extended Data Fig. 1
Extended Data Fig. 1. GudB interacts with GltAB
(a) Western blot analysis using an anti-GudB antibody on lysates prepared from DSG treated B. subtilis cells grown on different C/N source. The high molecular weight species of GudB are seen only in cells grown in glucose-ammonia. (b) Western blot analysis using a Strep-Tactin-HRP antibody on the same samples used in A. Here the antibody was used on lysates prepared from both DSG-treated (lanes right to the molecular weight marker) and untreated cells (lanes left to the marker). As, can been seen, GltB is expressed only in cells grown on glucose-ammonia, and under this condition, it is also part of a high-MW complex (in the DSG treated sample) (Figure 1b). (c) Enzyme kinetics of wild-type GltAB (orange) and its mutant GltABC1A (light orange), show that the mutant is completely inactive. A minor decrease in absorbance with mutant GltA is due to non-enzymatic oxidation of NADPH. The reaction mixture consisted of 2 mM AKG, 5 mM glutamine, 200 μM NADPH, 5 mM DTT, 5 mM MgSO4. The reaction was initiated with 2.5 μg of the wild-type or mutant enzyme. (d) SDS-PAGE of the eluate from Strep-Tactin column to which lysate from B. subtilis strain expressing GltABC1A in the background of constitutively expressed GudB or RocG is applied. Co-elution of GudB along with the inactive GltA (GltABC1A) upon pulldown of Strep-GltB (PgudB-gudB lane), while GltABC1A elutes on its own when expressed with RocG (PgudB-rocG lane). Images in a-d are obtained from a single experiment and are a representative of at least 2 independent experiments.
Extended Data Fig. 2
Extended Data Fig. 2. Phenotyping of Phs-gltAB strain
The strain expresses GltAB from the IPTG- inducible hyperspank (Phs) promoter. Without IPTG, the strain cannot grow in minimal medium containing glucose-ammonia as the C/N source (light orange); however, addition of 500 μM IPTG restores growth to almost wild-type levels (orange). Addition of IPTG does not have any effect on the growth of the parental wild-type strain. n=3 are three independent measurements. Data is presented as mean of all measurements and error bars represent SD.
Extended Data Fig. 3
Extended Data Fig. 3. Steady-state kinetics of GltAB, and GudB-GltAB complex.
(a-f) Substrate titration plots for the glutamate synthase activity of GltAB by itself (A-C) and in the GudB bound form (D-F). One of the substrates was titrated while keeping the rest saturating: glutamine (5 mM), AKG (α-ketoglutarate, 2 mM), NADPH (200 μM). n=2 are two independent experiments. Data is presented as mean and error bars indicate SD. (g) AKG and NADPH promote the assembly of GltA and GltB. Only 5 % of the counts corresponded to GltAB when no ligands were added (left panel). Addition of AKG increase the GltAB count to 12 % (Middle panel) and the presence of NADPH in addition to AKG increased the GltAB counts to 16 % (right panel). (h-l) Non-hyperbolic progress curves displayed by GudB-GltAB complex in the presence of all the substrates except AKG. While at high glutamate concentrations GudB’s activity dominates (K), at low glutamate concentration the synthase activity takes over (G). At intermediate concentration of glutamate (H- J) the progress curve oscillates between GudB- and GltAB-predominant phases. (m) Progress curves obtained using different amount of the GudB-GltAB complex at 37.5 mM glutamate (where oscillations are most pronounced; panel i). The reaction mixture contained all substrates for GudB and GltAB except AKG. (n) Plotted are the slopes derived from phase 2 of the progress curves (GudB’s activity as shown in the inset) as a function of the complex concentration. The non-linear relationship suggest that association-dissociation of the complex plays a role in turning off-on GudB’s activity. Note also the elapsed time for phase 2 (the 2nd GudB activity phase) that becomes longer as the complex concentration decreases. The inset shows the phase 3 in each of the individual progress curves. (o) Unlike phase 2, phase 3 that corresponds to GltAB’s activity shows linear dependence with enzyme concentration. The inset shows phase 3 in each of the individual progress curves. Data in panels g-o are from single experiment and are representative of at least 2 independent experiments.
Extended Data Fig. 4
Extended Data Fig. 4. Cyro-EM image processing for GudB6-GltA6B6
(a) Scheme for single particle cryo-EM analysis of the GudB6-GltA6B6. Details of the process are described in the Methods section. Briefly, particles were iteratively picked from selected micrographs using well resolved 2D class averages, followed by Ab initio 3D reconstruction and classification into five classes. The best resolved 3D class was refined with D3 symmetry imposed. In order to account for deviations from D3 symmetry, further refinement focused on single GudB-GltAB asymmetric units. The number of particles that are included in the maps are indicated, along with the estimated resolution where relevant. (b) FSC curves for the refined GudB-GltAB asymmetric map. (c) Angular distribution plot. (d) 3D map colored according to local resolution estimate.
Extended Data Fig. 5
Extended Data Fig. 5. Native-MS and the corresponding particle types observed in cryo-EM of the GudB enriched preparation of the GudB-GltAB complex
(a) Native-MS spectra showing different species of GudB-GltAB complex. These species primarily differ in the number of GltAB heterodimers attached to the GudB hexamer (from 3–6). Charge states (z) and the difference from theoretical mass (ΔT) is indicated for each species. While the mass of the fully assembled complex agreed well with the expected mass, high ΔT values of the other species could be because of degradation of some of the component proteins during the extended incubation step with E. coli lysate (Methods section) during the purification process. The inset shows the SDS-PAGE of GudB-GltAB complex used for the native-MS. The sample was prepared after enriching the B. subtilis lysate with recombinant GudB expressed and purified from E. coli (see Protein expression and purification, Methods). The image is from a single experiment and is a representative of at least two independent experiments. This sample contained a higher fraction of GudB and was also used for cryo-EM to obtain the high-resolution structure of GudB6-GltA2B2 complex (Figure 5). (b) Preliminary cryo-EM maps corresponding to different particle types (GudB6-GltA2–4B2–4) observed. The key difference between particles is the number of GltAB subunits - the least being two (grey) and the maximum four (violet).
Extended Data Fig. 6
Extended Data Fig. 6. Single particle cryo-EM analysis of the GudB6-GltA2B2.
(a) The particles were iteratively picked from selected micrographs and classified. All non-ice particles were carried forward and subjected to a two-class 3D auto refinement in cisTEM using the preliminary GudB6-GltA2B2 reference. This yielded one noise class carrying unaligned particles and high frequency noise, and one class representing clear density for the GudB6-GltA2B2 species. This class was refined using auto and manual methods in cisTEM, with C2 symmetry applied. The number of particles and the estimated resolution are indicated. (b) FSC curves for the refined GudB6-GltA2B2 map. (c) Angular distribution plot and local resolution estimation (Relion3.1.2).
Extended Data Fig. 7
Extended Data Fig. 7. Effect of GltA binding on GudB
(a) The co-factors in GltAB: FAD, two 4Fe-4S clusters (SF4), 3Fe-4S cluster (F3S) and FMN. These co-factors are involved in shuttling of electrons from NADPH to 2-iminoglutarate along shown arrow. GltA and GltB are shown in a transparent surface representation. (b) GltAB binding captures GudB in an “open” state with the distance of 29.1 Å between residues R280 (in the co-factor binding domain, shown in light green) and K122 (in the substrate binding domain, shown in green). These residues are equivalent to R271 and R124 in the model of a “super-closed” glutamate dehydrogenase (PDB 5XVX) (right panel). (c) GltAB in sub-stoichiometric amounts promotes hexamerization of GudB by interacting with multiple GudB protomers (from different dimers, as shown in Figure 5c) and hence prevents loss of activity. The assay buffer contained 400 mM glutamate and 4 mM NAD+ and the reaction was initiated by the addition of an enzyme mix consisting of GudB pre-incubated with different amounts of GltAB (in all the reactions, GudB was present at a final concentration is 0.05 μM). GltAB prevents GudB inactivation in a concentration dependent manner. Individual data points are shown from two independent measurements and error bars indicate standard deviation of the mean.
Extended Data Fig. 8
Extended Data Fig. 8. Details of the GudB-GltAB interaction
(a) Key interactions between GltA (ovals on orange line) and two GudB protomers (ovals on green/major interaction and yellow line/minor interaction); salt bridges are shown in red and hydrogen bonds in blue. The border of ovals are coloured based on domain/structural feature to which the residue belongs (b) Binding to GltA stabilizes many loops in the cofactor binding domain of GudB. Shown are a GltA-bound GudB protomer (left, chain A in 7MFM) and a free GudB protomer in the same structure (right, chain B) in the “putty” representation as implemented in PyMol. The radius of the ribbon increases from low to high B-factor and the Cα B-factors are shown in dark blue (lowest B-factor, 54) to red (highest B-factor, 163). (c) Location of NADPH binding site (the GXGXXG motif of the Rossmann fold is shown in blue) in GltB and AKG binding site (T1041, K948, S870, R968 shown in maroon) in GltA, with respect to the regulatory loop (shown in magenta) in GltA. AKG and NADPH binding site is located about 45 Å and 75 Å from the regulatory loop of GltA.
Extended Data Fig. 9
Extended Data Fig. 9. Biofilm growth and disruption phenotypes
(a) Biofilm diameters measured at different time points. While ΔgudB biofilms were bigger in size and grew faster than wild-type biofilms, ΔgltA and ΔgltB biofilms were smaller. The dashed lines at 2.5 mm and 35 mm indicates the starting size of the biofilm, and the diameter of the well, used to grow the biofilm, respectively. The measurements were from four independent experiments (n=4). Data is shown as mean and error bars represent standard deviation. (b) Similarity in biofilm morphology between ΔgudB and the Phs-gltAB strains (grown with 100 μM IPTG). Overexpression of GltAB in the latter increases in synthase activity and also silences GudB, thereby resembling the ΔgudB biofilm morphology. Both biofilms grew rapidly and had large wrinkles spreading from the interior to the periphery of the biofilm. All the images in this panel are reproduced from Figure 6 for better representation of the biofilm morphology. (c) Similarity in biofilm morphology between ΔgltB and the Phs-gltABC1A strains (grown with 100 μM IPTG). In both the biofilms the wrinkles are restricted to the interior of the biofilm.
Figure 1.
Figure 1.. GudB interacts with GltAB in glutamate poor growth conditions.
a) Key reactions involved in glutamate metabolism in Bacillus subtilis. Amino acids like proline, arginine, and histidine when provided as the sole C/N source are catabolized via glutamate. In contrast, growth on glucose as C source demands glutamate synthesis (via AKG). b) Western blot using anti-GudB antibodies indicating similar expression levels of GudB in B. subtilis cells grown in glucose-ammonia (GA) and Histidine (H) (-DSG). Upon treating with a chemical crosslinker (DSG, 0.5 mM), high molecular weight species that include GudB can be seen in cells grown on glucose-ammonia (GA, highlighted in red frame) but not on histidine (H). Recombinant GudB served as a positive control (+). c) The high molecular weight species of GudB are clearly seen in Western analysis of lysates from cells grown on glucose-ammonia (as in C) yet treated with higher concentration of DSG (1mM/2mM). d) Immunoprecipitation of GudB indicated co-elution of GltA and GltB in glucose-ammonia but not in histidine. The eluates from the pulldown was subjected to SDS-PAGE and stained with silver nitrate. e) SDS-PAGE showing co-elution of GudB and GltA upon purification of Strep-GltB from B. subtilis cells grown in glucose-ammonia (Lane 1; Lane 2 shows purified recombinant Strep tagged-GudB). f) Co-purification of GltA and GltB upon pulldown of His-tagged GudB but RocG. g) GudB but not RocG co-eluted upon pulldown of Strep-GltB from strains expressing either GudB or RocG from the constitutive gudB promoter (Gpt). Images b-g correspond to one replicate and are representative at least three independent experiments.
Figure 2:
Figure 2:. The phenotypic effects of GltAB and GudB and their interaction.
(a-d) Growth profiling of the denoted knockout strains indicate that GltAB’s glutamate dehydrogenase activity is essential for growth in glucose-ammonia (panel a) while GudB’s glutamate dehydrogenase activity is essential in glutamate (panel b) and histidine (panel c). Under conditions where both glucose and glutamate are available neither of these two activities is essential (panel d). n=3 are three independent measurements. Data is presented as mean of all measurements and error bars represent SD. (e-h) Growth inhibition in glutamate medium upon expression of wild-type GltAB, and its inactive mutant (GltAC1A), from an IPTG inducible hyper-spank promoter. The scheme above each panel shows the genotype of the corresponding strain. Expression of functional GltA causes growth suppression in strains expressing GudB (panel e) or RocG (panel f) likely due to futile cycling of making and breaking glutamate. Expression of GltABC1A causes growth suppression in a strain expressing GudB (panel G) but not in a strain co-expressing RocG (panel h). These effects are in agreement with GltA interacting with and inhibiting GudB but not RocG n=2 are two independent measurements. Data is presented as mean of all measurements and error bars represent SD..
Figure 3.
Figure 3.. Enzymatic kinetics of the GltAB-GudB complex.
a) SDS-PAGE analysis of the GltAB-GudB complex, and its individual components, GudB, and GltAB, used in these assays. The complex and stand-alone GltAB were purified by the pulldown of Strep-GltB from respective B. subtilis strains (see methods). GudB was purified by recombinant expression in E.coli. b) The GudB-GltAB complex exhibits either glutamate dehydrogenase activity (upon addition of glutamate and NAD+; green line, indicating a drop in absorbance at 340 nm due to NAD+ reduction) or synthetase activity (upon addition of AKG, glutamine and NADPH; orange line indicating an increase in absorbance due to NADPH oxidation). c-d) Initial velocity of the dehydrogenase reaction as a function of glutamate concentration. On its own, GudB displayed a KM value of 7.3 mM for glutamate and negative cooperativity (c, Hill coefficient =0.57, Supplementary Table 2). In complex with GltAB, the KM rises to 138 mM with positive cooperativity (d, H=1.3). The insets in c and d show the initial velocities at low concentrations of glutamate. n=2 are two independent experiements. Data is presented as mean and error bars indicate standard deviation. e) Initial velocity of the dehydrogenase reaction in the GltAB-GudB complex, as is (Glu+NAD+), and in the presence of GltAB’s substrates (AKG, NADPH). n=2 are two independent experiements. Data is presented as mean and error bars indicate standard deviation. f) Reaction progress curves of the GudB-GltAB complex with various substrate combinations: substrates of GltAB only (blue), substrates of GltAB plus glutamate (yellow), substrates of GltAB plus NAD+ (light blue), all substrates for both enzymes (black). g) Multiphasic progress curve displayed by the GudB-GltAB complex in the presence of substrates of both enzymes except AKG. The phases where GltAB predominates are shown in orange and those where GudB is dominant are shown in green. The inset shows the initial few minutes of the reaction where there is a rapid drop in absorbance followed by a gradual increase. Panels a,b,f and g correspond to one experiment and are representative of atleast 4 independent experiements.
Figure 4.
Figure 4.. The stoichiometry, oligomeric state and atomic structure of the GltAB-GudB complex.
a) Native-MS of standalone GltAB (top) and GudB (bottom). The oligomeric state as inferred from the mass is shown schematically besides each charge state: GltAB’s observed mass corresponds to a heterodimer, while GudB’s mass indicated the expected hexamer. b) Native-MS of the GudB-GltAB complex. The observed mass corresponds to 6 copies of a GltAB heterodimer bound to the GudB hexamer. The low m/z region contained unbound GltAB. a). The inset shows the SDS-PAGE of the protein sample used for native-MS and cryo-EM. The image is from one batch of purification and is representative of at least 4 independent purifications. c) Density map of the GudB6-GltAB6 complex generated after applying D3 symmetry. d) Model of GudB6-GltA6B6 complex. The three dimers of the GudB hexamer are shown in three different colours (pink, yellow and green). GltA and GltB are shown in orange and blue, respectively. GltA and GltB subunits below the plane of the paper is shown in light orange and light blue, respectively. The views (top and side) are with respect to the orientation of GudB as shown in the insets. The dihedral (D3) rotation axis of GudB is depicted as a triangle in the left panel and as a dashed arrow in the right panel. e) The density map of GudB6-GltA2B2. f) On the left is shown the model of GudB6-GltA2B2 (side view) and the right panel shows the model rotated 90° along the dihedral axis of GudB. From the model on the right it is clear that there are minimal interactions between the two GltA copies.
Figure 5.
Figure 5.. The structural basis for inhibition of GudB by GltA binding.
a) Zoom-in model of the GudB-GltA interaction. The colors represent the different domains of GltA and GudB as detailed in the next panel. The inset shows the perspective of the model with respect to the model shown in Fig. 4f. The dashed box (G) corresponds to the region containing residues from GudB and GltA forming a hydrogen bonding network. This is shown in detail in panel G. b) GltA consists of Ntn amidotransferase (Ntn) domain (grey), a central domain (orange), a synthase domain (sand) and a GXGXG domain (metal blue). The central domain of GltA (orange) interacts with residues from both the substrate (green) and co-factor binding domain of GudB (light green). c) GudB’s hexamer comprises a trimer of dimer; GltA (in orange) interacts with two protomers of GudB (major and minor) from two different dimers (green and yellow, respectively). The front view shows the major interacting GudB protamer, and the top view the minor one. The coloring pattern of the three dimers and the corresponding chain ID’s are also shown. The dimer interface in two of the dimers (1 and 2) is shown as dashed lines. d) Zoom-in on GudB active site cleft (surface display, in green) and the interacting loop of GltA (magenta; the remaining structure of GltA is in orange). NAD+ (in yellow sticks) is modelled into the active site cleft of GudB based on superposition of GltA-bound GudB to 1V9L (open state). The steric overlap of GltA’s loop with NAD+ would be even higher in the closed state of the enzyme. e) Zoom-in on the boxed region shown in panel A, depicting the hydrogen bonding network between residues of GltA (magenta) and the co-factor binding domain of GudB (cyan). Notably, GudB’s N231, which is located at the tip of the phosphate binding loop (and binds the NAD+’s phosphate groups) is bound to GltA’s N447, and thus directly interferes with NAD+ binding. f) The interaction of GltA’s E451 and E454 with residues of the substrate binding domain of GudB (R84 and H86).
Figure 6.
Figure 6.. GudB-GltAB interaction is important for biofilm formation.
a) Representative images of biofilms of wild-type and mutant B. subtilis strains on glutamate-glycerol (MSGG) agar medium, monitored over a period of ~7 days. As indicated by their knockouts, both Glt subunits (GltA and B), and GudB, are essential for wild-type like biofilm morphology b) Comparision of biofilm formation by wild-type and mutants expressing GltA under an IPTG-induced promoter, at varying IPTG concentrations (0–100 μM). Wild-type (i-iii); IPTG-induced GltA plus GudB (iv-vi), or RocG (vii-ix); IPTG-induced inactive GltA mutant, GltABC1A plus GudB (x-xii), or with RocG (xiii-xv). Wild-type GltAB and the GltABC1A were expressed from an IPTG-inducible hyperspank promoter, while GudB and RocG were under gudB’s promoter. Wild-type’s biofilms are not affected by the presence of IPTG (i-iii). The strain expressing GltAB from an IPTG-induced promoter forms altered biofilms with no IPTG (iv), wild-type-like biofilms with low concentration of IPTG (v), while overexpression resulted in biofilms similar to those of the ΔgudB strain (vi). Co-expression of RocG and GltAB resulted in biofilms with no wrinkles (vii-ix). Expression of the inactive GltABC1A with GudB restores the morphology of the biofilm’s interior, in an IPTG-dependent manner (x-xii); in contrast, co-expression of GltABC1A with RocG does not (xiii-xv). The scale bars in all images correspond to 4 mm. Magnified sections are shown in the last column of panel b. c-e) A summary of the biofilm disruption phenotypes and a proposed model that accounts for them (see text). The biofilm images correspond to the following images from b: iii (c), xii (d) and xv (e).

Comment in

  • A complex struggle for direction.
    Hartmann MD. Hartmann MD. Nat Chem Biol. 2022 Feb;18(2):119-120. doi: 10.1038/s41589-021-00937-w. Nat Chem Biol. 2022. PMID: 34931063 No abstract available.

References

    1. Chubukov V et al. Transcriptional regulation is insufficient to explain substrate‐induced flux changes in Bacillus subtilis. Mol. Syst. Biol 9, 709 (2013). - PMC - PubMed
    1. Metallo CM & Vander Heiden MG Understanding Metabolic Regulation and Its Influence on Cell Physiology. Molecular Cell vol. 49 388–398 (2013). - PMC - PubMed
    1. Curi R et al. Regulatory principles in metabolism -Then and now. Biochemical Journal vol. 473 1845–1857 (2016). - PubMed
    1. Srere PA The metabolon. Trends in Biochemical Sciences vol. 10 109–110 (1985).
    1. Zhang Y & Fernie AR Metabolons, Enzyme–Enzyme Assemblies that Mediate Substrate Channeling, and Their Roles in Plant Metabolism. Plant Commun 100081 (2020) doi:10.1016/j.xplc.2020.100081. - DOI - PMC - PubMed

Publication types

MeSH terms