. 2022 Feb;25(2):168-179.
doi: 10.1038/s41593-021-00973-8. Epub 2021 Dec 20.

Anthrax toxins regulate pain signaling and can deliver molecular cargoes into ANTXR2+ DRG sensory neurons

Affiliations

Anthrax toxins regulate pain signaling and can deliver molecular cargoes into ANTXR2+ DRG sensory neurons

Nicole J Yang et al. Nat Neurosci. 2022 Feb.

Abstract

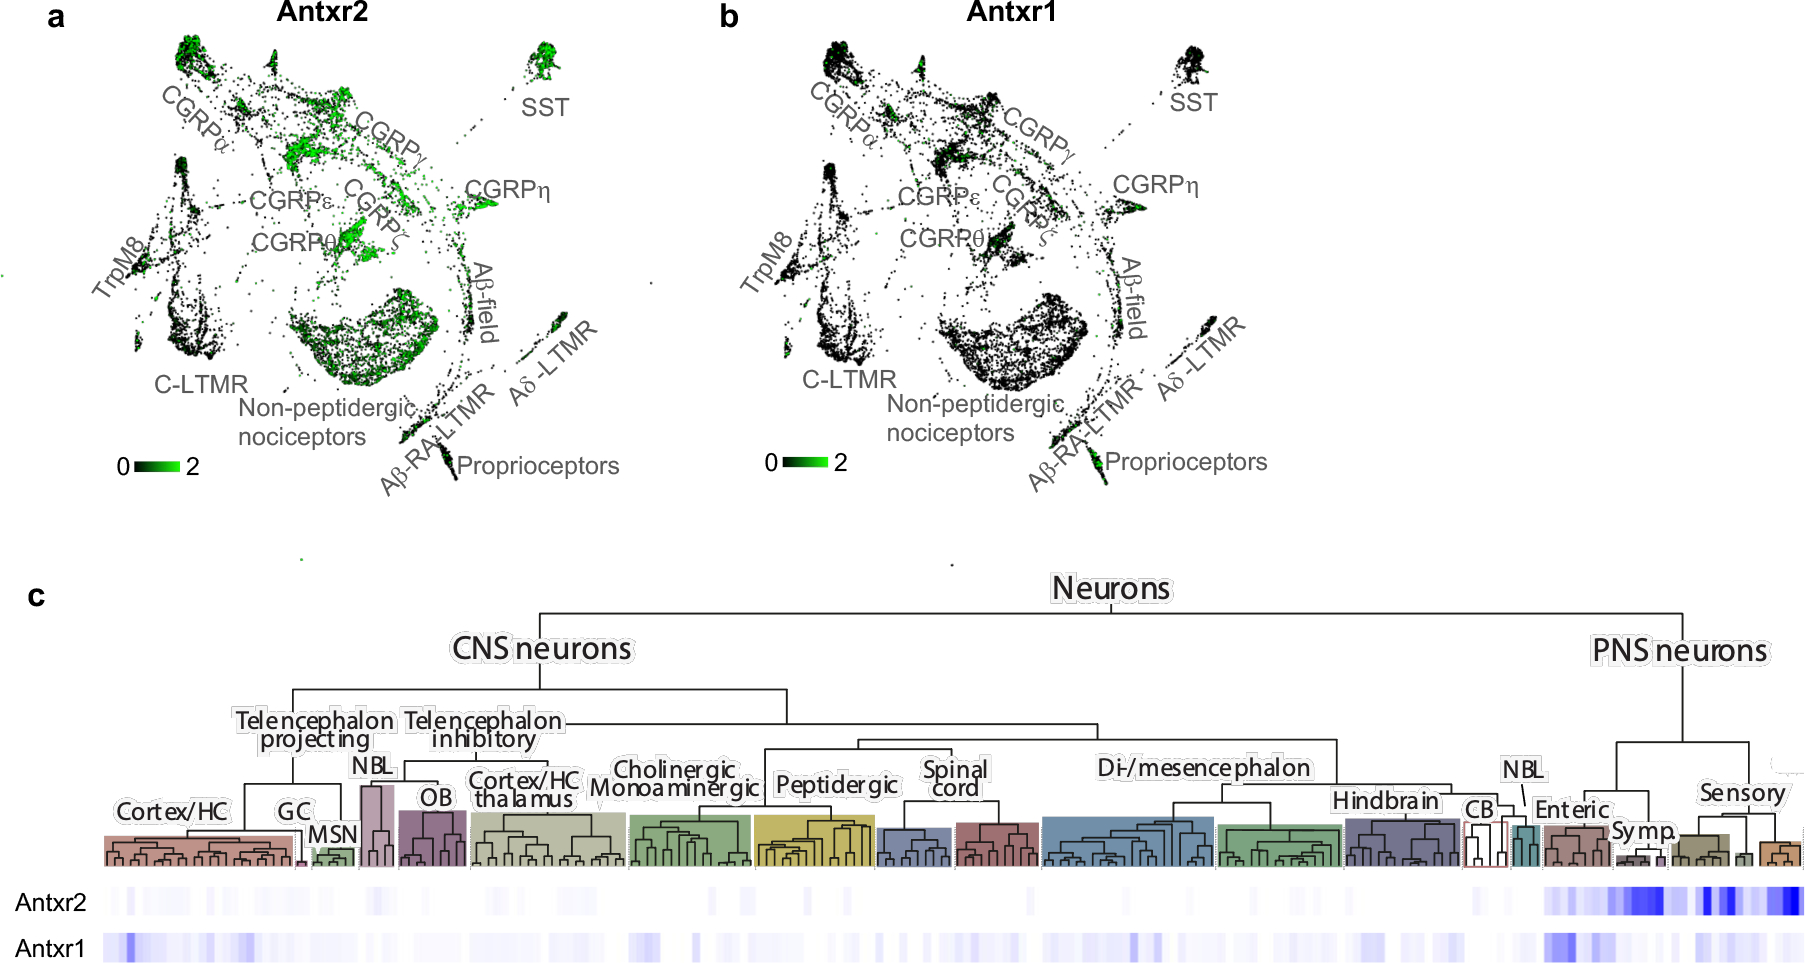
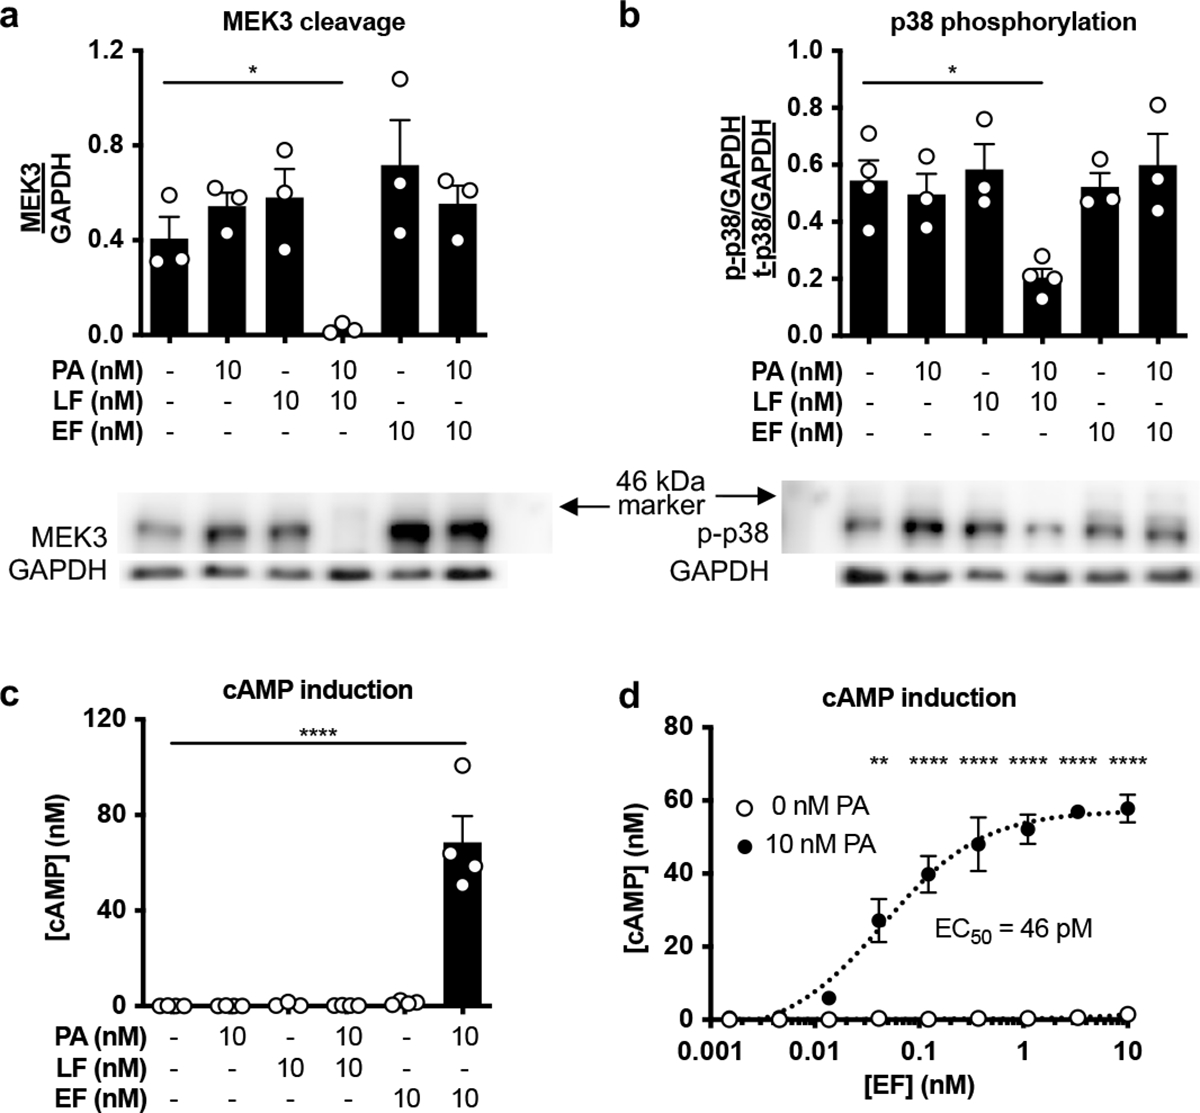
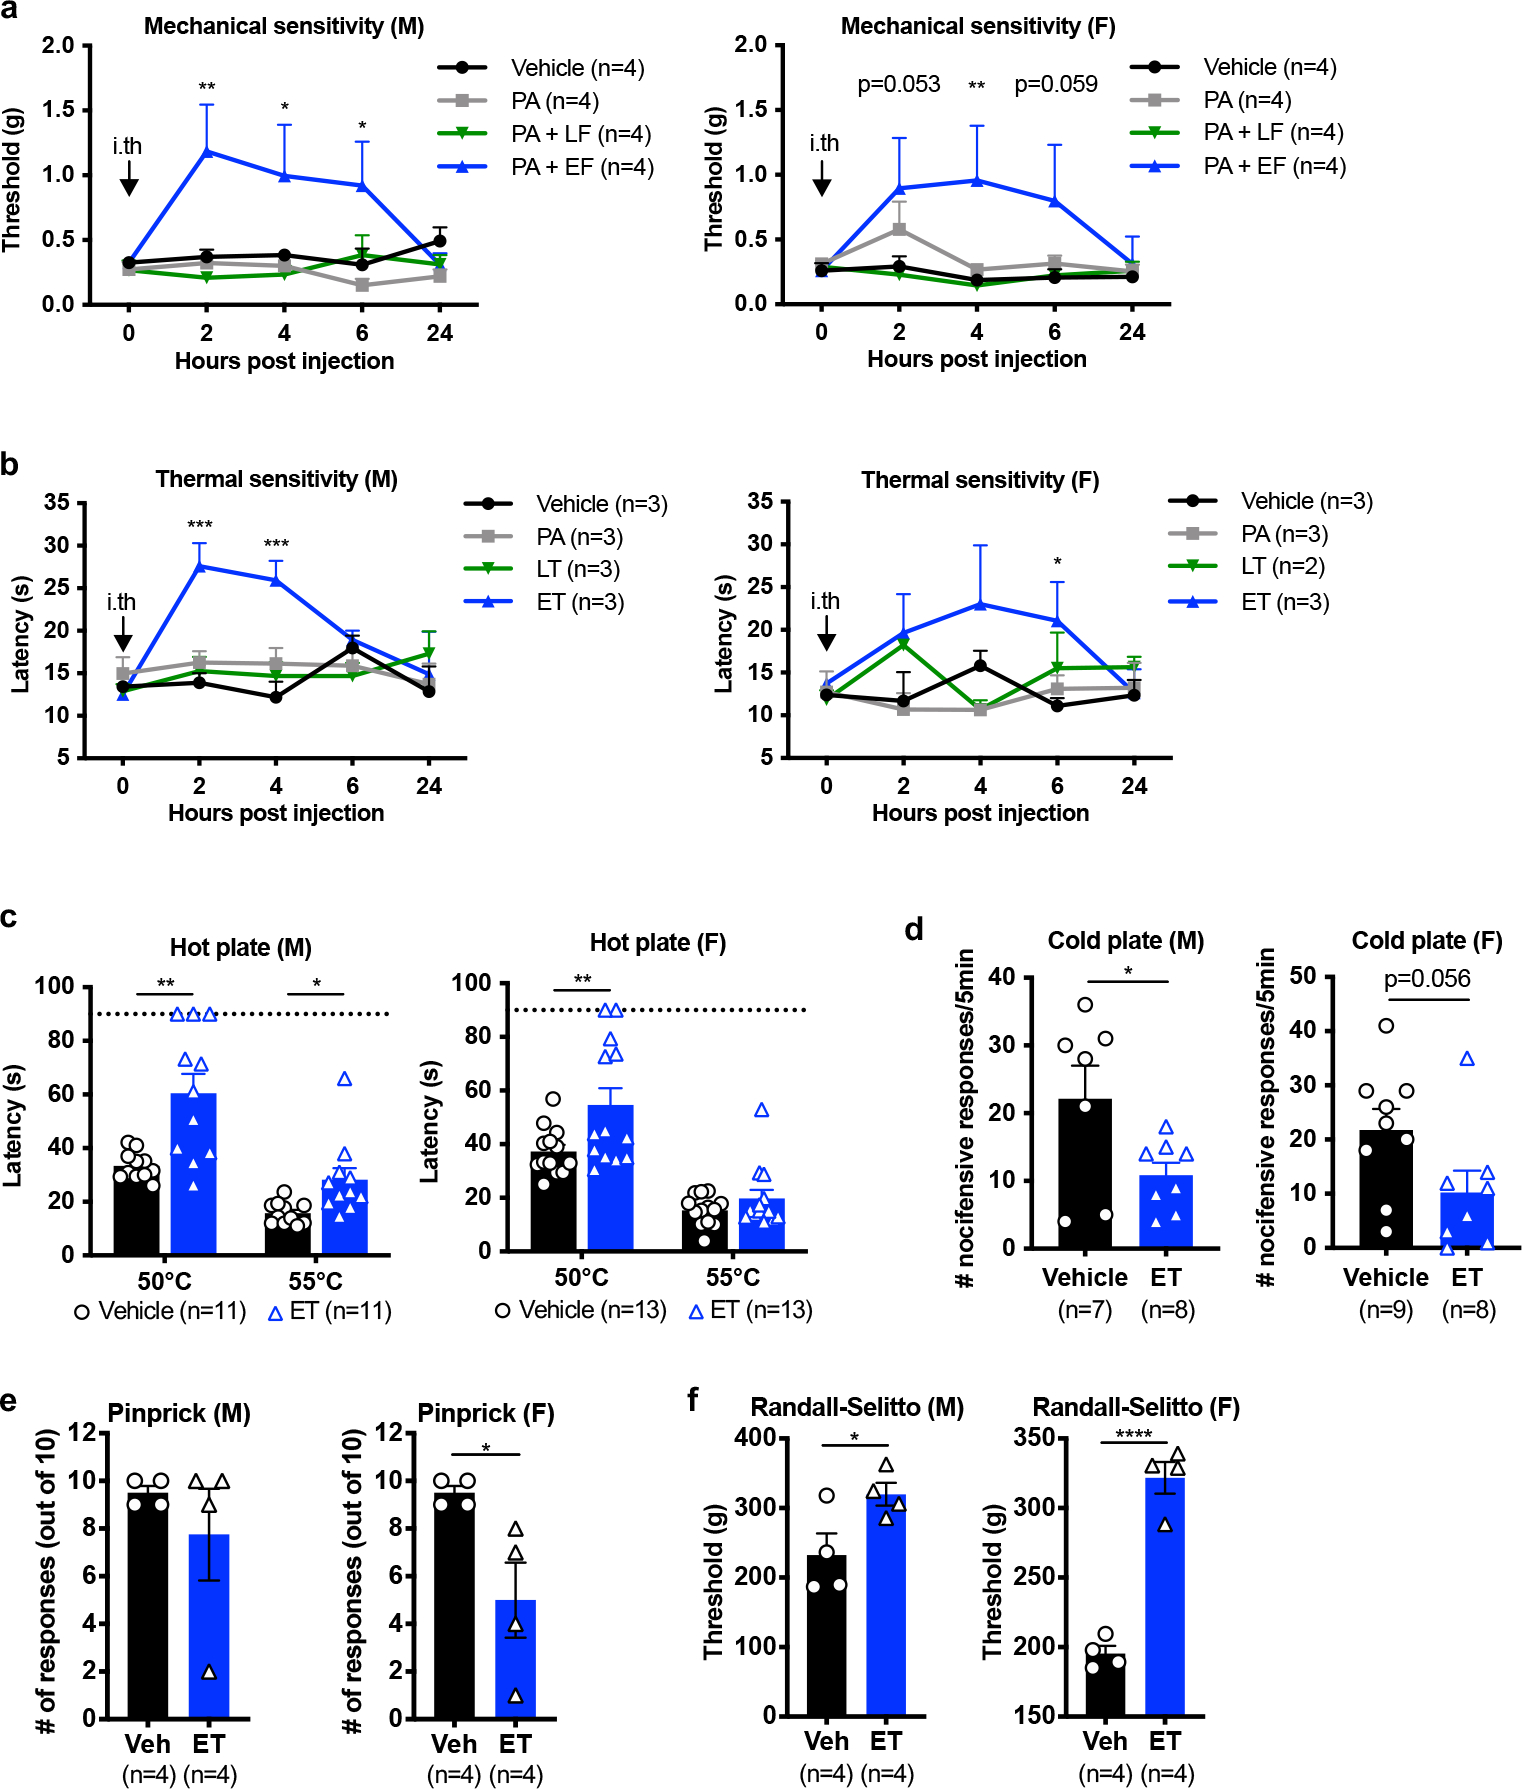
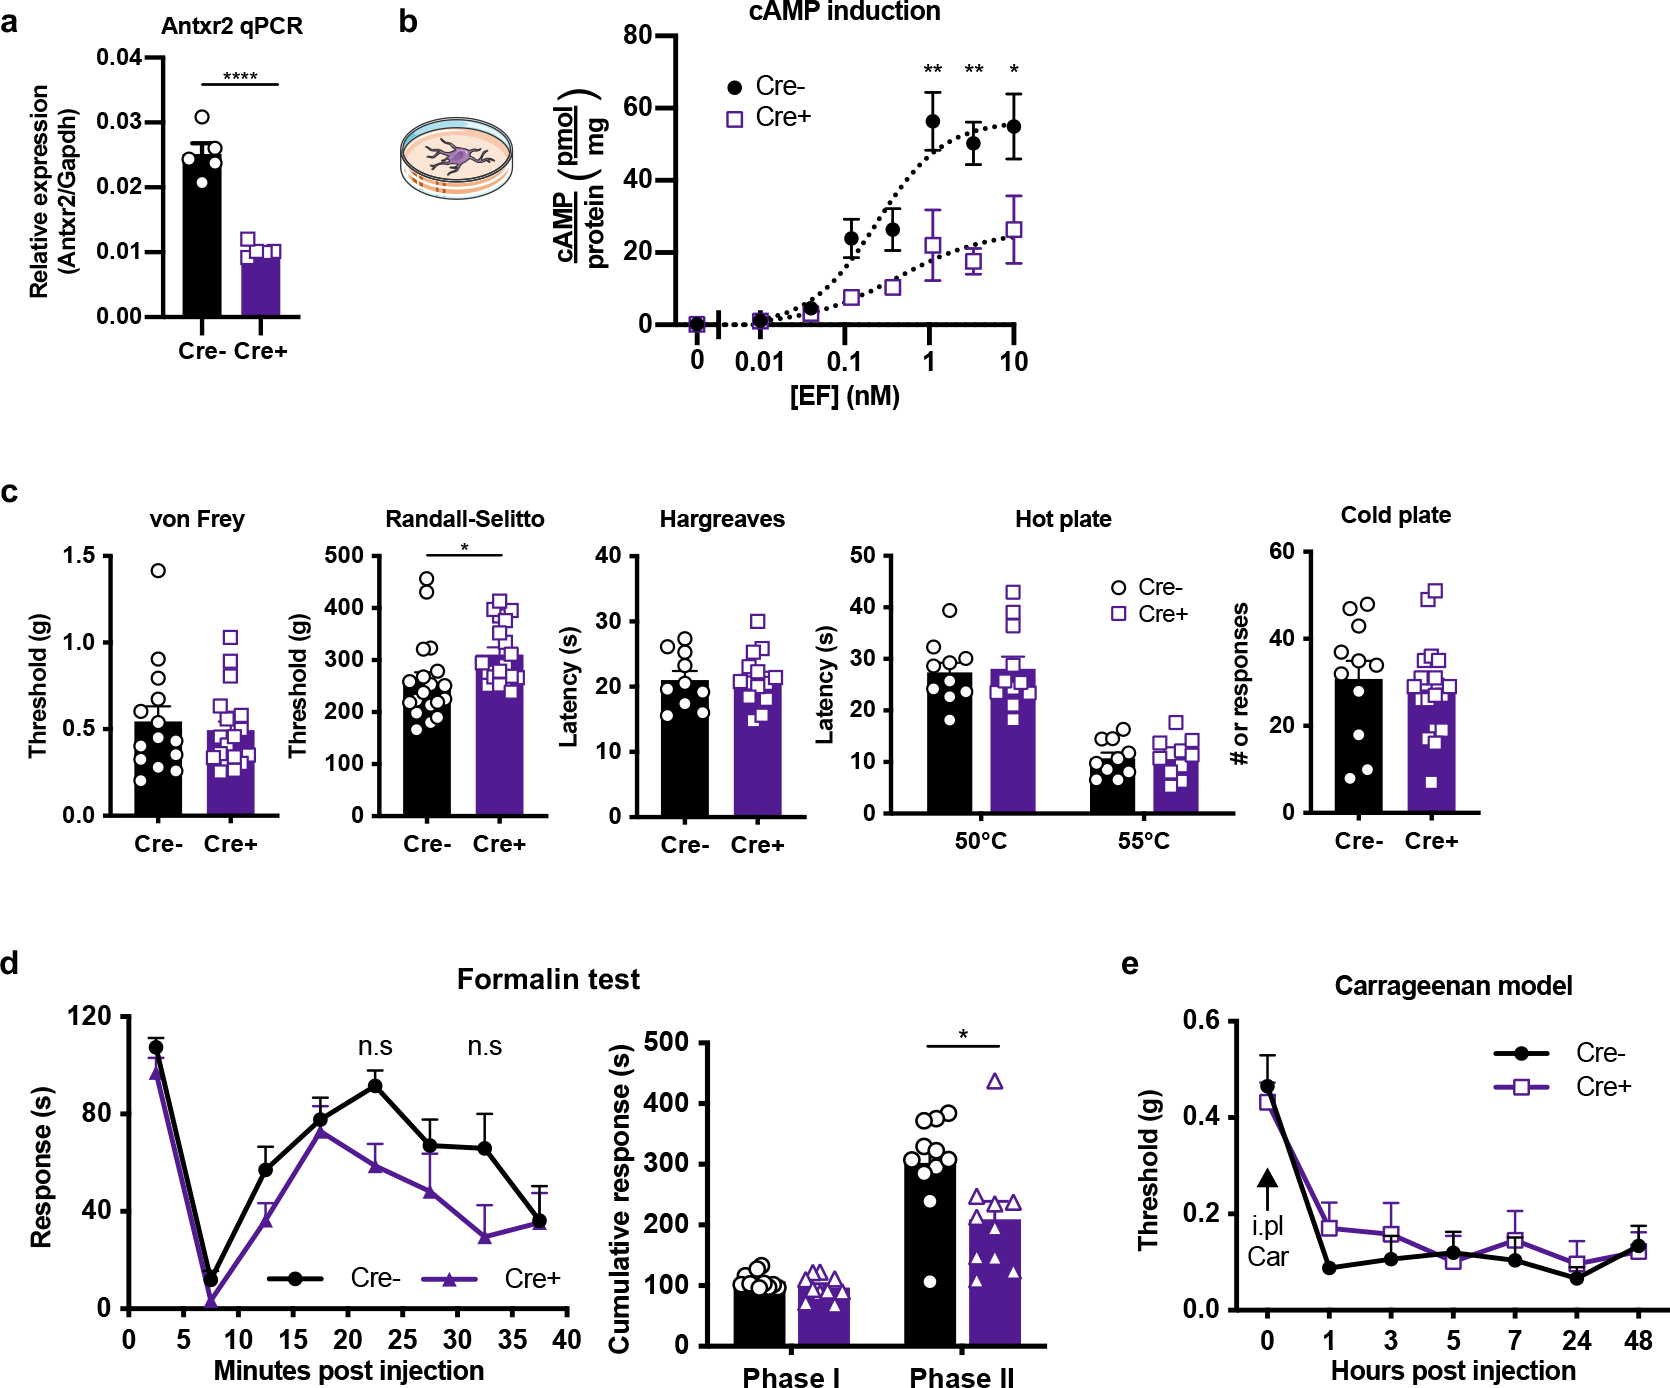
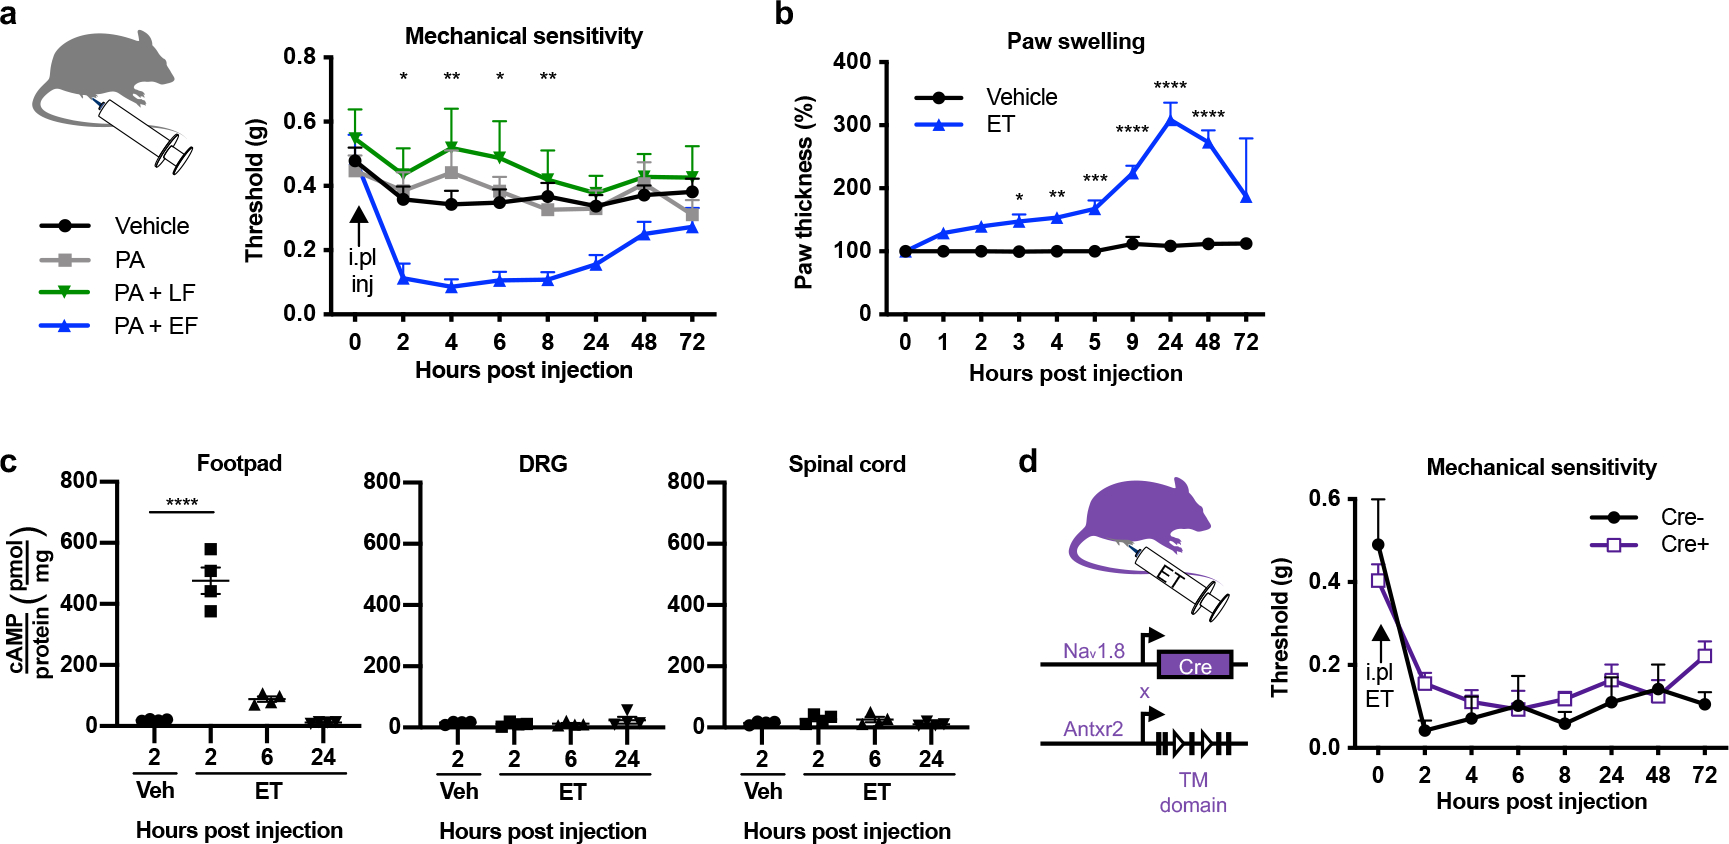
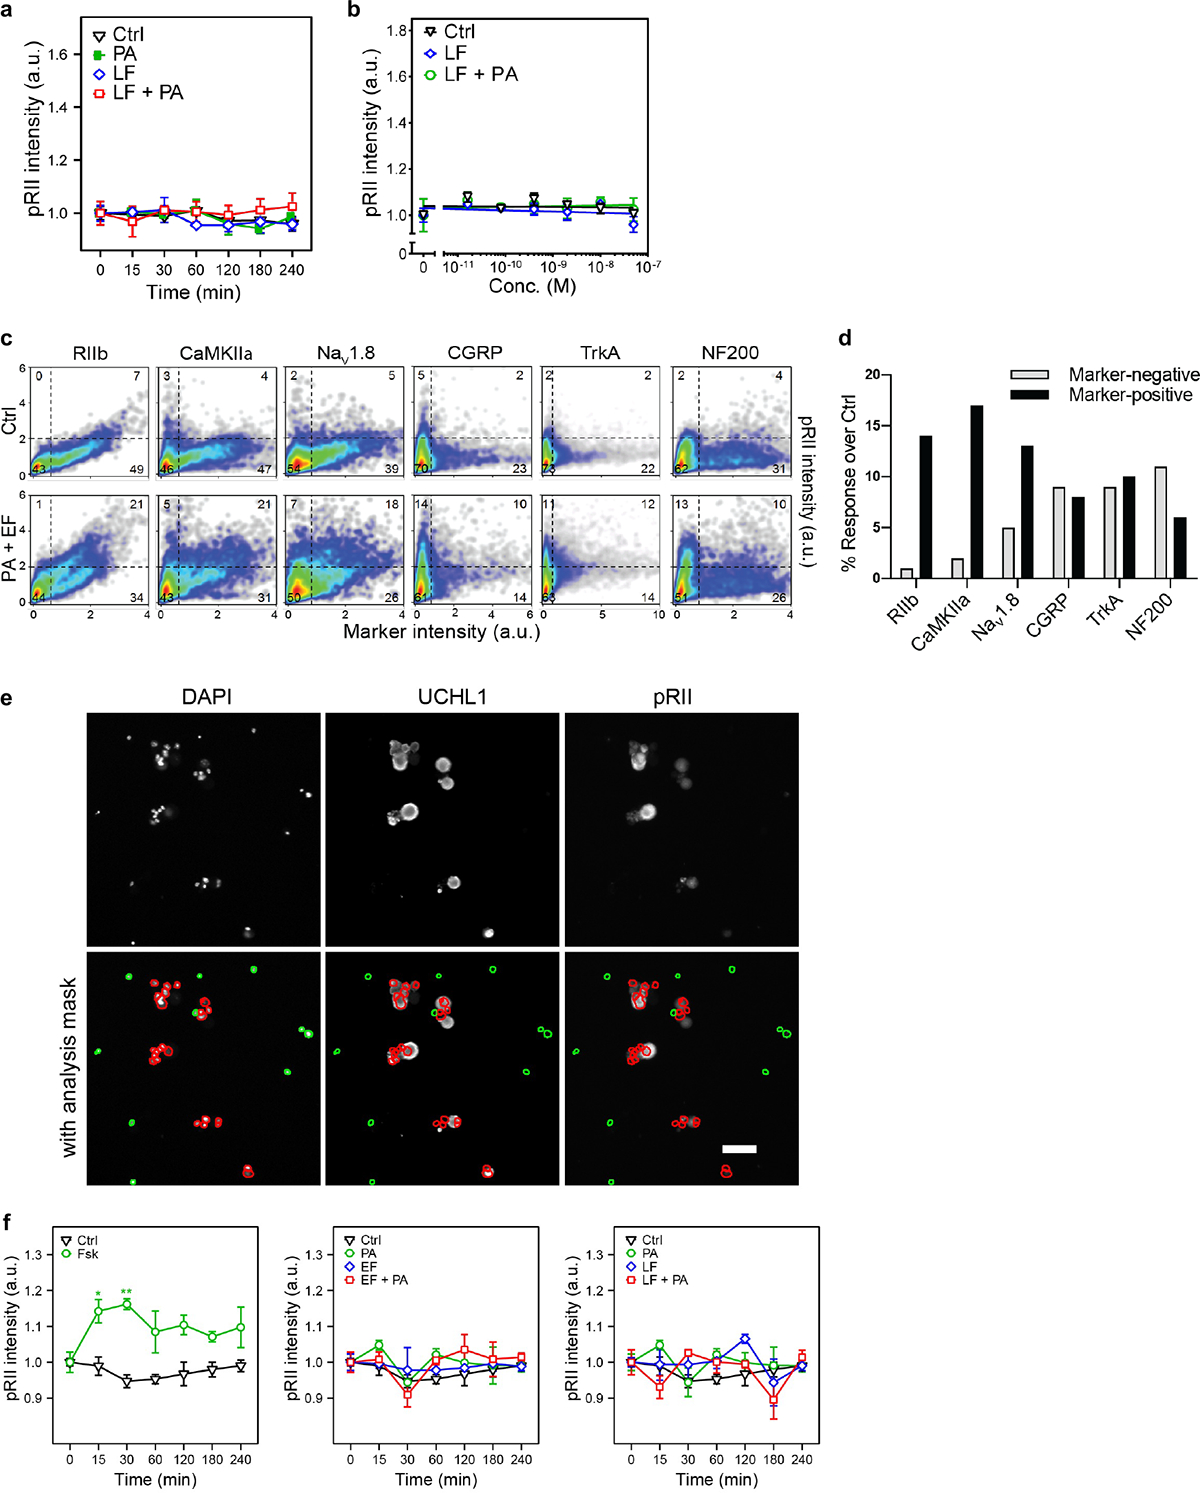
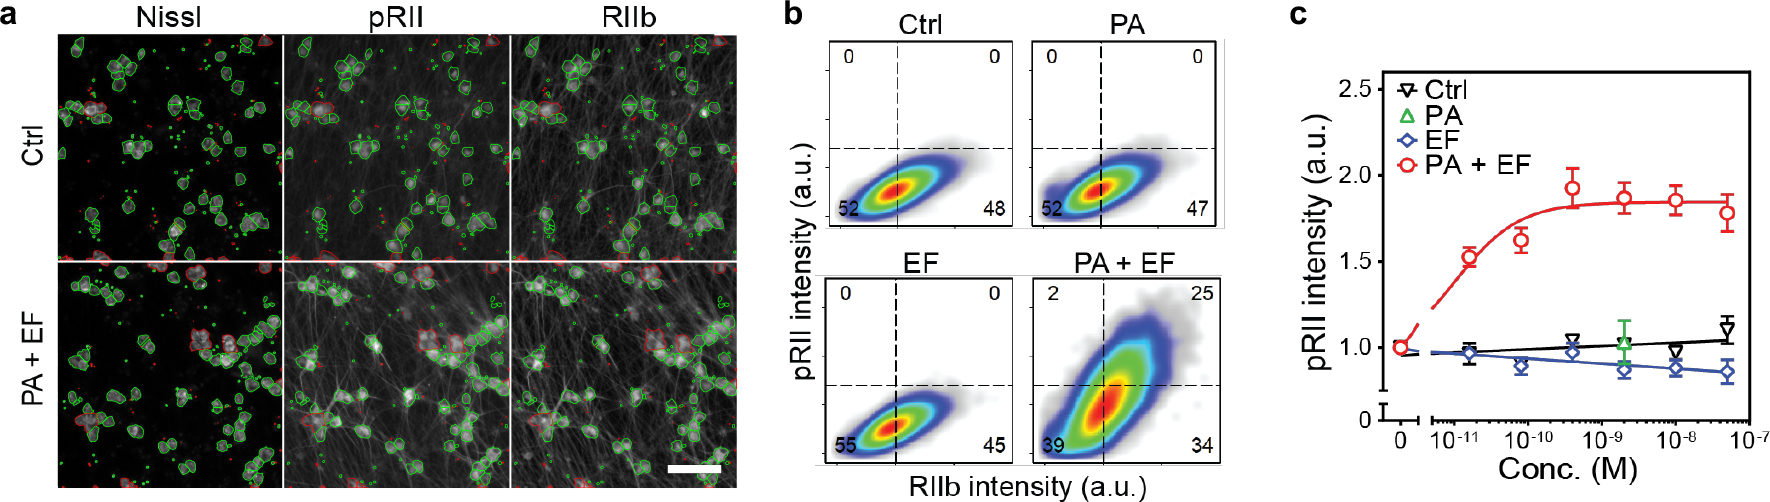
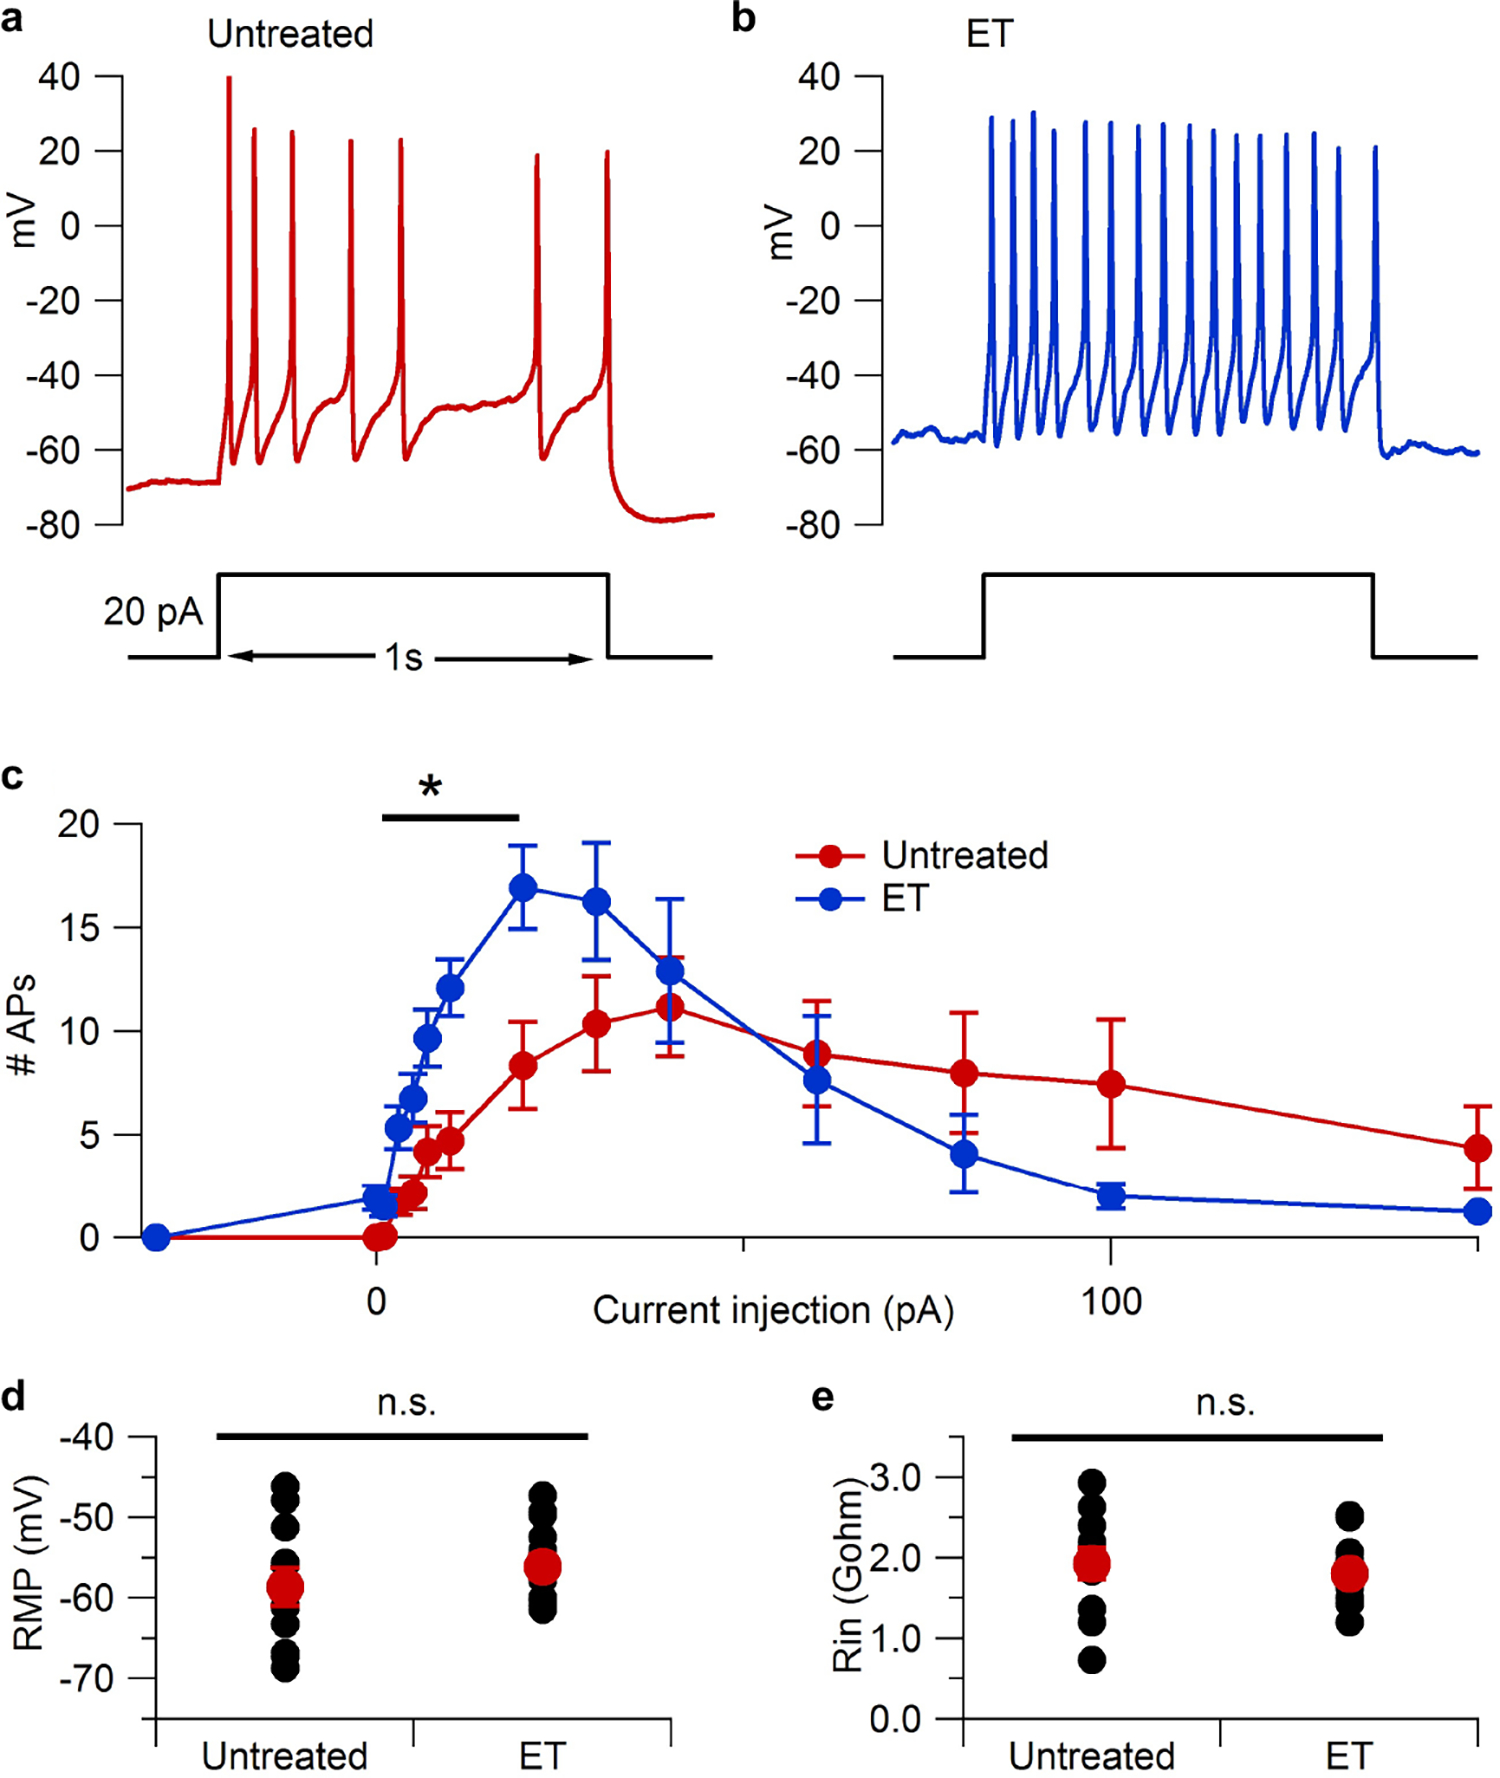
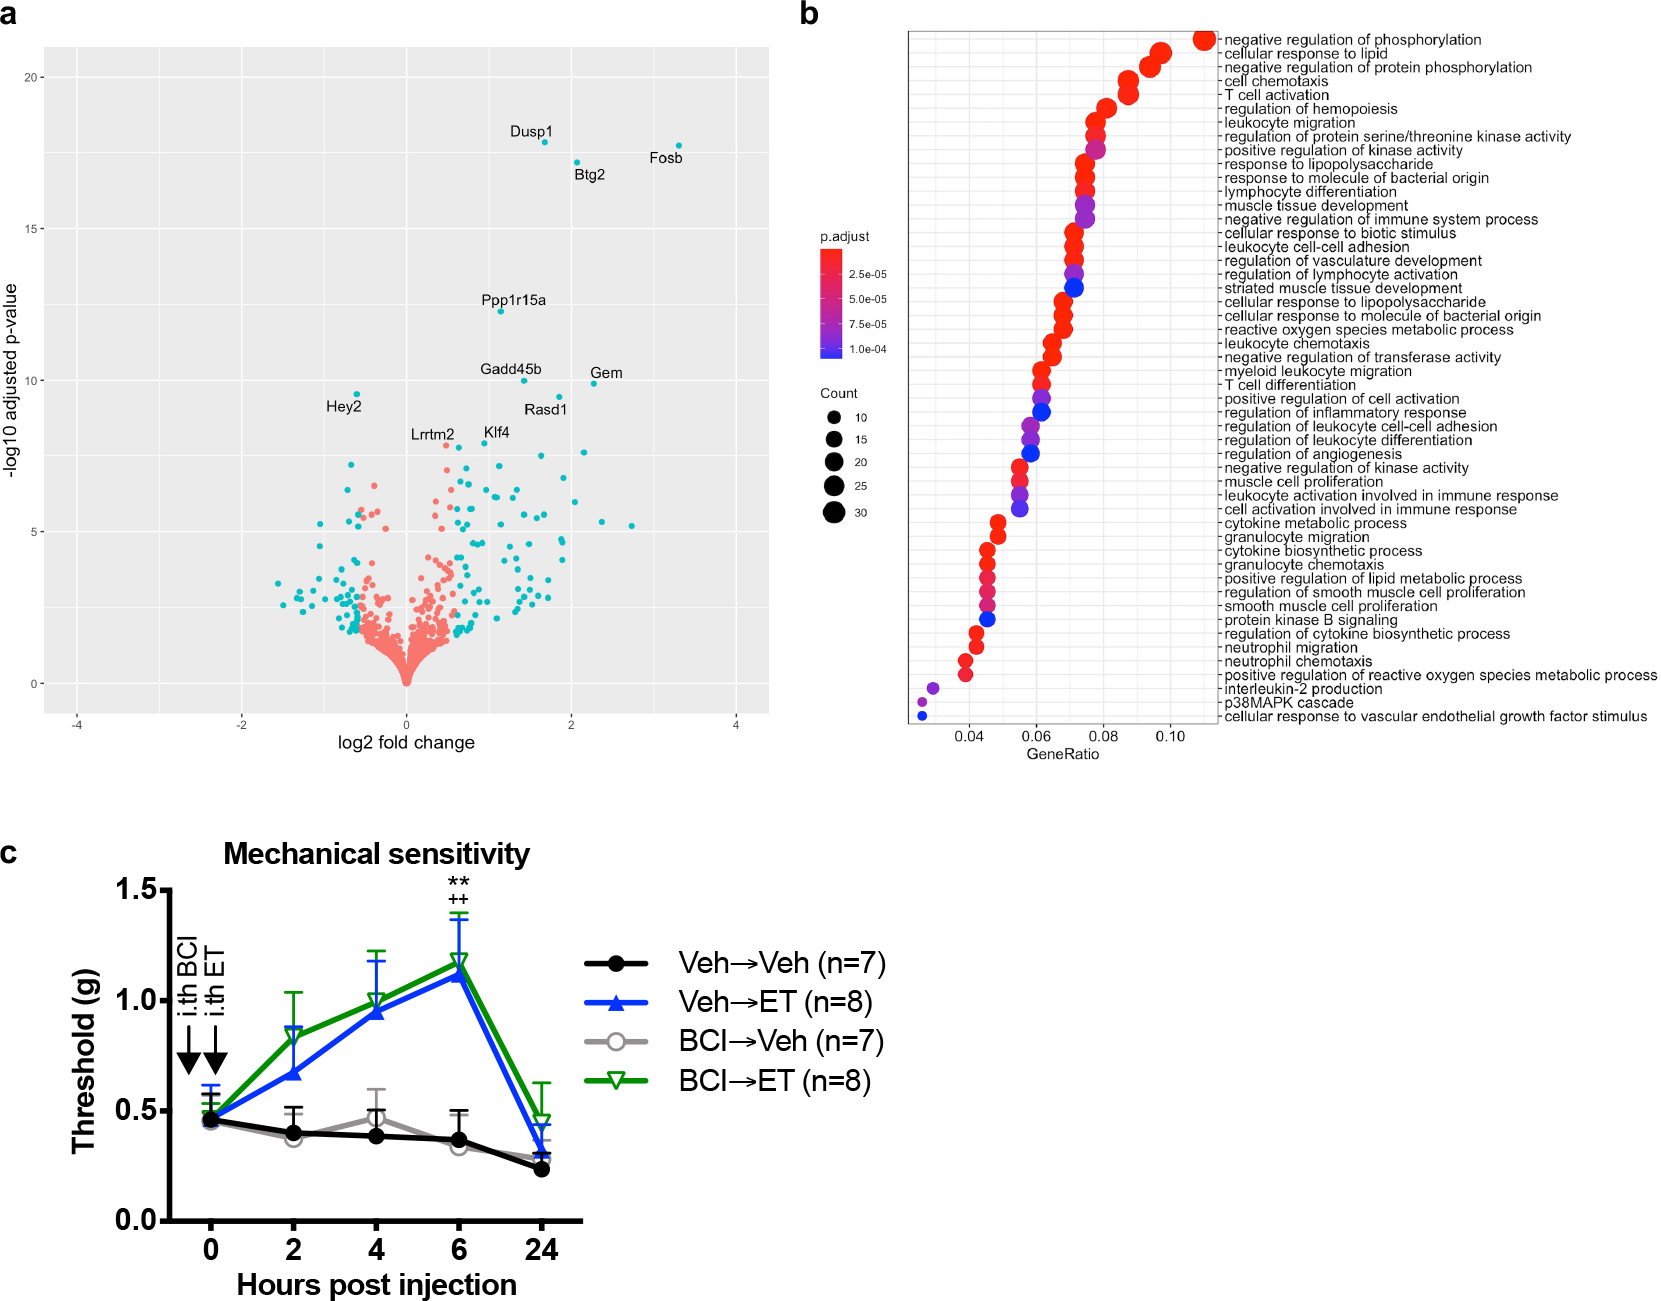
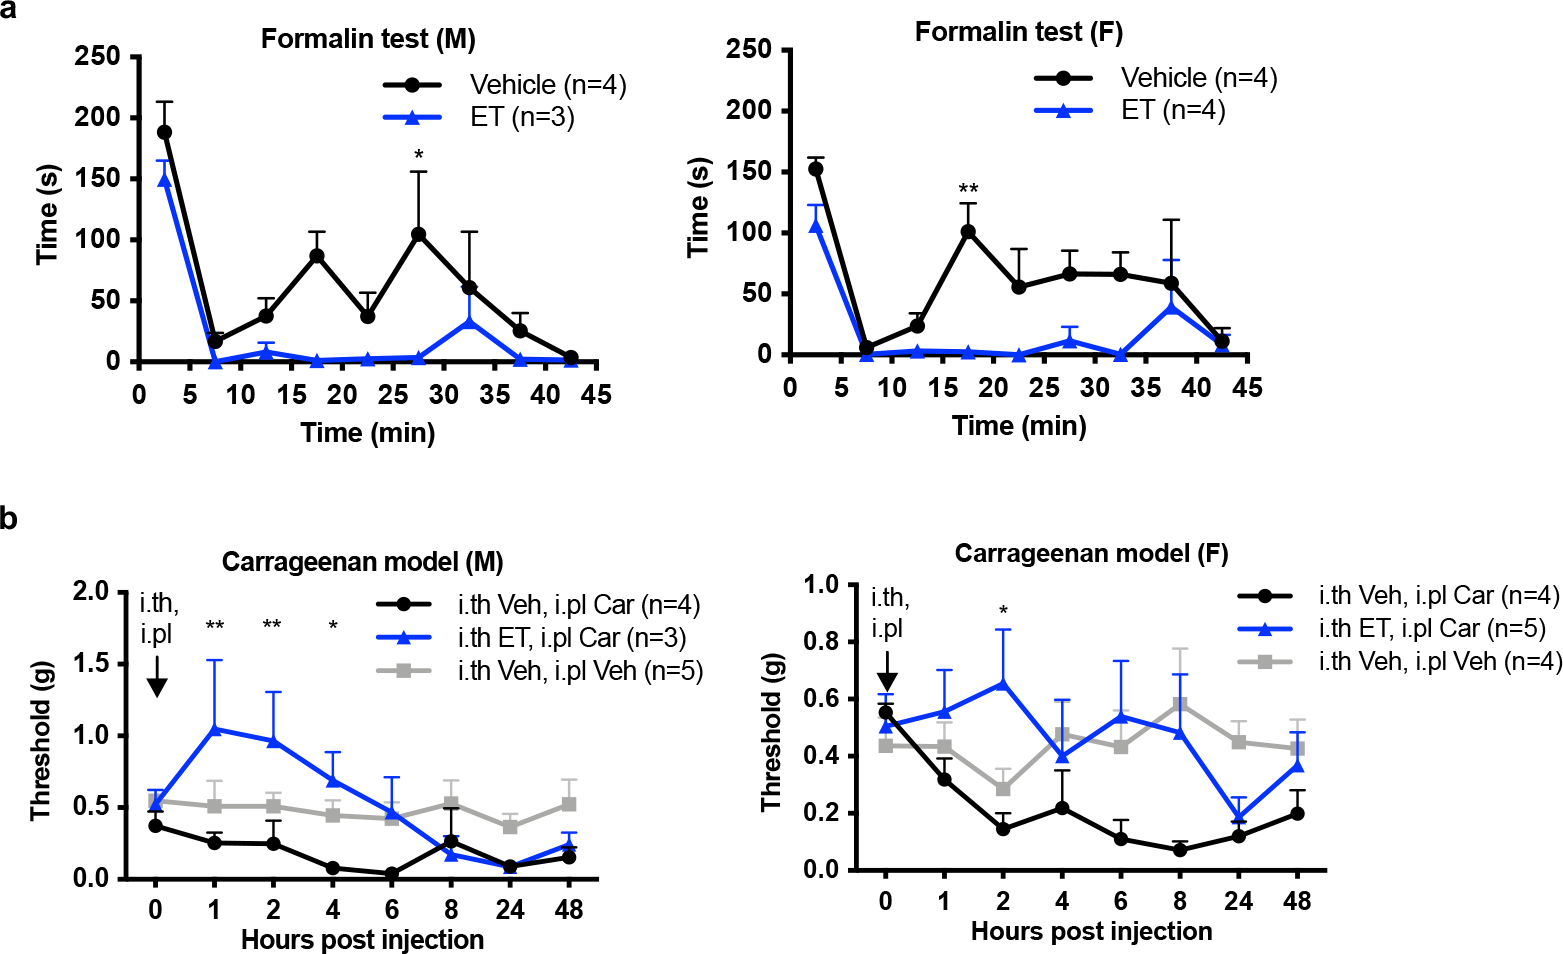
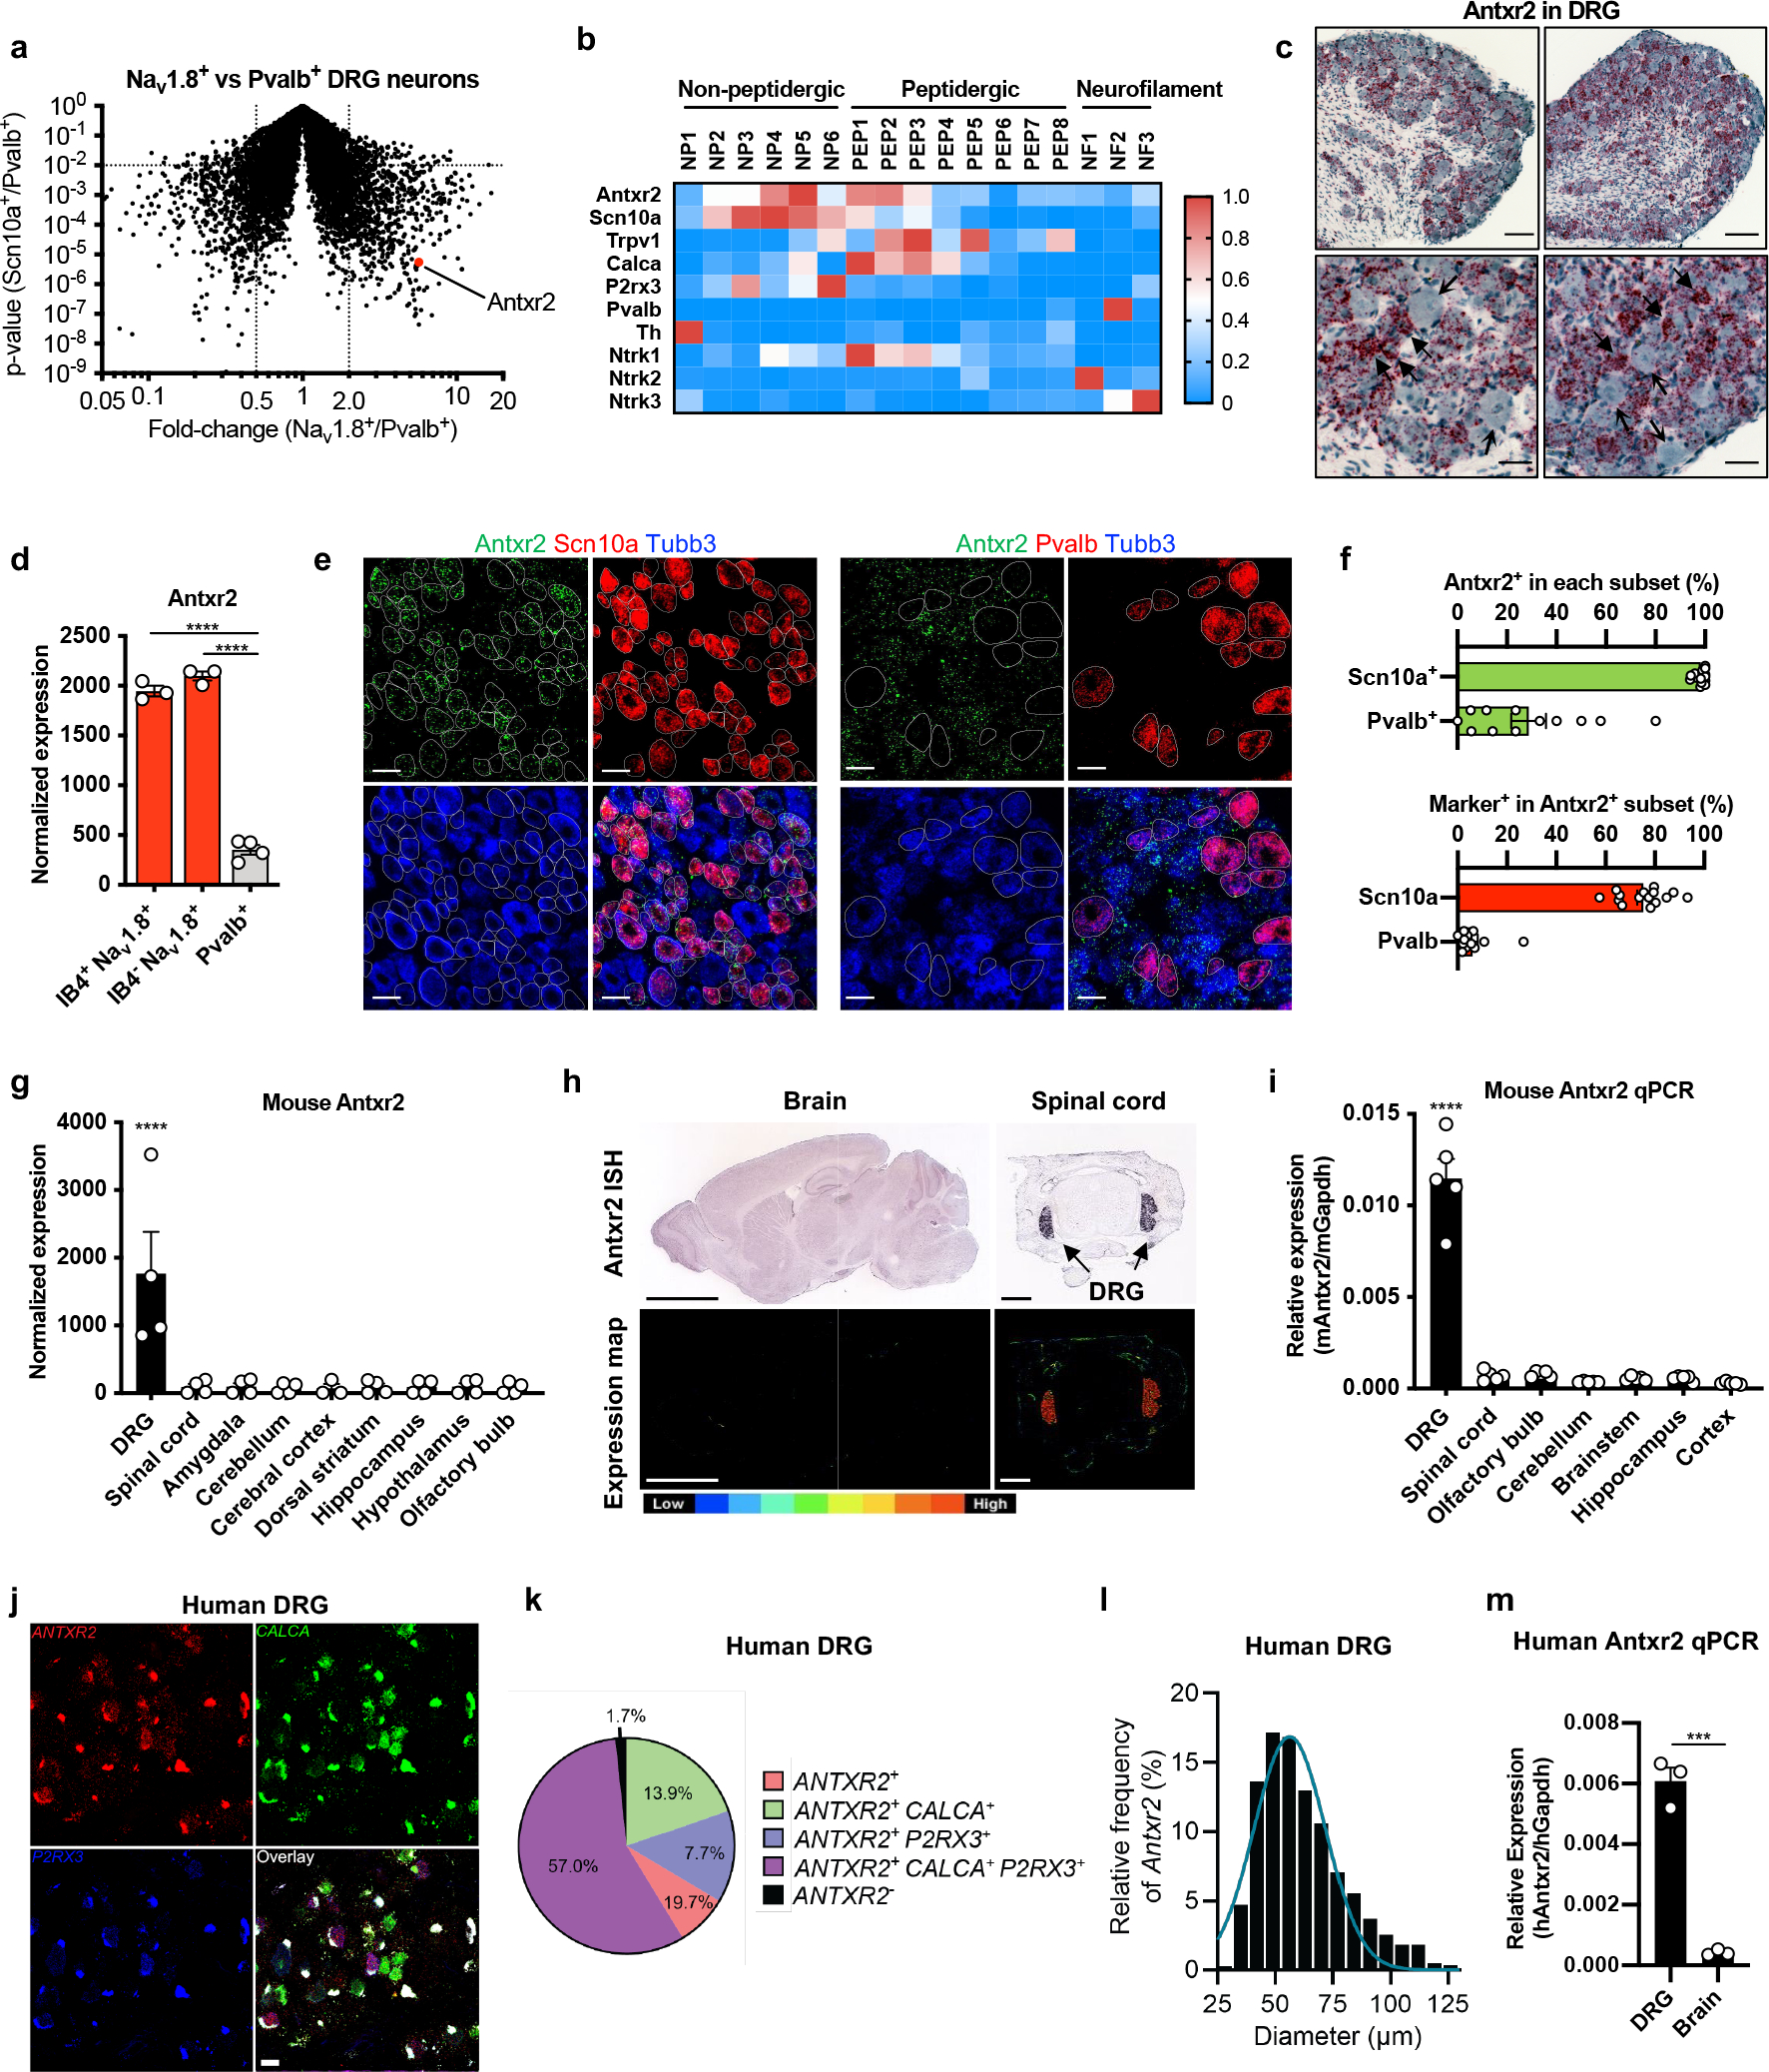
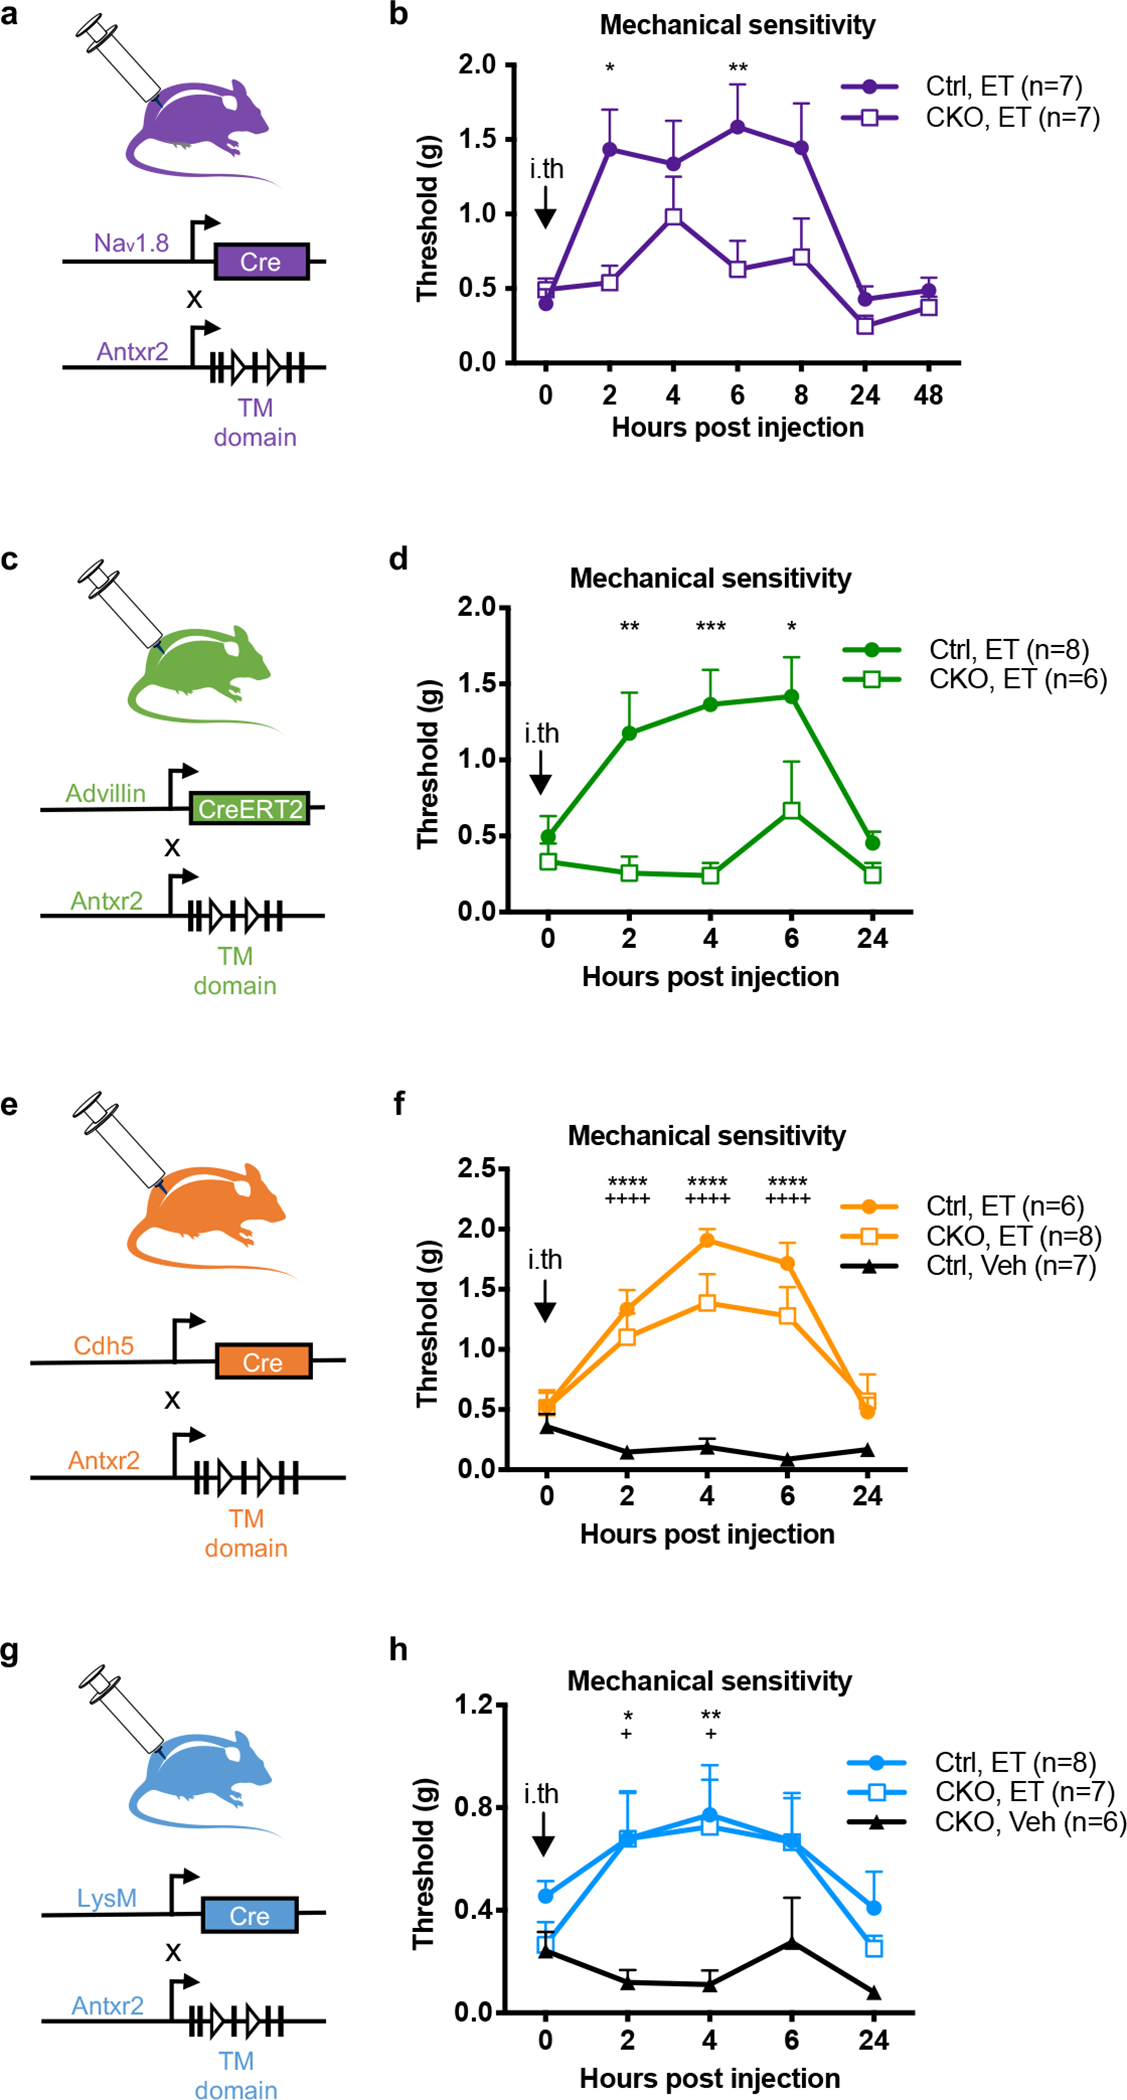
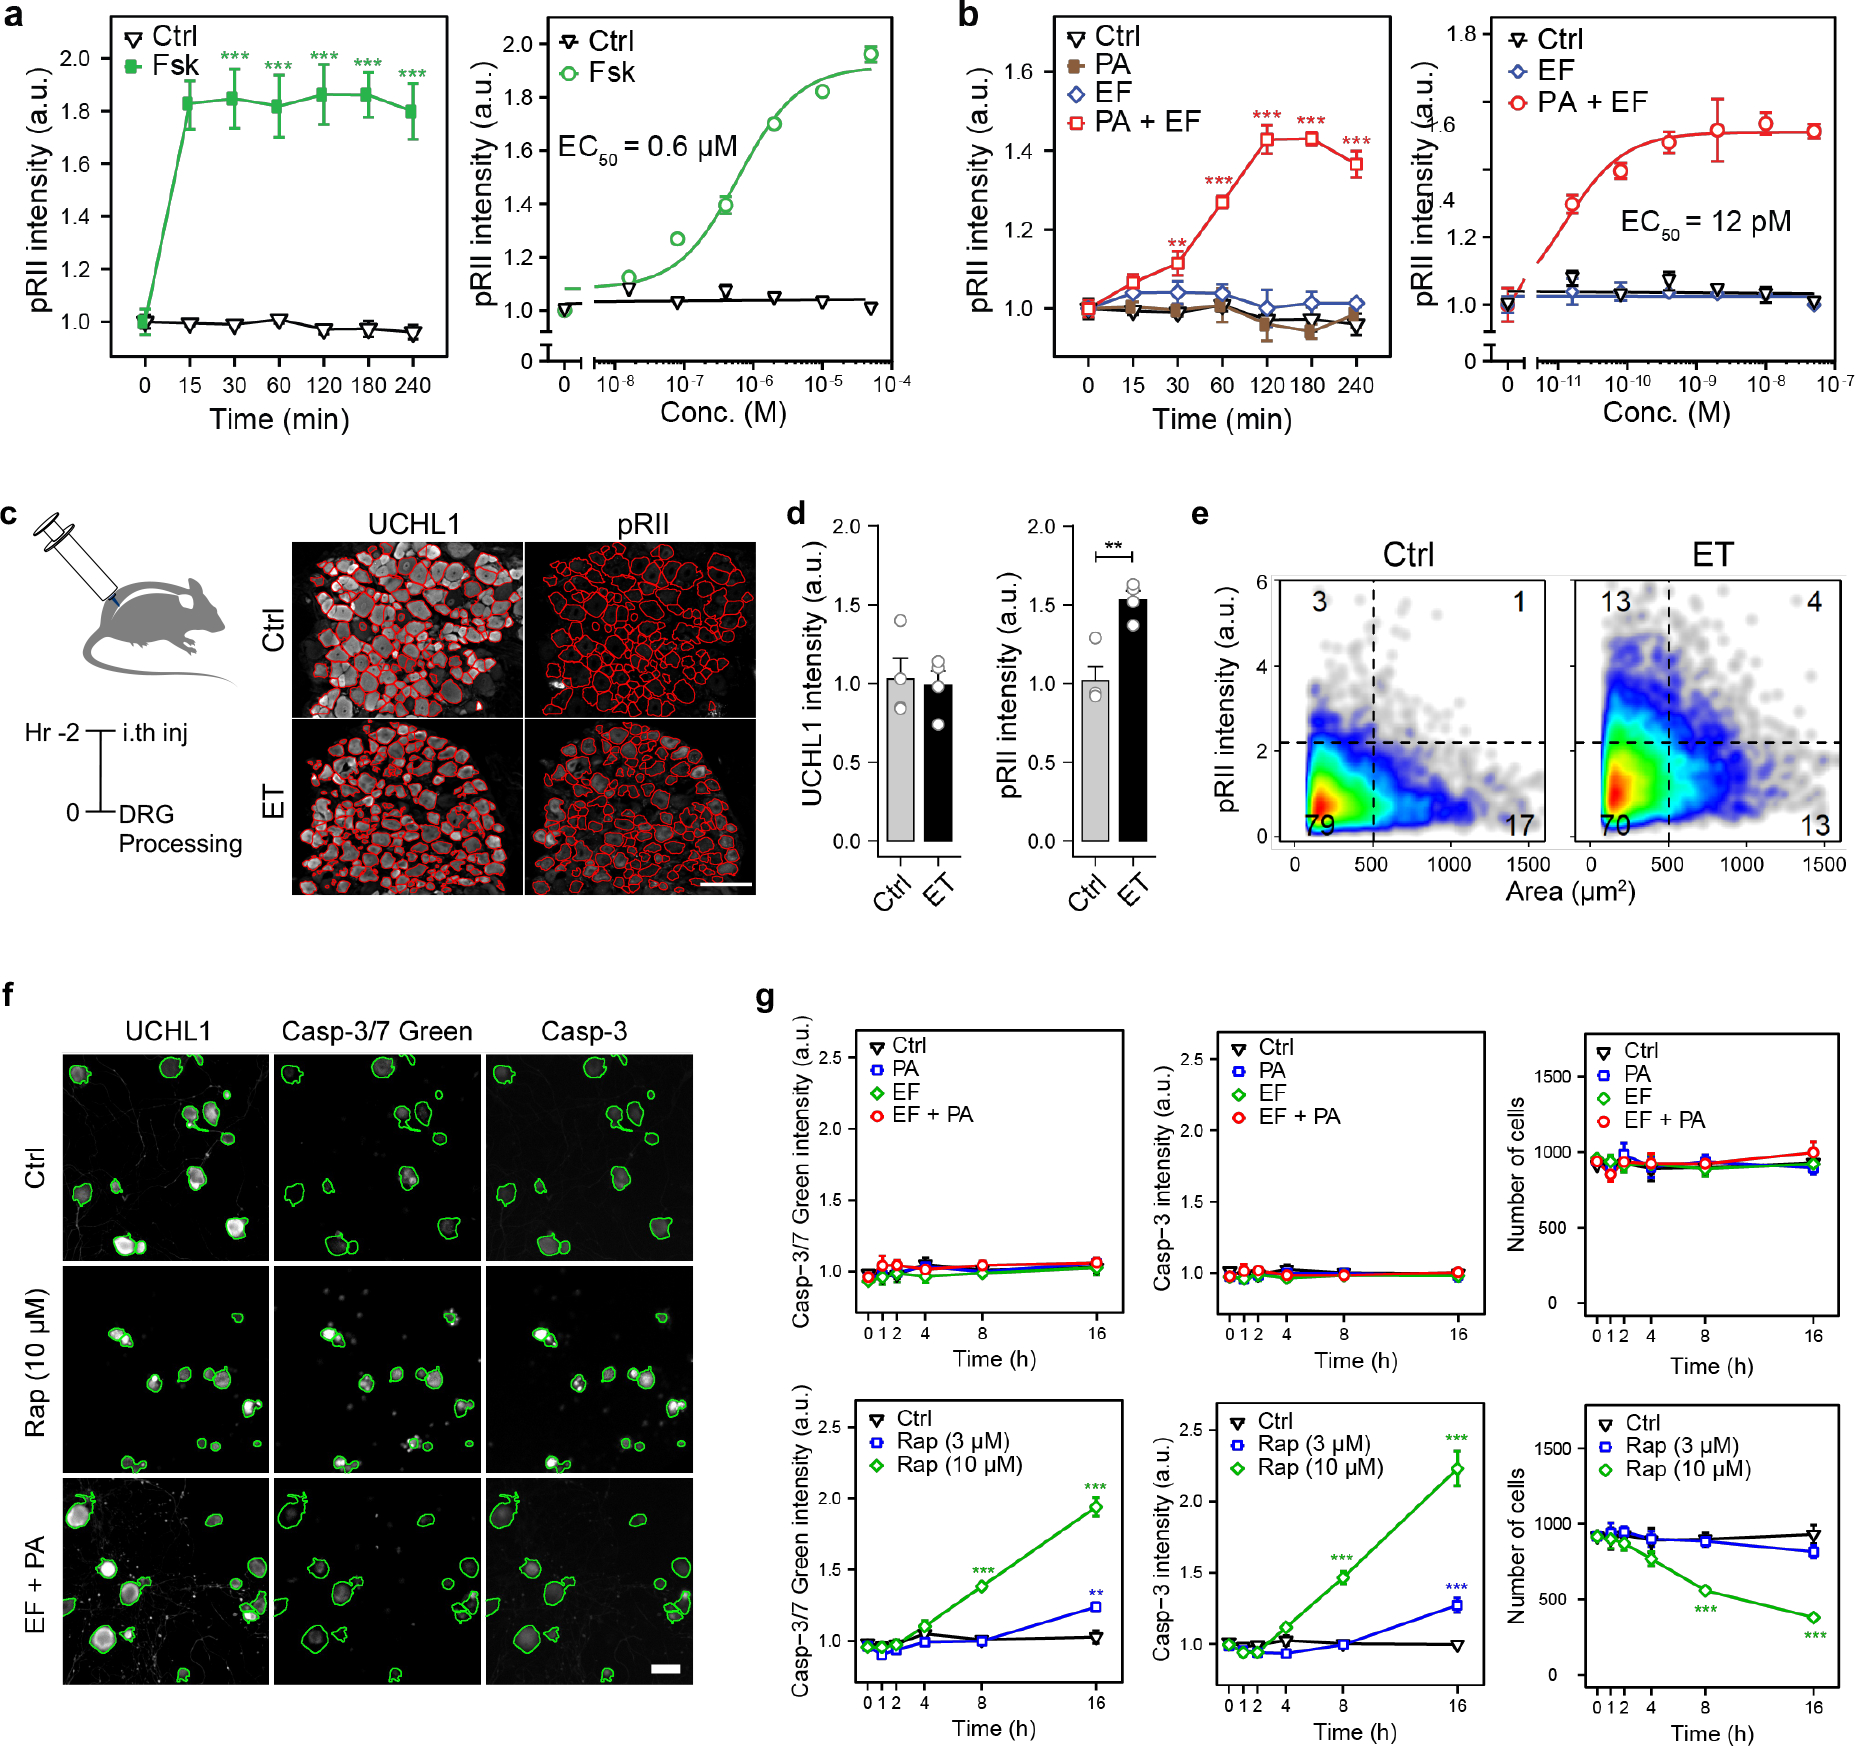
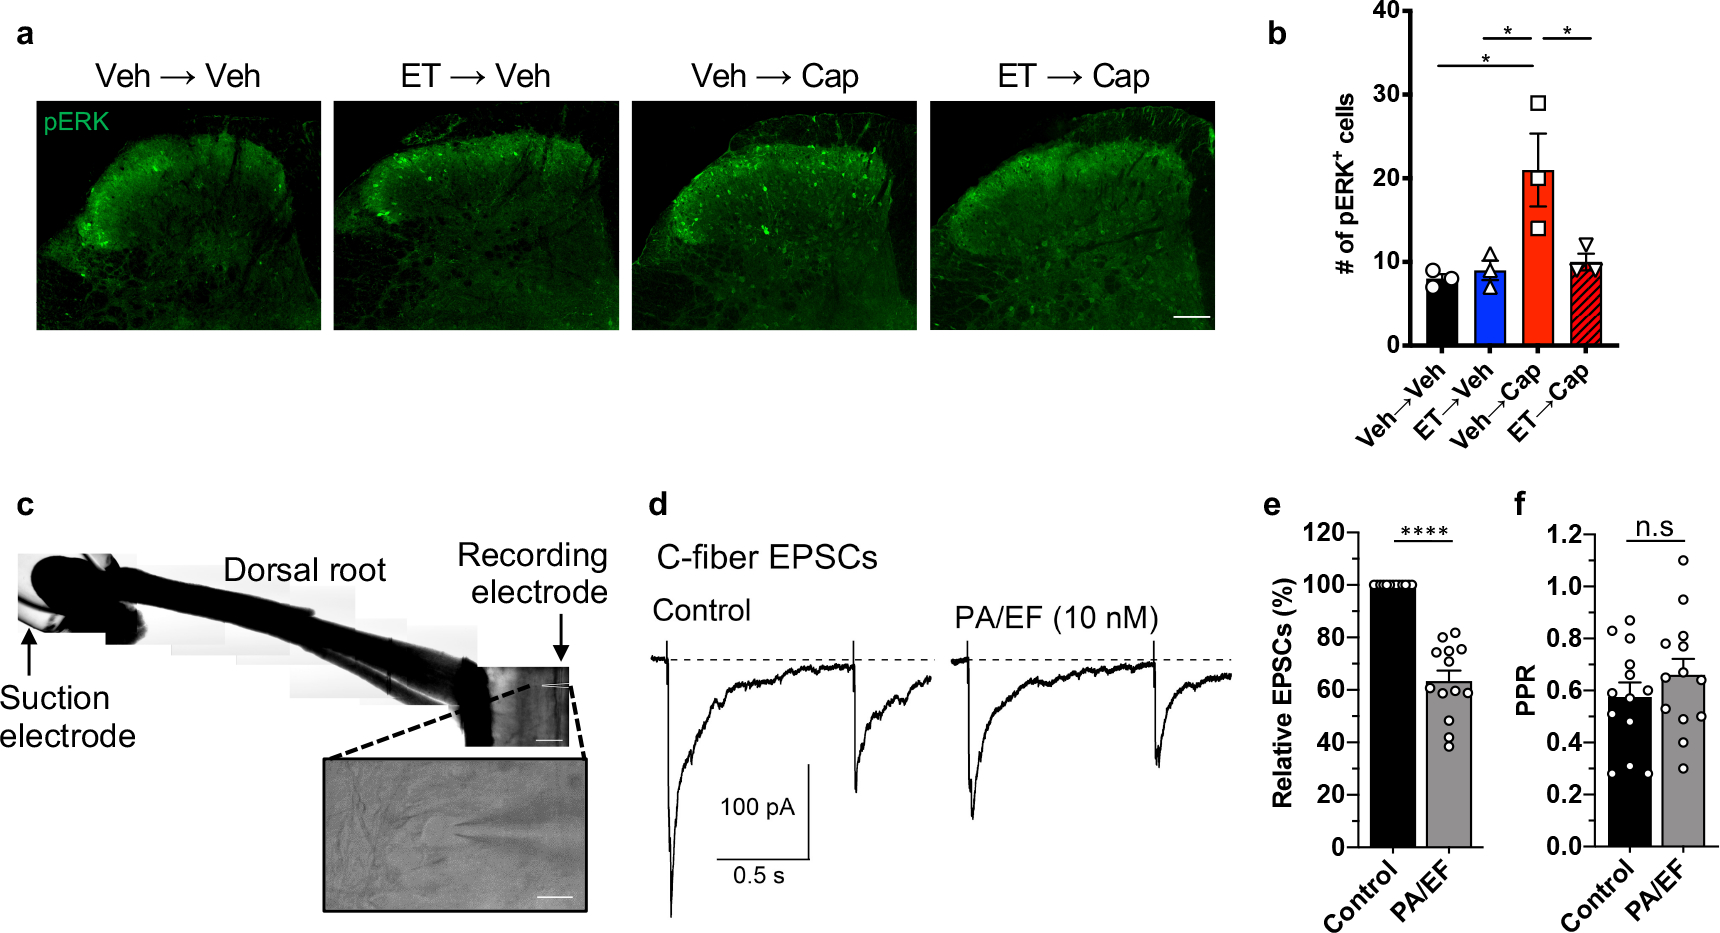
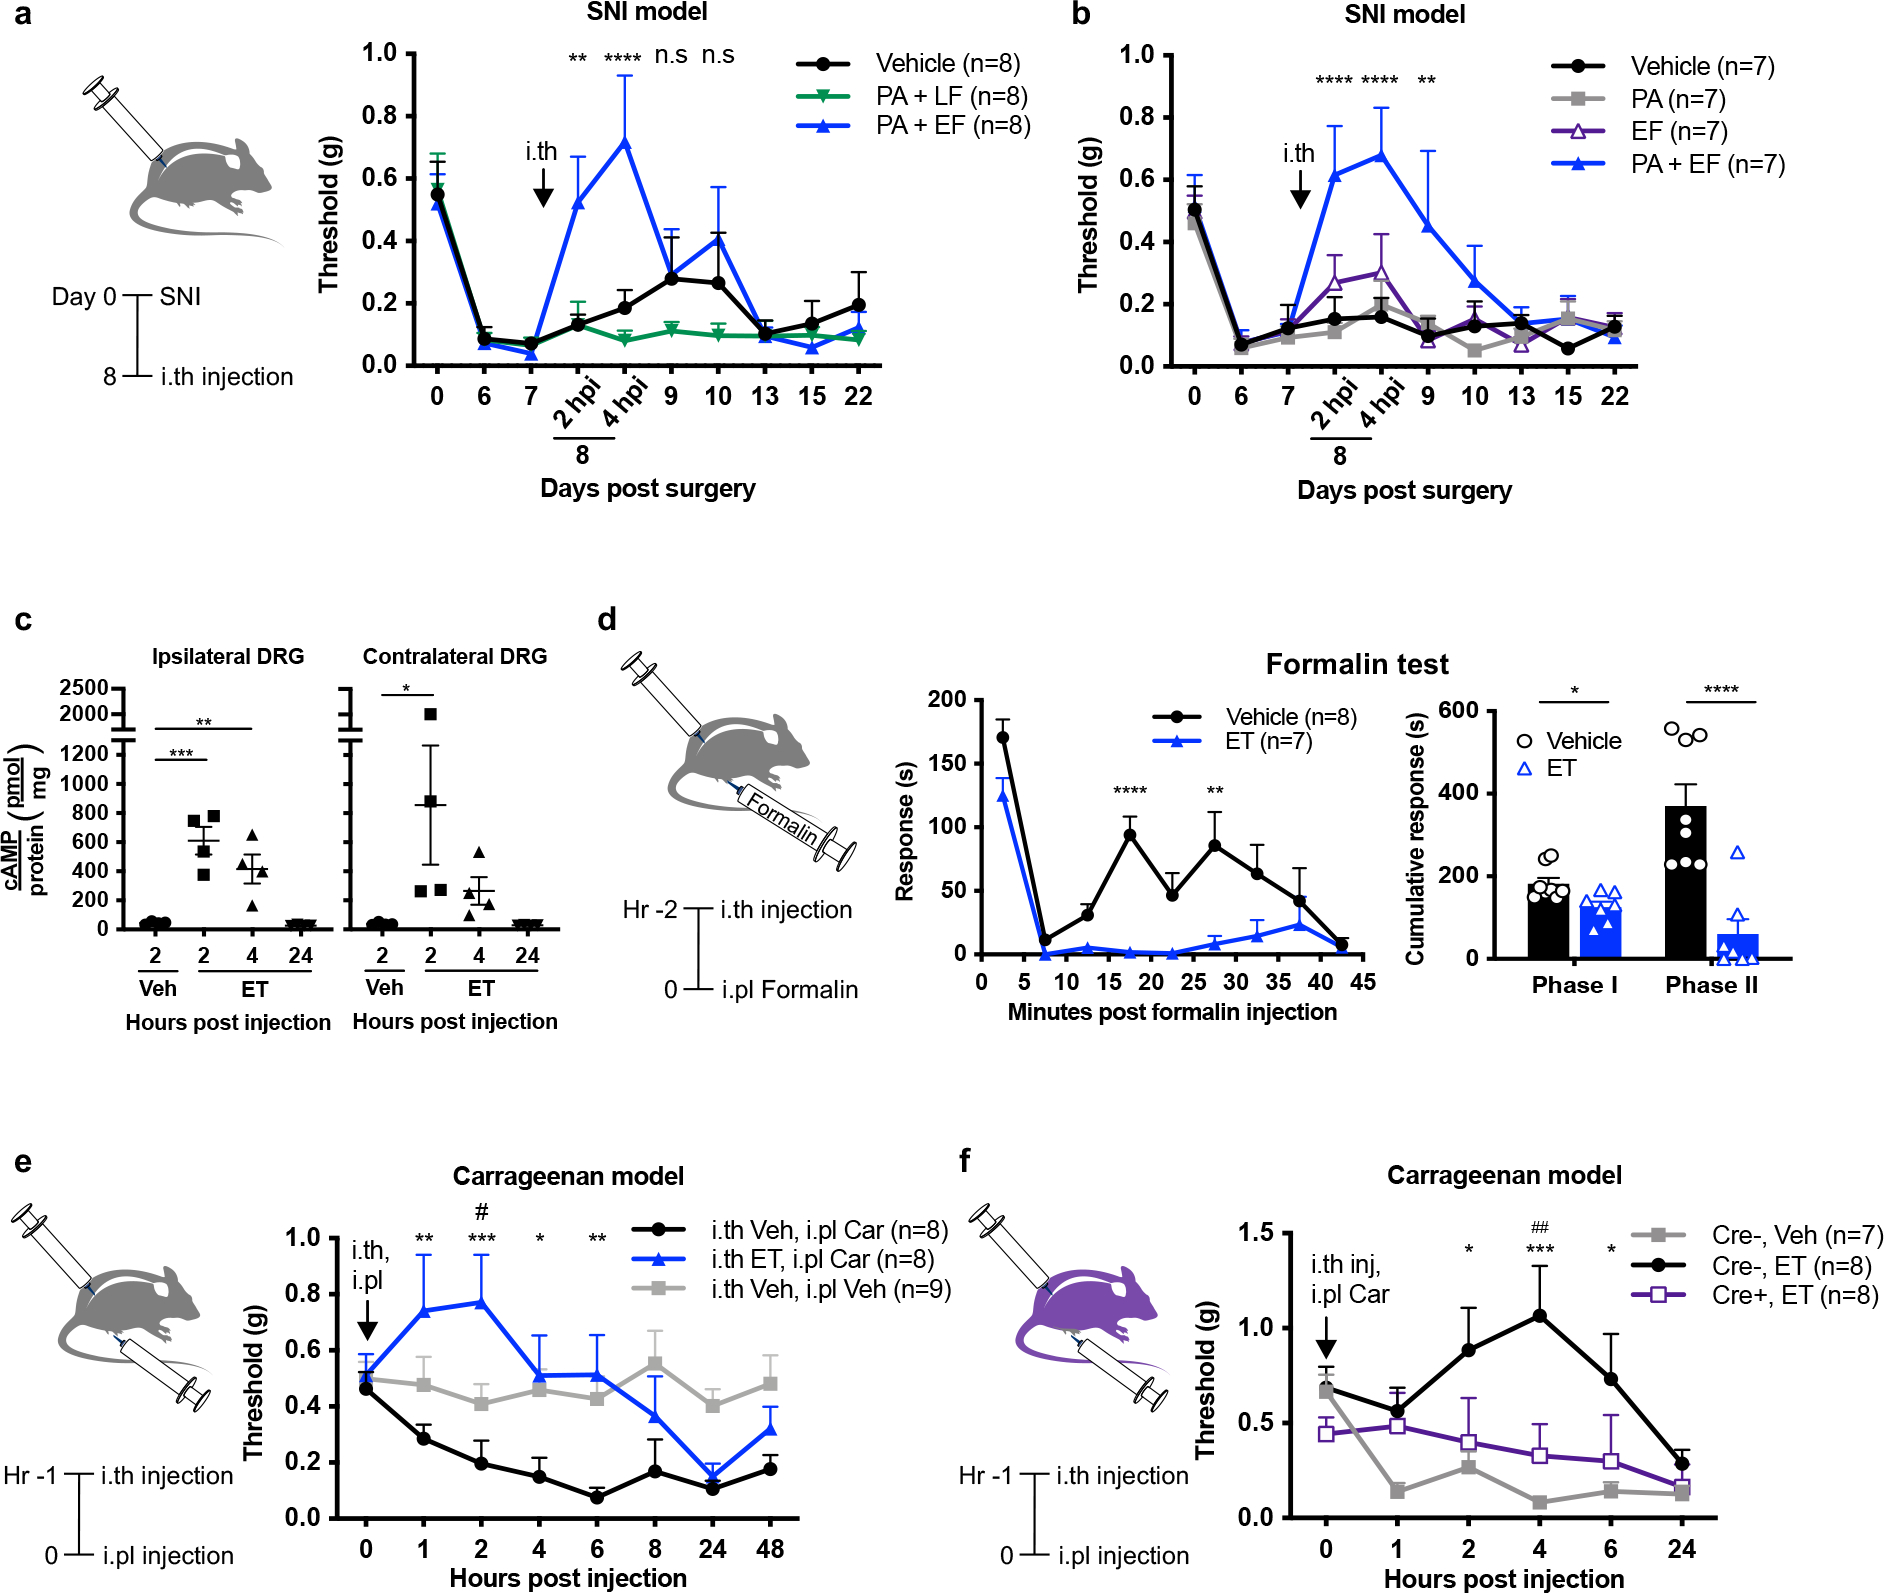
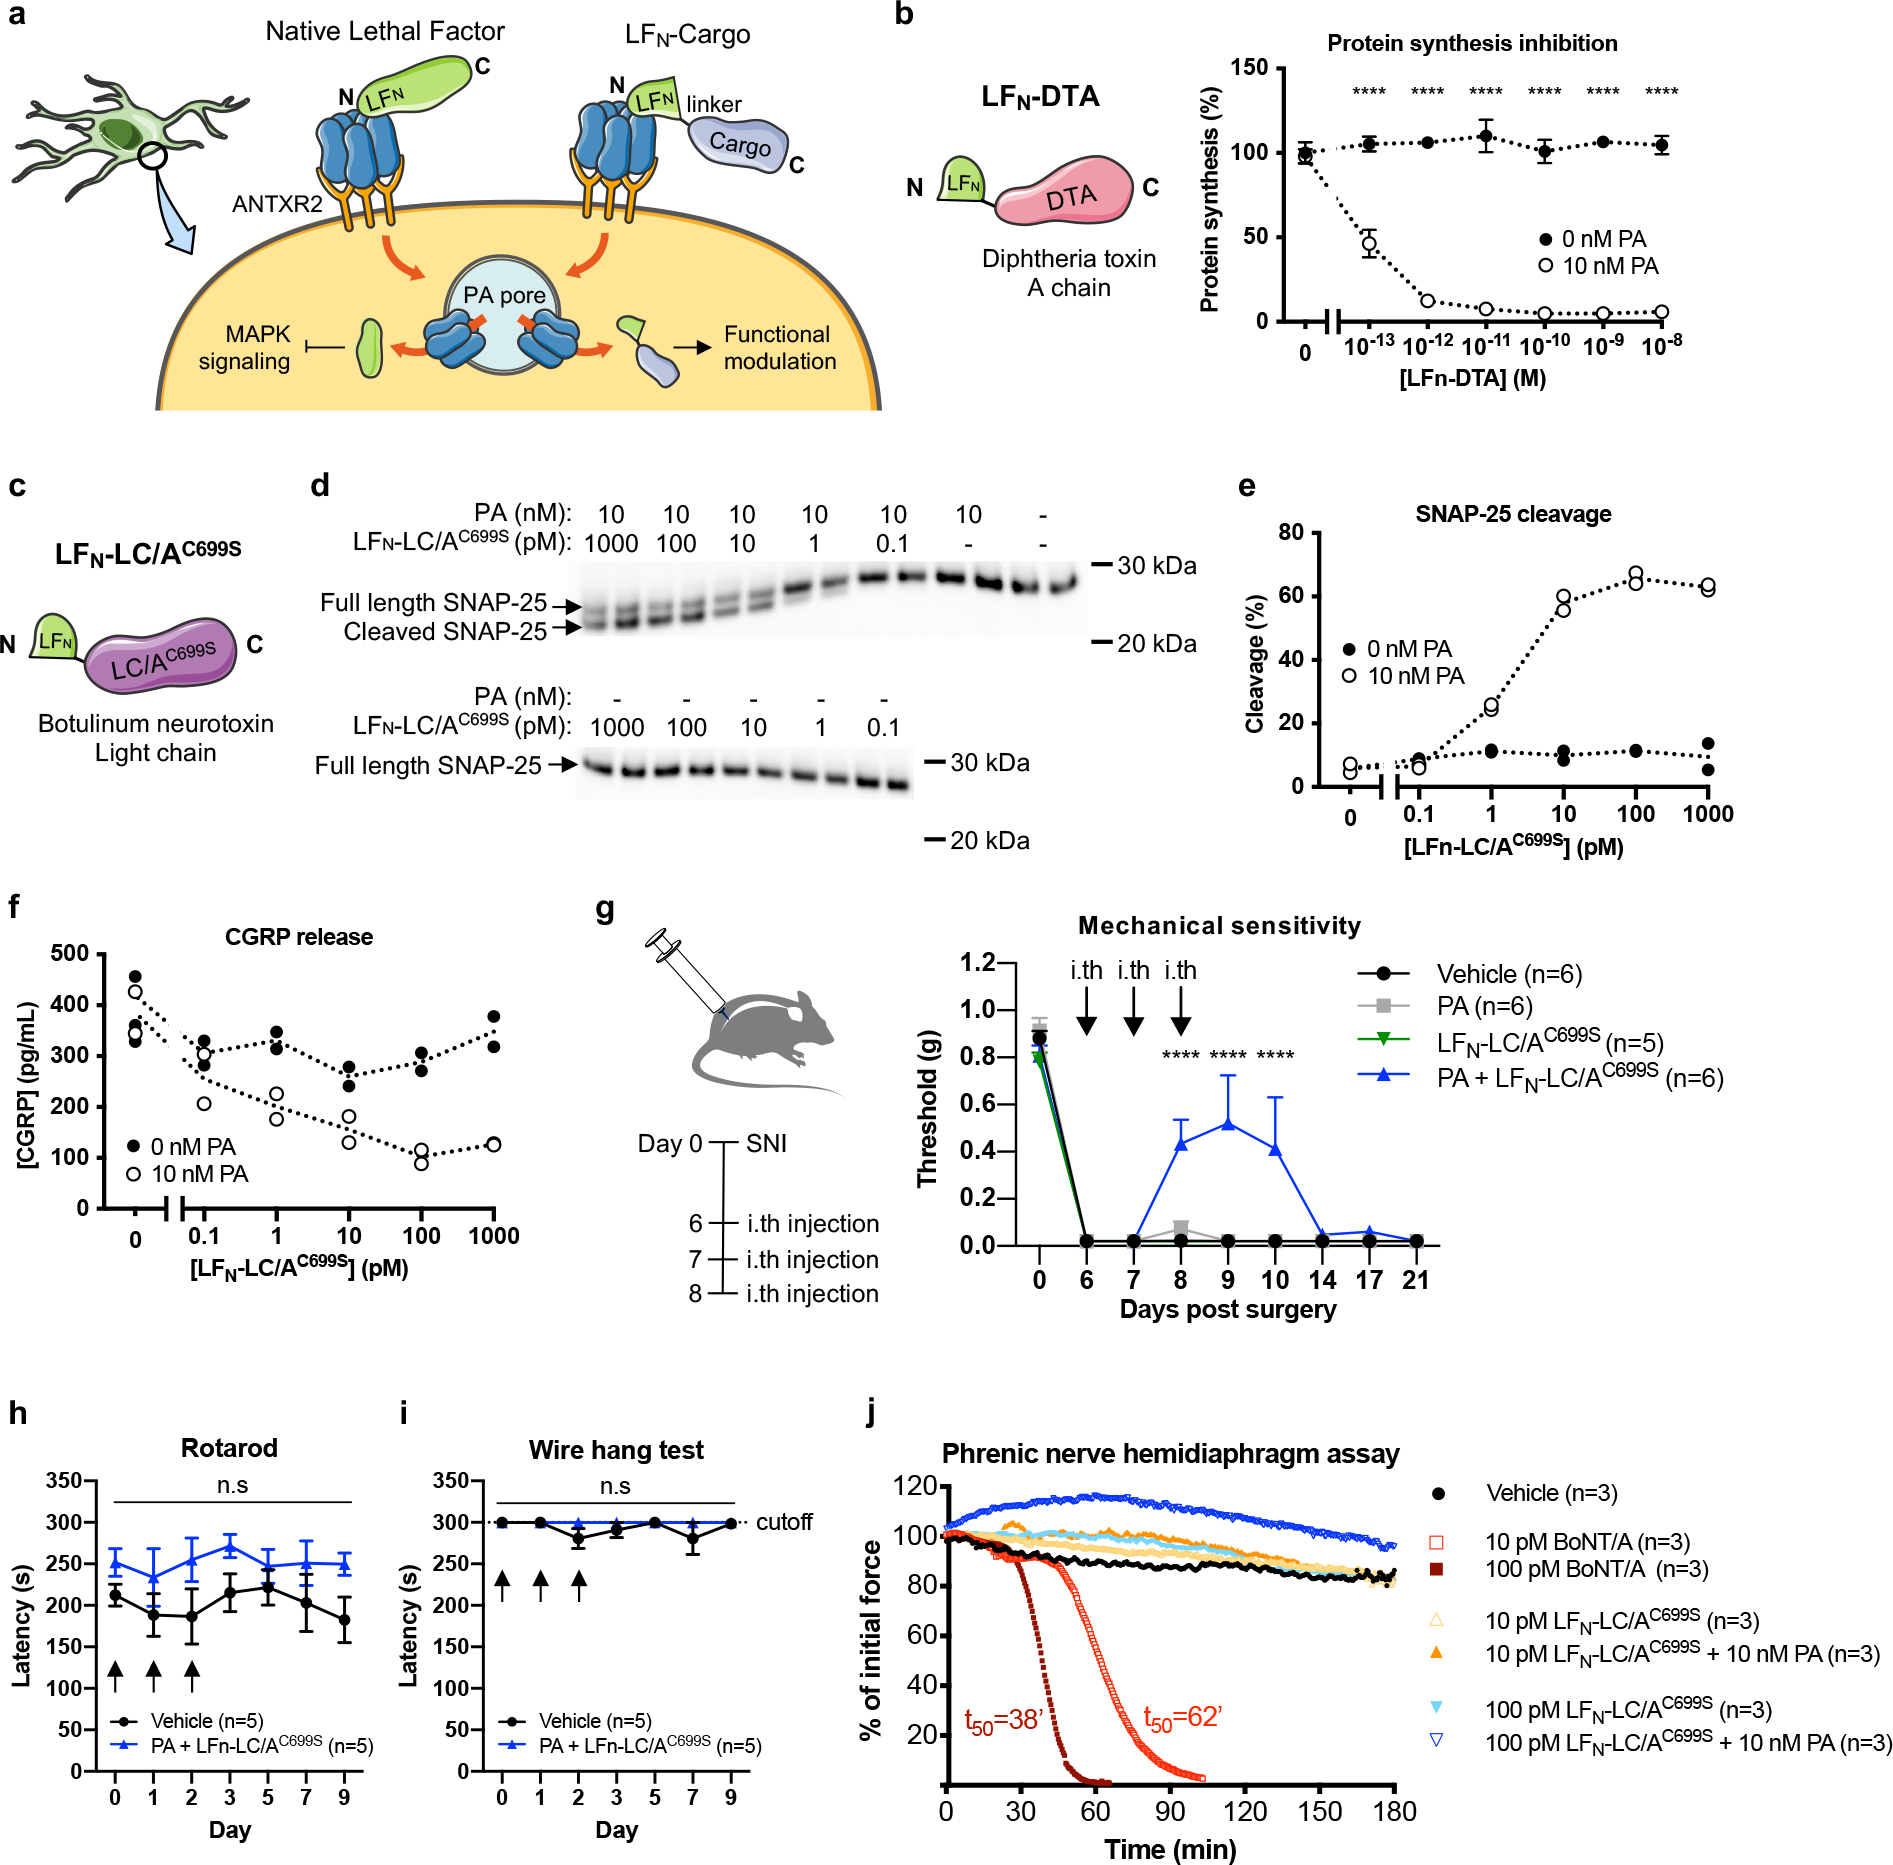
Bacterial products can act on neurons to alter signaling and function. In the present study, we found that dorsal root ganglion (DRG) sensory neurons are enriched for ANTXR2, the high-affinity receptor for anthrax toxins. Anthrax toxins are composed of protective antigen (PA), which binds to ANTXR2, and the protein cargoes edema factor (EF) and lethal factor (LF). Intrathecal administration of edema toxin (ET (PA + EF)) targeted DRG neurons and induced analgesia in mice. ET inhibited mechanical and thermal sensation, and pain caused by formalin, carrageenan or nerve injury. Analgesia depended on ANTXR2 expressed by Nav1.8+ or Advillin+ neurons. ET modulated protein kinase A signaling in mouse sensory and human induced pluripotent stem cell-derived sensory neurons, and attenuated spinal cord neurotransmission. We further engineered anthrax toxins to introduce exogenous protein cargoes, including botulinum toxin, into DRG neurons to silence pain. Our study highlights interactions between a bacterial toxin and nociceptors, which may lead to the development of new pain therapeutics.


Conflict of interest statement

COMPETING INTERESTS

S.M.L., S.P., S.M., J.M., V.T. and K.A.F. are employees of Ipsen. I.M.C. has received sponsored research support from Ipsen, GSK and Allergan Pharmaceuticals, and is a member of scientific advisory boards for GSK and Kintai Pharmaceuticals. This work is related to patent applications PCT/US16/49099 and PCT/US16/49106, “Compositions and methods for treatment of pain,” of which R.J.C., I.M.C., B.L.P., K.A.F., S.P. and S.M.L. are co-inventors. O.B. is a co-founder and shareholder of LIFE & BRAIN GmbH. The remaining authors declare no competing interests.

Figures

Extended Data Figure 1.
Extended Data Figure 1.. Antxr2 but not Antxr1 is enriched in DRG sensory neurons.
Extended Data Figure 2.
Extended Data Figure 2.. Anthrax toxins modulate MAPK and cAMP signaling in DRG sensory neurons.
Extended Data Figure 3.
Extended Data Figure 3.. ET-induced analgesia does not show significant sex-dependent effects.
Extended Data Figure 4.
Extended Data Figure 4.. ANTXR2 ablation from Nav1.8+ neurons attenuates cAMP signaling in DRG culture but causes minimal effects on baseline sensory function.
Extended Data Figure 5.
Extended Data Figure 5.. Intraplantar administration of Edema Toxin induces mechanical allodynia and edema.
Extended Data Figure 6.
Extended Data Figure 6.. Edema Toxin induces PKA signaling in DRG neurons but not non-neuronal cells.
Extended Data Figure 7.
Extended Data Figure 7.. Edema Toxin induces PKA signaling in human iPSC-derived sensory neurons.
Extended Data Figure 8.
Extended Data Figure 8.. Edema Toxin treatment enhances excitability of small-diameter DRG neurons.
Extended Data Figure 9.
Extended Data Figure 9.. Intrathecal administration of ET induces transcriptional changes in the DRG.
Extended Data Figure 10.
Extended Data Figure 10.. ET-induced pain blockade does not show sex-dependent effects in models of pain.
Figure 1.
Figure 1.. Nav1.8+ mouse DRG neurons and human DRG neurons express Antxr2.
(a) Gene expression comparison of FACS-purified DRG neuron subsets. Antxr2 is enriched in Nav1.8-lineage neurons by 5.7-fold (p=5.48×10⁻⁶). (b) Expression of Antxr2 and subgroup markers across sensory neuron subsets from published RNA-seq data. (c) Representative images of in situ hybridization (ISH) analysis of Antxr2 in mouse DRG. Solid and open arrowheads point to neurons with high or low levels of Antxr2 transcripts, respectively. Scale bar, 100 μm (top row) or 35 μm (bottom row). (d) Microarray analysis of Antxr2 expression in sorted DRG neuron subsets (n=3 mice for IB4+Nav1.8+ and IB4Nav1.8+; n=4 mice for Pvalb+). (e) Representative ISH images of Antxr2, Scn10a and Tubb3 (left) or Antxr2, Pvalb and Tubb3 (right) in mouse DRG. Scale bar, 40 μm. (f) Expression of Antxr2, Scn10a and Pvalb were scored in all Tubb3+ neurons (n=15 fields for Scn10a analysis and n=12 fields for Pvalb analysis, both collected across 3 mice.) (g) Antxr2 expression in mouse DRG and brain regions from public microarray data (n=4 samples). (h) Antxr2 expression in adult (P56) brain and juvenile (P4) spinal cord from public ISH data. Bottom row, color map of expression levels. Scale bar, 3000 μm (brain) or 400 μm (spinal cord). (i) Quantitative PCR analysis of Antxr2 expression in mouse DRG and brain regions (n=5 mice). (j) Representative ISH images of human DRG labeled for CALCA, P2RX3, ANTXR2 and DAPI. Lipofuscin that autofluoresced in all 3 channels and appear white in the overlay image is background signal present in all human nervous tissue. (k) Distribution of ANTXR2 across neuronal subpopulations in human DRG (n=603 neurons from 3 donors). (l) Size profile of all ANTXR2+ neurons in human DRG (n=594 neurons from 3 donors). Scale bar, 50 μm. (m) Quantitative PCR analysis of ANTXR2 expression from human DRG RNA (pooled from 4 individuals) and total brain RNA (pooled from 21 individuals) (n=3 technical replicates). Statistical significance was assessed by two-tailed t-test with unequal variances (a), one-way ANOVA with post hoc comparisons (d, g, i) or two-tailed unpaired t-test (m). ***p<0.001, ****p<0.0001. Data represent the mean ± s.e.m. For detailed statistical information, see Supplementary Table 2.
Figure 2.
Figure 2.. Edema toxin intrathecal administration silences mechanical and thermal sensation in mice.
(a) Schematic depicting the intoxication mechanism of anthrax Lethal Toxin (LT) and Edema Toxin (ET). (b) Mechanical sensitivity thresholds after intrathecal administration of vehicle (PBS), PA (2 μg), LT (2 μg PA + 2 μg LF) or ET (2 μg PA + 2 μg EF) (n=8 mice/group). (c) Thermal sensitivity thresholds after intrathecal administration of vehicle (PBS; n=6 mice), PA (2 μg; n=6 mice), LT (2 μg PA + 2 μg LF; n=5 mice) or ET (2 μg PA + 2 μg EF; n=6 mice). (d) Mice were treated with intrathecal vehicle (PBS) or ET (2 ug PA + 2 ug EF) at 0 and 48 hours. Mechanical sensitivity thresholds were monitored the day of and 24 hours after each injection (n=8 mice/group). (e) cAMP levels in lumbar DRG or spinal cord after intrathecal administration of vehicle (PBS; n=6 mice) or ET (2 μg PA + 2 μg EF; n=8 mice for 2 and 4 hpi, n=6 mice for 6 and 24 hpi). (f-j) Mice received intrathecal administration of vehicle (PBS) or ET (2 μg PA + 2 μg EF). Responses were measured at 2 hours post-injection to (f) the hot plate test (50°C, 55°C; n=24 mice), (g) cold plate test (0°C; n=16 mice), (h) pin-prick test (n=8 mice), (i) Randall-Selitto test (n=8 mice) or (j) light touch (n=7 mice). Statistical significance was assessed by two-way RM ANOVA (b, c, d, j) with post hoc comparisons, one-way ANOVA with Dunnett’s post hoc test (e), or two tailed unpaired t-test (f-i). *p<0.05, **p<0.01, ***p<0.001, ****p<0.0001. Data represent the mean ± s.e.m. For detailed statistical information, see Supplementary Table 2.
Figure 3.
Figure 3.. Antxr2 expressed by Nav1.8+ or Advillin+ neurons mediates ET-induced analgesia.
(a) Nav1.8-cre mice were bred with a conditionally targeted allele of Antxr2 in the transmembrane region (Antxr2fl/fl) to generate mice lacking Antxr2 function in Nav1.8 lineage nociceptors. (b) Mechanical sensitivity thresholds in Nav1.8cre/+/Antxr2fl/fl mice (CKO; n=7 mice) or Nav1.8+/+/Antxr2fl/fl littermates (Ctrl; n=7 mice) injected intrathecally with ET (2 μg PA + 2 μg EF). (c) Advillin-creERT2 mice were bred with Antxr2fl/fl mice to generate animals lacking Antxr2 function in all somatosensory neurons. (d) Mechanical sensitivity thresholds in AdvcreERT2/+/Antxr2fl/fl mice (CKO; n=6 mice) or Adv+/+/Antxr2fl/fl littermates (Ctrl; n=8 mice) injected intrathecally with ET (2 μg PA + 2 μg EF). Antxr2 ablation was induced in adult mice by tamoxifen injection two weeks prior to the experiment. (e) Cdh5-cre mice were bred with Antxr2fl/fl mice to generate animals lacking Antxr2 function in endothelial cells. (f) Mechanical sensitivity thresholds in Cdh5cre/+/Antxr2fl/fl conditional KO mice (CKO) injected intrathecally with ET (2 μg PA + 2 μg EF; n=8 mice), or their Cdh5+/+/Antxr2fl/fl littermates (Ctrl) injected intrathecally with vehicle (PBS; n=7 mice) or ET (2 μg PA + 2 μg EF; n=6 mice). ‘*’ compares Ctrl, Veh vs. Ctrl, ET groups. ‘+’ compares Ctrl, Veh vs. CKO, ET groups. (g) LysM-cre mice were bred with Antxr2fl/fl mice to generate animals lacking Antxr2 function in myeloid cells. (h) Mechanical sensitivity thresholds in conditional KO mice (CKO; LysMcre/+/Antxr2fl/fl or LysMcre/cre/Antxr2fl/fl) injected intrathecally with vehicle (PBS; n=6 mice) or ET (2 μg PA + 2 μg EF; n=8 mice), or in control littermates (Ctrl; LysMcre/cre/Antxr2+/+, LysMcre/+/Antxr2+/+ or LysMcre/+/Antxr2fl/+) injected intrathecally with ET (2 μg PA + 2 μg EF; n=8 mice). ‘*’ compares CKO, Veh vs. Ctrl, ET groups. ‘+’ compares CKO, Veh vs. CKO, ET groups. Statistical significance was assessed by two-way RM ANOVA with post hoc comparisons (b, d, f, h). *p<0.05, **p<0.01, ***p<0.001, ****p<0.0001, +p<0.05, ++++p<0.0001. Data represent the mean ± s.e.m. For detailed statistical information, see Supplementary Table 2.
Figure 4.
Figure 4.. Edema Toxin induces PKA signaling in DRG neurons but does not affect neuronal viability.
(a) Time-course (left) and dose response (right) of pRII intensity in DRG neurons stimulated with forskolin (10 μM or 2 h) (n=3 experiments, >2500 neurons/condition). (b) (Left) Time-course of pRII intensity in DRG neurons stimulated with Ctrl (0.1% BSA), PA (10 nM), EF (10 nM) or the combination of both factors. (Right) Dose-response curve of pRII intensity in DRG neurons stimulated with EF (0 – 50 nM, 2 h) in the presence of a constant concentration of PA (10 nM) (n=3 experiments, >2500 neurons/condition). (c) Representative images of frozen L3 - L6 DRG sections obtained from mice 2 h post intrathecal injection of vehicle (PBS) or ET (2 μg PA + 2 μg EF). The red lines indicate the mask used to quantify signal intensities in DRG neurons. Scale bar, 100 μm. (d) Mean UCHL1 and pRII intensities quantified in DRG sections of the respective mice (n=4 mice/group, 15 – 20 images of 4 non-consecutive sections/animal, 1951 ± 279 neurons/animal). (e) Single cell data of the quantified DRG neurons. (f) Representative images of mouse DRG neurons stimulated with solvent control (Ctrl), raptinal (Rap; 3 or 10 μM) or ET (10 nM PA + 10 nM EF) for 16 h. Cultures were stained for UCHL1, caspase-3/7 green detection reagent, and cleaved caspase 3. The cells were fixed about 1 hour after adding the caspase-3/7 dye, stained with a standard ICC protocol, and analyzed by HCS microscopy. Green encircled neurons indicate automatically selected objects, respectively (see Methods section). Scale bar, 50 μm. (g) Time-course of caspase-3/7 green detection reagent, cleaved caspase 3 intensity and corresponding cell numbers per analyzed well (n=4 experiments). Statistical significance was assessed by two-way ANOVA with Bonferroni’s post hoc test (a, b, g) or two-tailed unpaired t-test (d). **p<0.01, ***p<0.001. Data represent the mean ± s.e.m. For detailed statistical information, see Supplementary Table 2.
Figure 5.
Figure 5.. Edema Toxin attenuates neurotransmission at nociceptor central terminals.
(a, b) Mice received intrathecal injection of vehicle or ET (2 μg PA + 2 μg EF), followed by intrathecal injection of vehicle or capsaicin (1 μg) after 2 hours. Spinal cords were harvested after 20 min and stained for pERK. (a) Representative images of pERK staining in the dorsal horn. Scale bar, 100 μm. (b) Quantification of the number of pERK-positive cells in the superficial laminae of the dorsal horn. 8–12 sections were quantified and averaged per animal (n=3 mice). (c) Representative horizontal spinal cord slice preparation with the attached L4 dorsal root and a lamina I neuron (inset). Scale bar, 500 μm and 20 μm (inset). (d) C-fiber EPSCs elicited in a lamina I neuron by stimulation of the L4 dorsal root (paired 400 μA stimuli at a 1 s interval). The measured conduction velocity was 0.7 m/s, consistent with C-fiber activation. (e, f) Collected results (n=13 cells). (e) Application of ET (10 nM PA + 10 nM EF) reduced the first EPSC by 37±4 %. (f) No significant changes were observed in the paired pulse ratio. Statistical significance was assessed by one-way ANOVA with Tukey’s post hoc test (b) or two-tailed paired t-test (e, f). n.s, not significant, *p<0.05, ****p<0.0001. Data represent the mean ± s.e.m. For detailed statistical information, see Supplementary Table 2.
Figure 6.
Figure 6.. Anthrax Edema Toxin silences pain in mouse models of neuropathic and inflammatory pain.
(a) Mechanical sensitivities in SNI mice injected intrathecally with vehicle (PBS), LT (2 μg PA + 2 μg LF) or ET (2 μg PA + 2 μg EF) (n=8 mice/group). ‘*’ compares vehicle and ET groups. (b) Mechanical sensitivities in SNI mice injected intrathecally with vehicle (PBS), PA (2 μg), EF (2 μg) or ET (2 μg PA + 2 μg EF) (n=7 mice/group). ‘*’ compares vehicle and ET groups. (c) cAMP levels in the ipsilateral or contralateral DRGs (L3 – L5) of SNI mice injected intrathecally with vehicle (PBS) or ET (2 μg PA + 2 μg EF) (n=4 mice/group). (d) Mice were given intrathecal injection of vehicle (PBS; n=8 mice) or ET (2 μg PA + 2 μg EF; n=7 mice) 2 h prior to intraplantar injection of 5% formalin. (Left) Acute pain-like behaviors measured in 5 min intervals. (Right) Cumulative responses during Phase I (0 – 5 min) or Phase II (15 – 35 min). (e) Mechanical sensitivities in mice injected intrathecally with vehicle (PBS) or ET (2 μg PA + 2 μg EF) 1 h prior to intraplantar injection of vehicle (0.9% saline) or 2% carrageenan (Car). (n=8 mice for i.th Veh, i.pl Car and i.th ET, i.pl Car groups; n=9 mice for i.th Veh, i.pl Veh). ‘*’ compares i.th Veh, i.pl Car vs. i.th ET, i.pl Car groups. ‘#’ compares i.th Veh, i.pl Veh vs. i.th ET, i.pl Car groups. (f) Mechanical sensitivities in Nav1.8cre/+/Antxr2fl/fl (Cre+) mice or Nav1.8+/+/Antxr2fl/fl (Cre) littermates injected intrathecally with vehicle (PBS) or ET (2 μg PA + 2 μg EF) 1 h prior to intraplantar injection of 2% carrageenan (Car). (n=7 mice for Cre, Veh; n=8 mice for Cre, ET and Cre+, ET groups). ‘*’ compares Cre, Veh vs. Cre, ET groups. ‘#’ compares Cre, ET vs. Cre+, ET groups. Statistical significance was assessed by two-way RM ANOVA with post hoc comparisons (a, b, d-left, e, f), one-way ANOVA with Dunnett’s post hoc test (c), or two-tailed unpaired t-test (d-right). n.s, not significant, *p<0.05, **p<0.01, ***p<0.001, ****p<0.0001, #p<0.05, ##p<0.01. Data represent the mean ± s.e.m. For detailed statistical information, see Supplementary Table 2.
Figure 7.
Figure 7.. Engineered anthrax toxins deliver molecular cargo into DRG sensory neurons and block pain in vivo.
(a) Schematic of exogenous cargo delivery into neurons by the PA + LFN system. (b) (Left) Design of LFN-DTA linking the N terminal domain of LF (LFN) to the A chain of diphtheria toxin (DTA). (Right) Protein synthesis levels in DRG cultures following 6 h treatment with the indicated concentrations of LFN-DTA ± PA (10 nM) (n=3 experiments). Data represent the mean ± s.e.m. (c) Design of LFN-LC/AC699S linking the N terminal domain of LF (LFN) to a mutated light chain (LC) of type A botulinum neurotoxin (LC/AC699S). (d-f) DRG cultures were treated with the indicated concentrations of LFN-LC/AC699S ± PA (10 nM) for 24 h and stimulated with 80 mM KCl for 10 min (n=2 wells/condition). Dotted lines connect the means. (d) SNAP-25 cleavage in cell lysates measured by western blot. Estimated molecular weight markers are shown. (e) Percent cleavage was calculated using band intensities with the following formula: cleaved/(intact + cleaved). (f) CGRP release in the supernatant. (g) Mechanical sensitivity thresholds in SNI mice that received three daily intrathecal injection of vehicle (PBS; n=6 mice), PA only (500 ng; n=6 mice), LFN-LC/AC699S only (200 ng; n=5 mice) or PA + LFN-LC/AC699S (500 ng + 200 ng; n=6 mice). Data represent the mean ± s.e.m. (h, i) Mice received three daily intrathecal injection of vehicle (PBS) or PA + LFN-LC/AC699S (500 ng + 200 ng) starting on Day 0 (n=5 mice/group) and were monitored by the rotarod test (h) or wire hang test (i). Data represent the mean ± s.e.m. (j) The effects of BoNT/A, LFN-LC/AC699S alone and PA + LFN-LC/AC699S tested on an ex vivo mouse phrenic nerve hemidiaphragm (mPNHD) preparation (n=3 experiments). Data represent the mean. Statistical significance was assessed by two-way ANOVA with Sidak’s post hoc test (b) or two-way RM ANOVA with post hoc comparisons (g, h, i). n.s, not significant, ****p<0.0001. For detailed statistical information, see Supplementary Table 2.

Comment in

  • Harnessing bacterial toxins to treat pain.
    Perez-Sanchez J, Bennett DL. Perez-Sanchez J, et al. Nat Neurosci. 2022 Feb;25(2):132-134. doi: 10.1038/s41593-021-00981-8. Nat Neurosci. 2022. PMID: 34931071 No abstract available.

References

    1. Basbaum AI, Bautista DM, Scherrer G & Julius D Cellular and Molecular Mechanisms of Pain. Cell 139, 267–284 (2009). - PMC - PubMed
    1. Deng L & Chiu IM Microbes and pain. PLoS Pathog. 17, e1009398 (2021). - PMC - PubMed
    1. Chiu IM et al. Transcriptional profiling at whole population and single cell levels reveals somatosensory neuron molecular diversity. eLife 3, e04660 (2014). - PMC - PubMed
    1. Zeisel A et al. Molecular Architecture of the Mouse Nervous System. Cell 174, 999–1014.e22 (2018). - PMC - PubMed
    1. Sharma N et al. The emergence of transcriptional identity in somatosensory neurons. Nature 577, 392–398 (2020). - PMC - PubMed

REFERENCES FOR METHODS

    1. Wu C, Macleod I & Su AI BioGPS and MyGene.info: organizing online, gene-centric information. Nucleic Acids Res. 41, D561–565 (2013). - PMC - PubMed
    1. Su AI et al. A gene atlas of the mouse and human protein-encoding transcriptomes. Proc. Natl. Acad. Sci. 101, 6062–6067 (2004). - PMC - PubMed
    1. Lattin JE et al. Expression analysis of G Protein-Coupled Receptors in mouse macrophages. Immunome Res. 4, 5 (2008). - PMC - PubMed
    1. Lein ES et al. Genome-wide atlas of gene expression in the adult mouse brain. Nature 445, 168–176 (2007). - PubMed
    1. Abrahamsen B et al. The Cell and Molecular Basis of Mechanical, Cold, and Inflammatory Pain. Science 321, 702–705 (2008). - PubMed

Publication types