. 2022 Jul;6(7):882-897.
doi: 10.1038/s41551-021-00815-9. Epub 2021 Dec 20.

Genetically engineered and enucleated human mesenchymal stromal cells for the targeted delivery of therapeutics to diseased tissue

Affiliations

Genetically engineered and enucleated human mesenchymal stromal cells for the targeted delivery of therapeutics to diseased tissue

Huawei Wang et al. Nat Biomed Eng. 2022 Jul.

Abstract

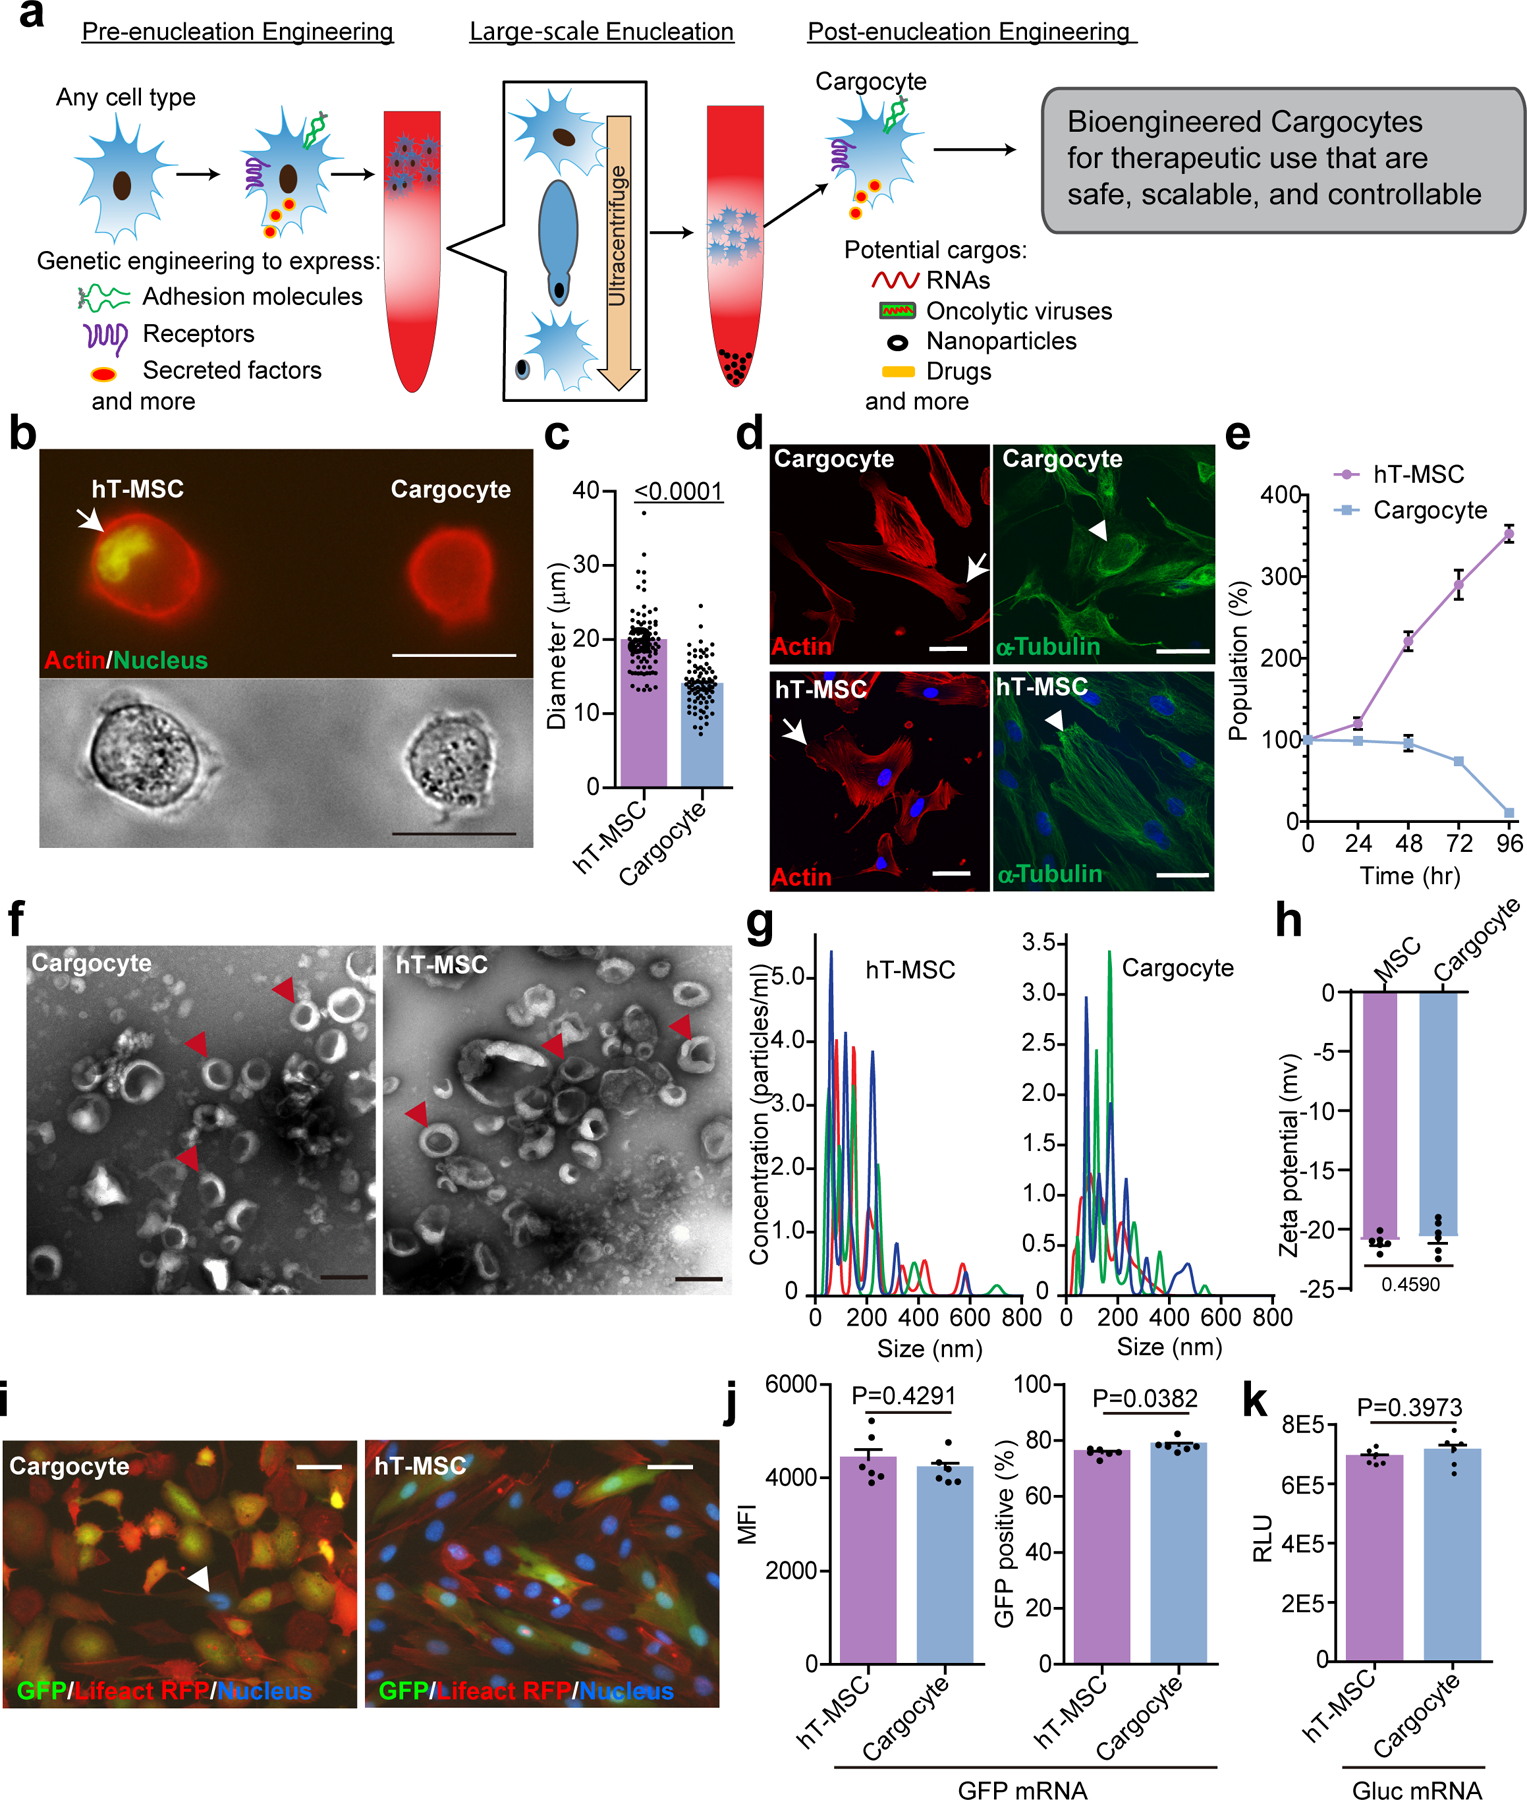
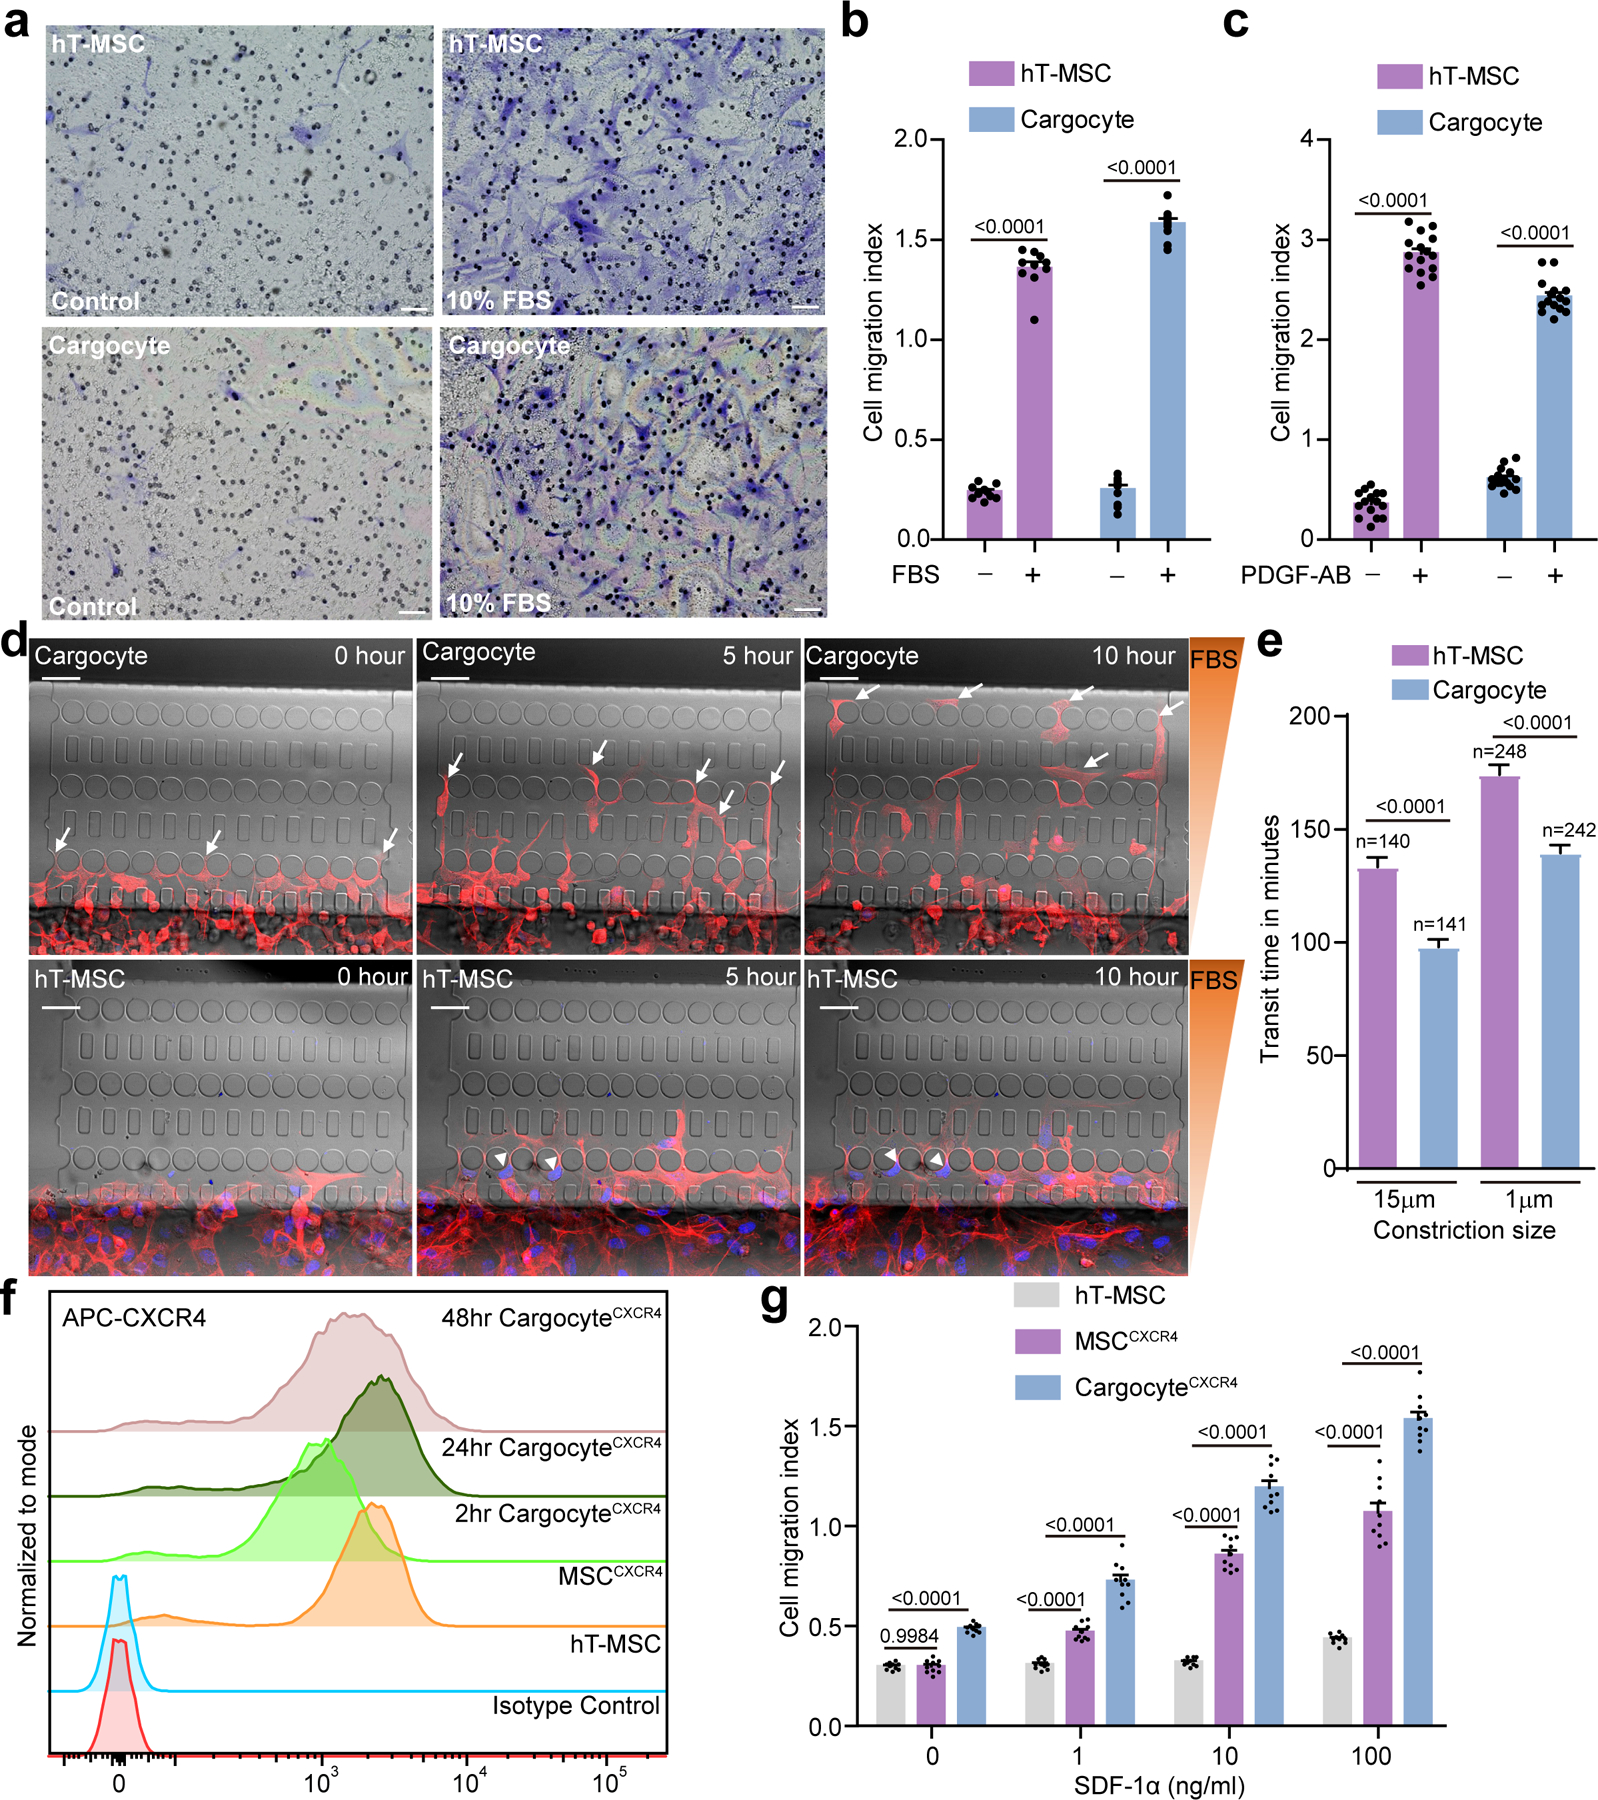
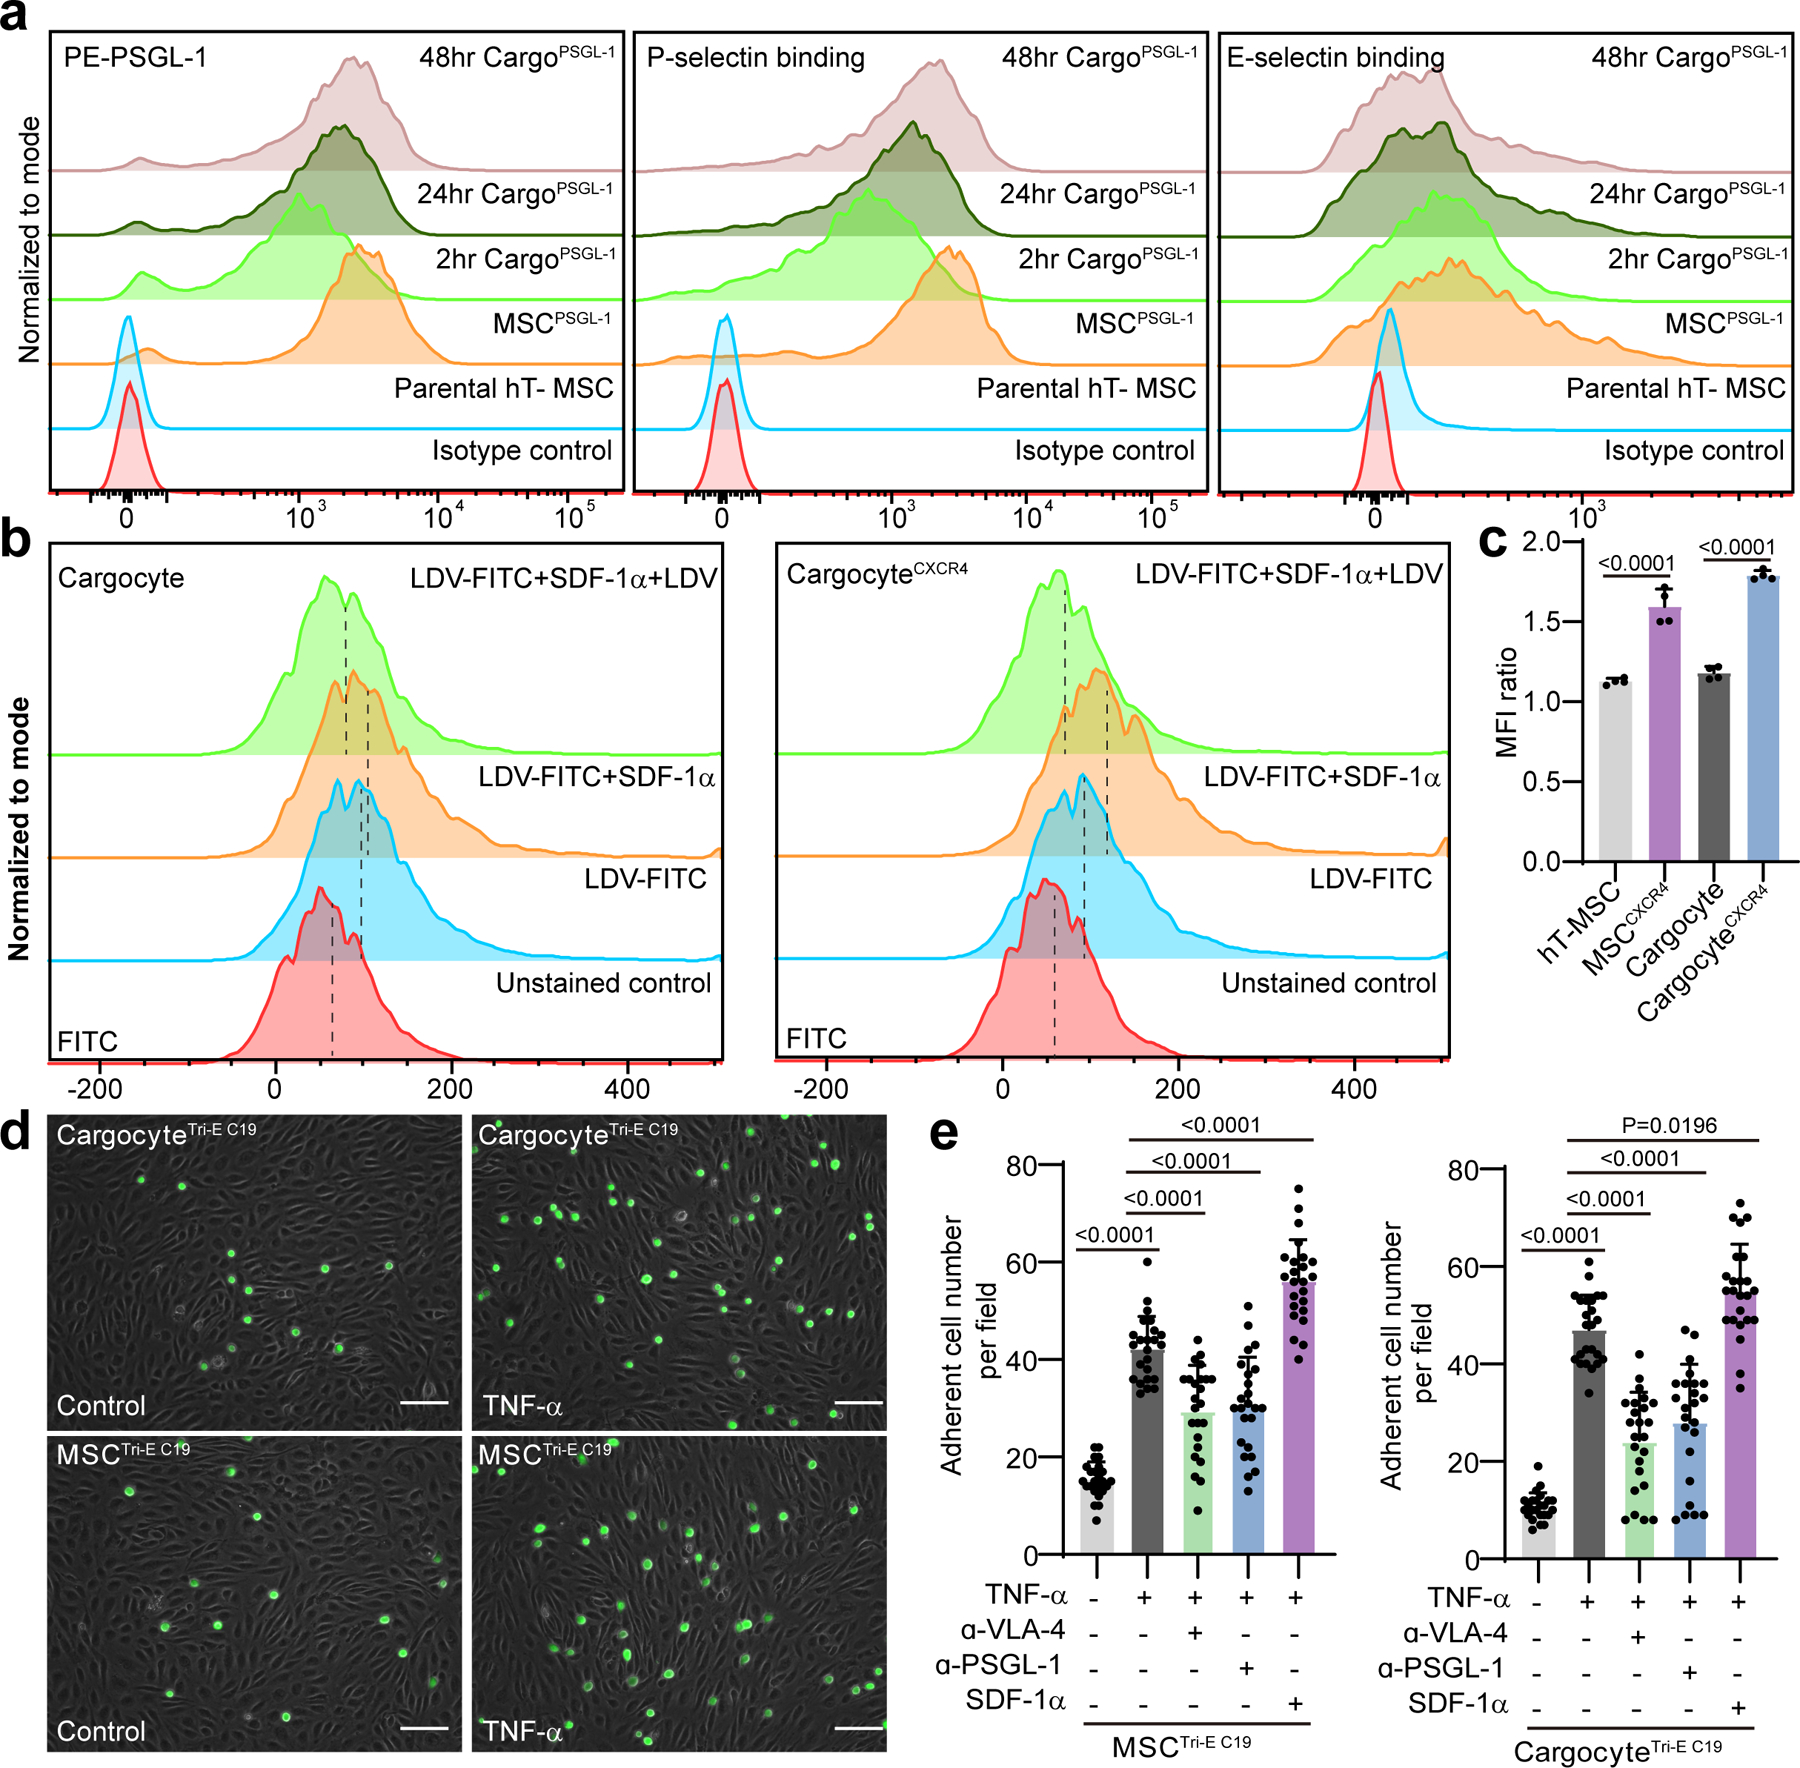
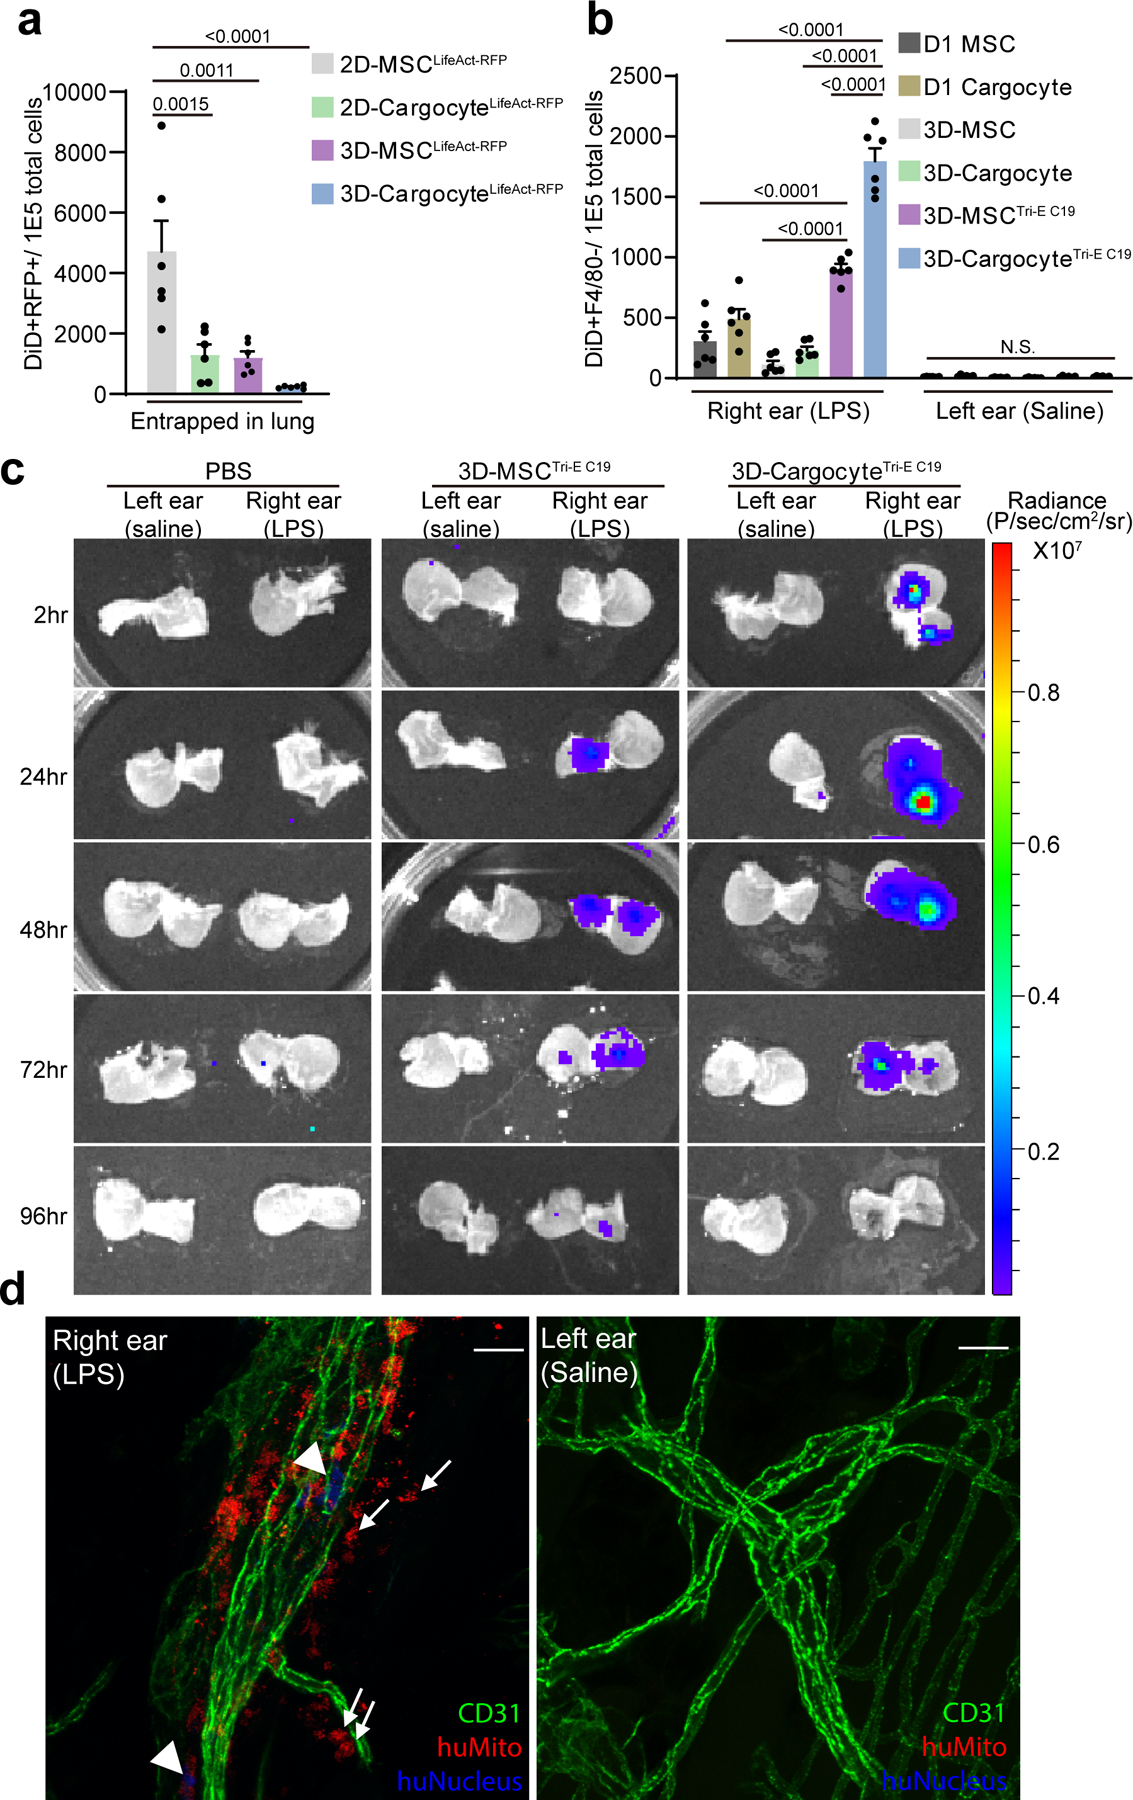
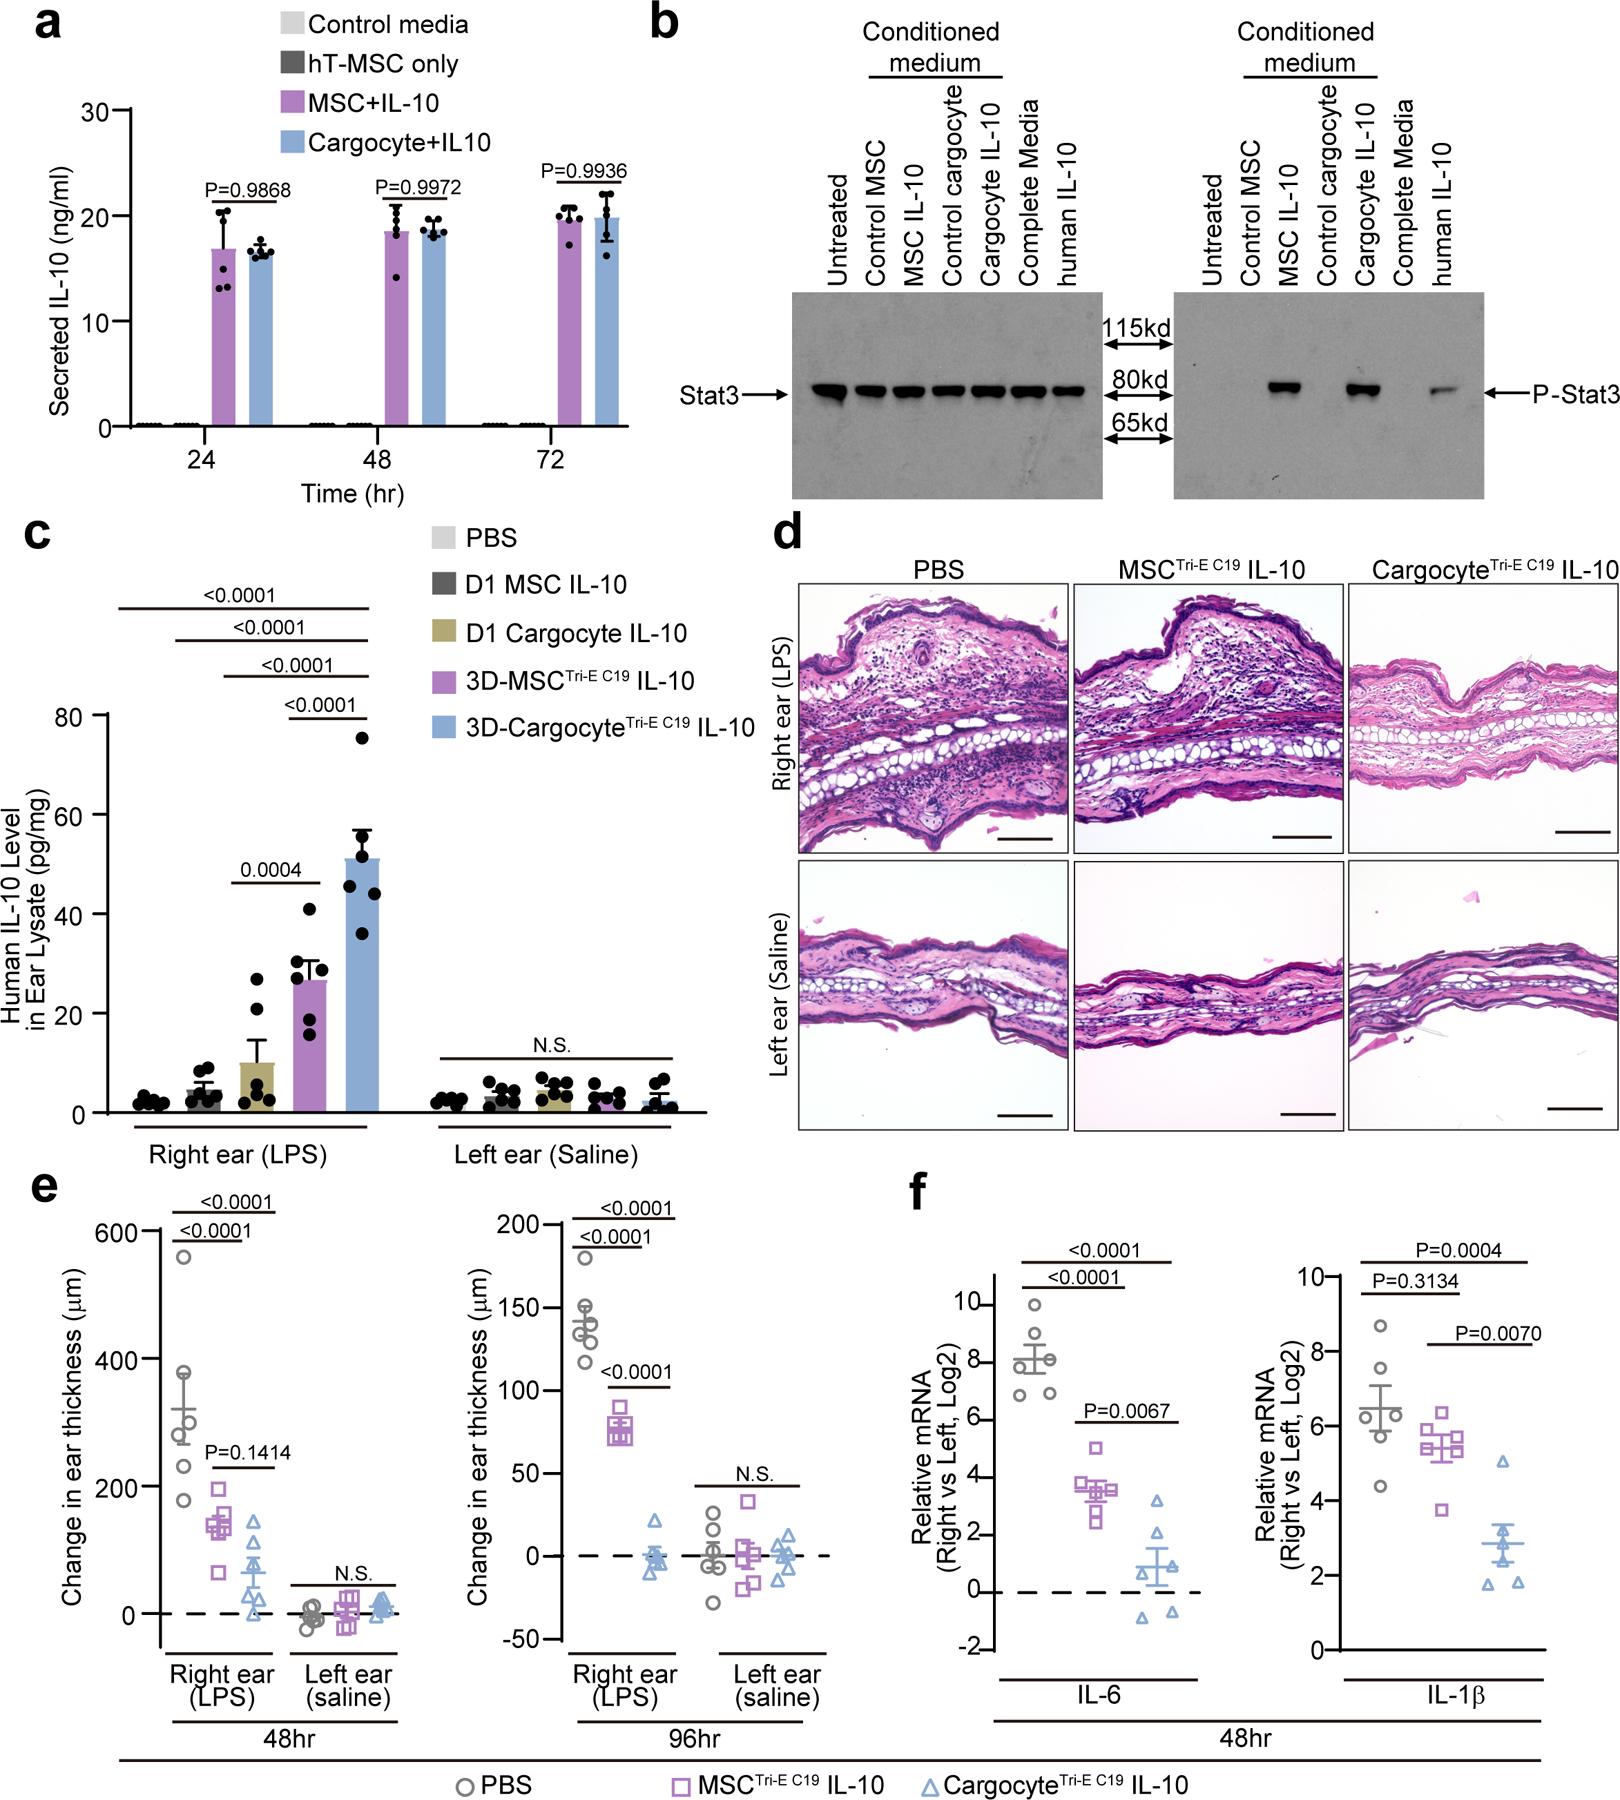
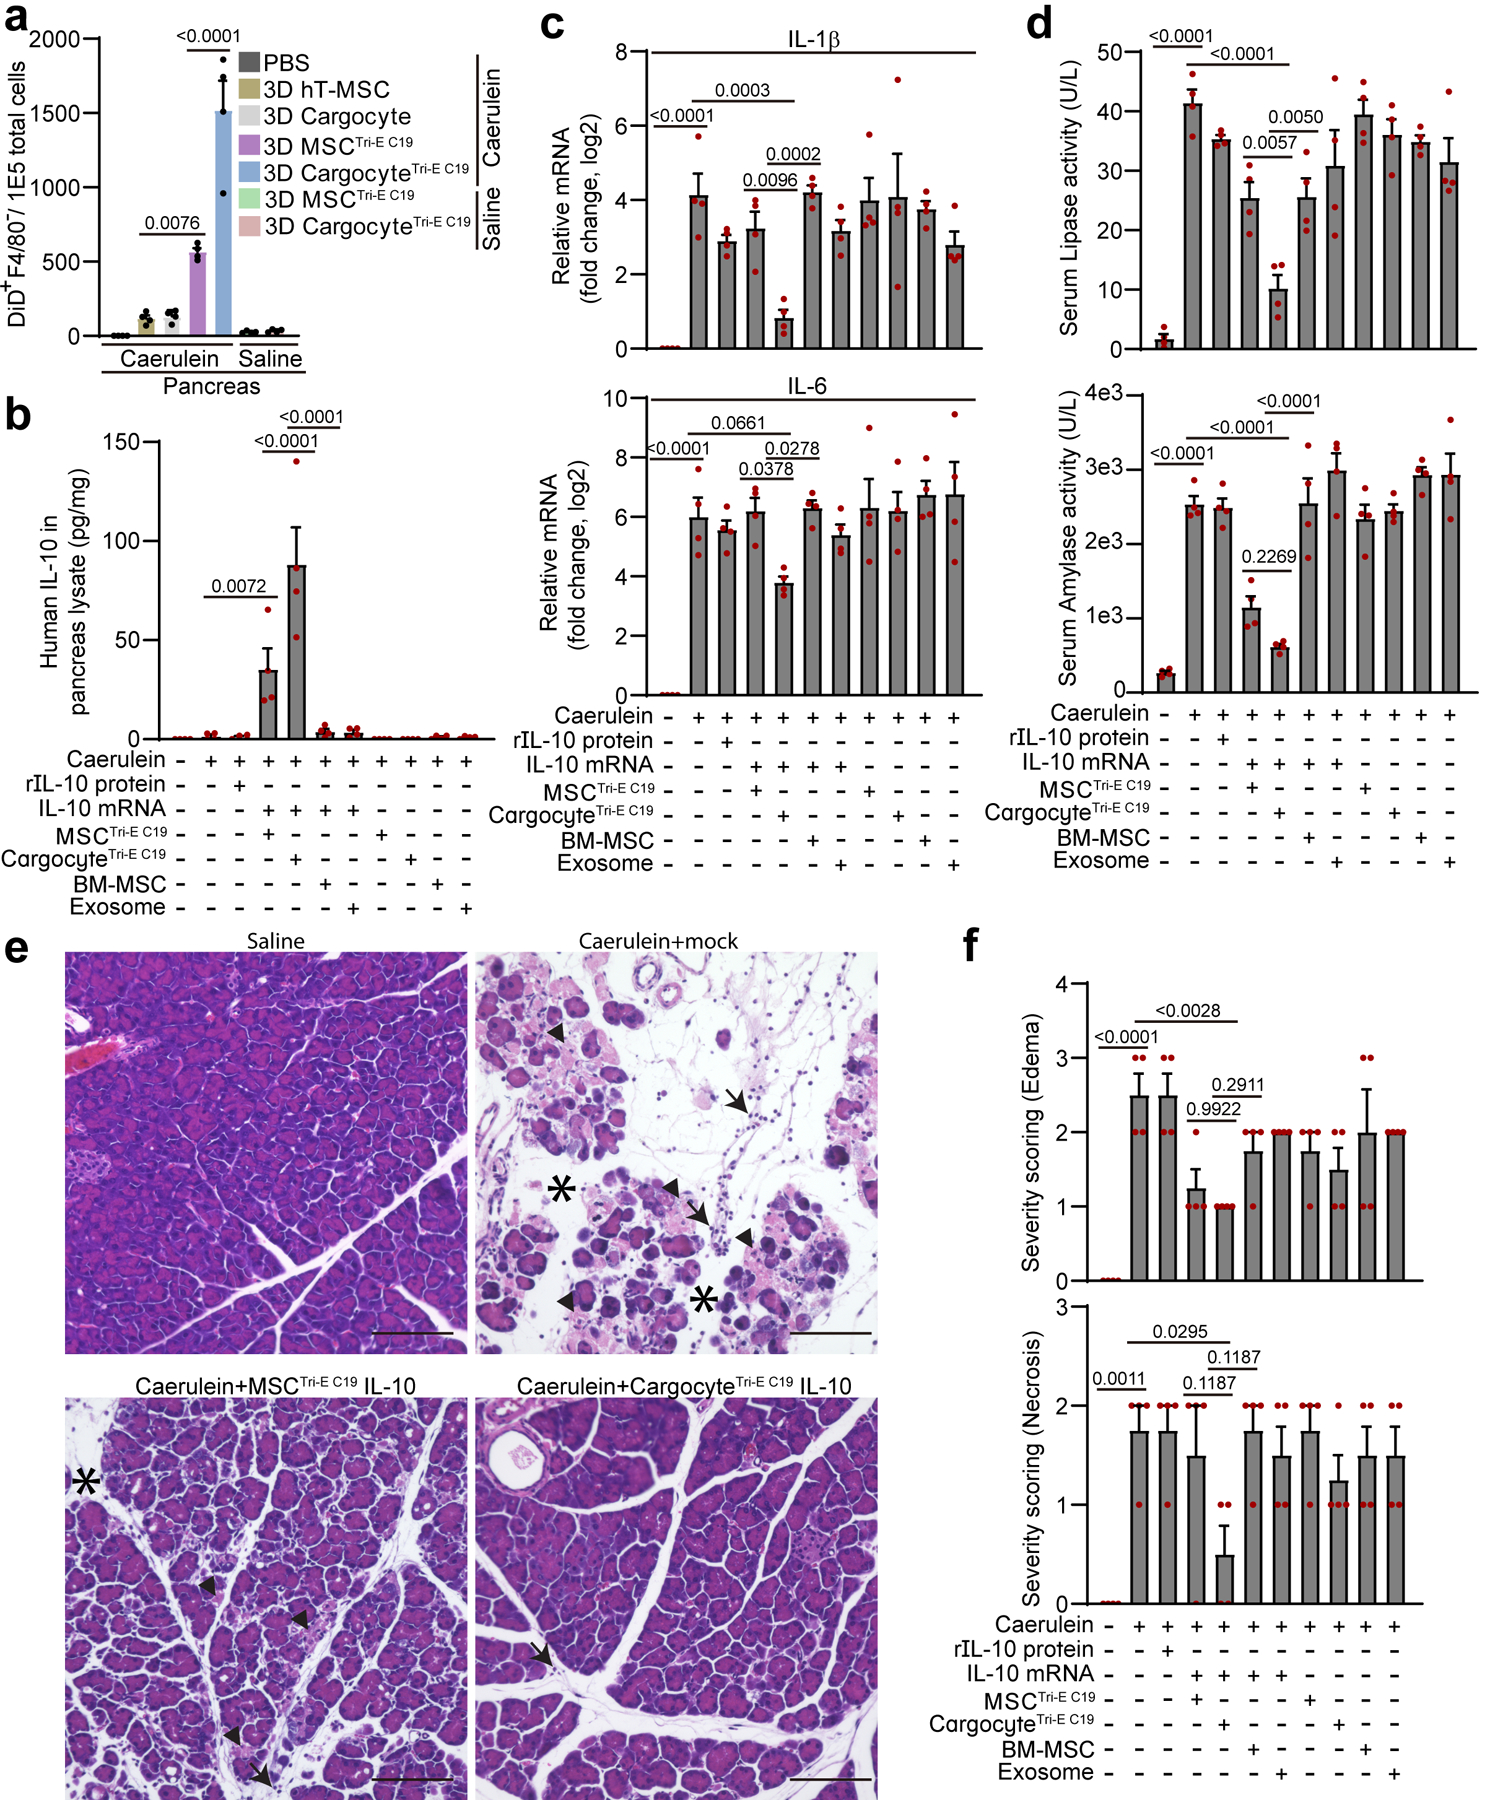
Targeting the delivery of therapeutics specifically to diseased tissue enhances their efficacy and decreases their side effects. Here we show that mesenchymal stromal cells with their nuclei removed by density-gradient centrifugation following the genetic modification of the cells for their display of chemoattractant receptors and endothelial-cell-binding molecules are effective vehicles for the targeted delivery of therapeutics. The enucleated cells neither proliferate nor permanently engraft in the host, yet retain the organelles for energy and protein production, undergo integrin-regulated adhesion to inflamed endothelial cells, and actively home to chemokine gradients established by diseased tissues. In mouse models of acute inflammation and of pancreatitis, systemically administered enucleated cells expressing two types of chemokine receptor and an endothelial adhesion molecule enhanced the delivery of an anti-inflammatory cytokine to diseased tissue (with respect to unmodified stromal cells and to exosomes derived from bone-marrow-derived stromal cells), attenuating inflammation and ameliorating disease pathology. Enucleated cells retain most of the cells' functionality, yet acquire the cargo-carrying characteristics of cell-free delivery systems, and hence represent a versatile delivery vehicle and therapeutic system.


Conflict of interest statement

Competing interest

Cargocyte is the trademark of Cytonus Therapeutics. R.L.K is the co-founder and equity holder of Cytonus Therapeutics. H.W and R.L.K are co-inventors of a related patent (WO 2019/032628 A1, US 10,927,349 B2) and H.W., W.P., and R.L.K. are co-inventors of another related patent (PCT/US21/016,919). Both patents were filed by UCSD.

Figures

Fig. 1 |
Fig. 1 |. Enucleated cells retain important cellular functions.
a, Schematic of workflow for therapeutic uses of bioengineered enucleated cells (Cargocytes). b, Fluorescent image (upper) and phase image (down) show hT-MSCs and Cargocytes in suspension. Representative images out of 30 images obtained are shown. Cortical actin was labeled with LifeAct-RFP. Arrow points to the cell nucleus stained with Vybrant Dyecycle Green. Scale bar, 20μm. c, Bar graph shows the average diameter of hT-MSCs or Cargocytes in suspension. Mean ± SEM; n=80 individual cells/Cargocytes. P value, two-tailed unpaired t-test. d, Fluorescent confocal images of hT-MSCs/Cargocytes stained with rhodamine phalloidin for F-actin cytoskeleton (left), or anti-α-Tubulin antibody for microtubule network (right), and Hoechst 33342 for nucleus. Representative images out of 30 images obtained are shown. Arrows point to the F-actin cytoskeleton; arrowheads point to the microtubule network. Scale bar, 50μm. e, Graphs show the percentage of viable hT-MSCs/Cargocytes versus initial population over time. Mean ± SEM; n=6 biological replicates. f, Electron microscopy images of extracellular vesicles (EVs) from hT-MSCs and Cargocytes. Representative images out of 10 images obtained are shown. Arrowheads point to typical EVs. Scale bar, 200 nm. See also Supplementary Fig.2b for higher resolution images. g, Histograms showing the size distribution of EVs from conditioned media of MSCs or Cargocytes analyzed by NanoSight. The red, green, and blue colored lines show technical triplicates from each sample. h, Bar graph shows the zeta potential of MSCs or Cargocytes measured by dynamic light scattering (DLS) technique using a Zetasizer Nano ZS analyzer and analyzed by Dispersion Technology Software. i, Epi-Fluorescent images show LifeAct RFP (red) hT-MSCs/Cargocytes stained with Hoechst 33342 (blue) 24hr (hour) post transfection of GFP (green) mRNA. Representative images out of 30 images obtained are shown. Arrowhead points to a single nucleus in the Cargocyte panel. Scale bar, 50μm. j, Bar charts show the mean fluorescent intensity (MFI) of GFP (left) or GFP positive ratio (right) of cells treated as in (i) and analyzed by flow cytometry. k, Bar graph shows Gaussia luciferase (Gluc) activity of conditioned medium from cells 48hr post-transfection with Gluc mRNA. RLU=Relative luminescence units. For (h), (j), and (k), Mean ± SEM; n=6 biological replicates; P value, two-tailed unpaired t-test. All data are representative of at least 2 independent experiments.
Fig. 2 |
Fig. 2 |. Cargocytes have chemotaxis activities and migrate better through confined spaces.
a, MSCs/Cargocytes migrated in Boyden chambers towards FBS (Fetal bovine serum) gradients for 2hr. Representative brightfield images of MSCs or Cargocytes that migrated to the underside of 8.0μm porous filters were stained with Crystal Violet. Scale bar, 50μm. b, Bar graph represents the cell migration index (migrated MSCs/Cargocytes versus loading control). Mean ± SEM; n=10 independent fields from 3 biological replicates. See also Supplementary Fig.3a for attachment control. c, Bar graph represents cell migration index of MSCs/Cargocytes towards PDGF-AB gradients. Mean ± SEM; n=15 independent fields from 5 biological replicates. d, Time-lapse image sequence of hT-MSCs and Cargocytes moving through constrictions (≤2×5μm in cross section) along an FBS gradient in a microfluidic device. F-actin cytoskeleton (red) was labeled with LifeAct-RFP and cell nucleus (blue) was stained with Hoechst 33342. Arrows point to migrating Cargocytes and arrowheads point to hT-MSCs trapped in the confined constrictions. Scale bar, 50μm. See also Supplementary Movies 1 and 2. e, MSCs and Cargocytes were treated as in (d). Bar graph shows the average time required for cells to migrate through an individual microfluidic constriction. Data for both confined (≤2μm×5μm) and unconfined (15μm×5μm) constrictions are shown. Mean ± SEM. Data were pooled from 3 independent experiments. Exact number in each group shown above the bar. P value, one-way ANOVA with Bonferroni’s multiple comparison tests. f, Graph shows cell surface expression of CXCR4 by flow cytometry. Data analyzed in Flowjo and normalized to mode. MSCCXCR4, CXCR4 lentivirus-engineered hT-MSC; 2hr/24hr/48hr Cargocytes, MSCCXCR4-derived Cargocytes analyzed at indicated time points post-enucleation; Parental hT-MSC, non-engineered hT-MSC; Isotype control, MSCCXCR4 stained with isotype-matching IgG. g, MSCs/Cargocytes migrated in Boyden chambers towards the indicated concentrations of SDF-1α for 2hr. Bar graph represents the cell migration index (migrated MSCs/Cargocytes versus loading control). Mean ± SEM; n=10 independent fields from 3 biological replicates. P value, two-way ANOVA with Bonferroni’s correction for multiple testing. All data are representative of at least 2 independent experiments.
Fig. 3 |
Fig. 3 |. Cargocytes interact with adhesion molecules.
a, Graphs show surface expression of PSGL-1 (left), P-selectin binding (middle), and E-selectin binding (right) of hT-MSCs or Cargocytes analyzed by flow cytometry. Data were analyzed in Flowjo and normalized to mode. MSCPSGL-1, PSGL-1/Fut7 lentivirus-engineered MSC; 2hr/24hr/48hr Cargo PSGL-1, MSC PSGL-1-derived Cargocytes analyzed at indicated time point after enucleation; Parental MSC, Non-engineered MSC; Isotype control, MSC PSGL-1 stained with isotype matching IgG. b, Graphs show LDV-FITC binding on un-engineered Cargocytes or CargocytesCXCR4 analyzed by flow cytometry. Data were analyzed in Flowjo and normalized to mode. Unstained control, no LDV-FITC control; LDV-FITC, 4nM LDV-FITC; LDV-FITC+SDF-1α, 4nM LDV-FITC+500ng/ml SDF-1α; LDV-FITC+SDF-1α+LDV, 4nM LDV-FITC+500ng/ml SDF-1α+1μM LDV (unconjugated competitor). Dashed line labels the position of median fluorescence intensity. c, Bar graphs represents the MFI change of LDV-FITC binding intensity before and after SDF-1α treatment. MFI ratio = (MFILDV-FITC+ SDF-1α - MFIunstained control)/ (MFILDV-FITC - MFIunstained control). n=4 biological replicates. P value, one-way ANOVA with Tukey’s multiple comparisons test. d, Representative images show the adherent MSCs or Cargocytes on control HUVECs or inflamed HUVECs (TNF-α treated). Representative images out of 24 images obtained are shown. Scale bar, 100μm. e, Bar graphs represent the adherent cell numbers per field (100X magnification). TNF-α, HUVECs pre-treated with 10ng/ml TNF-α for 6hr. SDF-1α, 500ng/ml SDF-1α; a-PSGL-1, 10μg/ml anti-PSGL-1 antibody pre-treatment; a-VLA-4, 10μg/ml anti-VLA-4 antibody pre-treatment; n= 24 random fields of 4 biological replicates. P value, one-way ANOVA with Tukey’s multiple comparisons test. All data are representative of at least 2 independent experiments.
Fig. 4 |
Fig. 4 |. Bioengineered Cargocytes actively and specifically home to the inflamed ear.
a, Bar graphs show the number of DiD+RFP+ double-positive cells out of 1E5 total cells harvested from mouse lung 24hr post-intravenous (i.v.) injection and detected by flow cytometry. Mean ± SEM, n=6 mice. b, Mice were intradermally (i.d.) injected with LPS in the right ear and saline in the left, followed by i.v. injection of DiD-labeled MSCs or Cargocytes 6hr later. Bar graphs show the number of DiD+F4/80 cells out of 1E5 total cells harvested from mouse ears 24hr post-injection and detected by flow cytometry. Mean ± SEM, n=6 mice. c, Mice were treated as in (b) and then i.v. injected with 1E6 3D-MSCTri-E C19 or 3D-CargocyteTri-E C19 transfected with firefly luciferase mRNA. Mice were euthanized at indicated time points after i.v. injection. The dorsal skin of the mouse ears was peeled from the underlying cartilage and the subcutaneous surfaces of the tissue were directly soaked in VivoGlo™-luciferin substrate and immediately subjected to bioluminescence imaging with IVIS Lumina Series III. See also Supplementary Fig.7a for in vitro control of luciferase activity. d, Mice treated as in (b) were i.v.-injected with 1E6 3D-CargocyteTri-E C19. After 24hr, mouse ears were harvested and whole-mount stained with anti-mouse CD31 (green), anti-human Mitochondrial (red), and anti-human nucleus antigen (blue). Confocal images from Olympus FV1000 were analyzed with Fiji ImageJ. Maximum projection of Z-stacks of images of ears from the same mouse were shown. Arrows point to human Cargocytes, and arrowheads point to human nuclei. Representative images out of 10 images obtained are shown. Scale bar, 20μm. For (a) and (b), adjusted P values shown above the bars, one-way ANOVA with Tukey’s multiple comparisons test. All data are representative of at least 2 independent experiments.
Fig. 5 |
Fig. 5 |. Bioengineered Cargocytes efficiently deliver bioactive IL-10 to inflamed ears and ameliorate local inflammation.
a, Graph shows the secreted IL-10 concentration measured by ELISA in conditioned media of IL-10 mRNA transfected MSCs (MSC-IL-10) and Cargocytes (Cargocyte-IL-10), non-transfected cells (hT-MSC only) or control media. Mean ± SEM; n=6 biological replicates from two independent experiments. b, Mouse RAW macrophage cells were treated with indicated conditioned media or recombinant IL-10 protein (rIL-10, 1ng/ml) for 30 mins. The phosphorylation of Stat3 was determined by western blot. c, Mice treated as in Fig.4b were i.v.-injected with indicated MSCs or Cargocytes transfected with human IL-10 mRNA. Bar graph shows the level of human IL-10 protein detected by ELISA from indicated mouse ears at 24hr post-injection. d, Light microscopy images of ears from mice treated as in (c) and harvested at 48hr post-injection and processed for hematoxylin and eosin staining. Scale bar, 100μm. e, Mice treated as in (c) received indicated i.v. injections. Graph shows change in ear thickness as measured by digital micrometer prior to LPS/Saline injections, 48hr post-injection and 96hr post-injection. f, Mice treated as in (e) had ears harvested and analyzed by real-time RT-PCR 48hr after LPS injection. Graphs show the fold change (Log2) of the indicated mRNA markers between LPS-treated (right) and saline-treated (left) ears. For (c, e, and f), Mean ± SEM, n=6 mice; each point represents 1 mouse. All statistics are one-way (f) or two-way ANOVA (a, c, and e) with Tukey’s multiple comparisons test. Adjusted P values shown above the bars. All data are representative of at least 2 independent experiments.
Fig. 6 |
Fig. 6 |. Bioengineered Cargocytes ameliorate Caerulein-induced acute pancreatitis.
a, Acute pancreatitis was induced by intraperitoneal (i.p.) injection of Caerulein in BalB/c mice, followed by i.v. injection of DiD-labeled MSCs or Cargocytes. Bar graphs show the number of DiD+F4/80 cells out of 1E5 total cells harvested from mouse pancreas 16hr post-injection and detected by flow cytometry. Mean ± SEM, n=4 mice. From (b) to (e), Mice with Caerulein-induced AP were i.v.-injected with indicated treatments. Mouse tissues were harvested 16hr post-injection. b, Bar graph shows the level of human IL-10 protein detected by ELISA from mouse pancreas from indicated treatment. Mean ± SEM, n=4 mice. See also Supplementary Fig.14a and b for in vitro transfection controls. c, Bar graph shows the relative mRNA expression of IL-1β (upper) and IL-6 (lower) detected by real-time RT-PCR in the mouse pancreas from indicated treatment. Graphs show the fold change (Log2) of the indicated mRNA markers normalized to no Caerulein treatment group. Mean ± SEM, n=4 mice. d, Bar graph shows the lipase activity (upper) and amylase activity (lower) detected in the mouse serum from indicated treatment. Mean ± SEM, n=4 mice. e, Representative light microscopy images of pancreas from mice treated as in (c) and harvested at 16hr post-injection and processed for hematoxylin and eosin staining. Arrows point to infiltrated leukocytes, arrowheads point to necrosis, and asterisks label edema. Scale bar, 100μm. f, Histological analysis of pancreas treated as in (e). The severity of edema (upper) and necrosis (lower) were graded from 0 to 3 using established criteria. See also Supplementary Fig.14e and f for inflammatory cell infiltration. Mean ± SEM, n=4 mice. All statistics are one-way ANOVA with Dunnett’s correction for multiple testing, and P values for more post-hoc comparisons can be found in Supplementary Table 10. All data are representative of at least 2 independent experiments.

References

    1. Allen TM & Cullis PR Drug delivery systems: entering the mainstream. Science 303, 1818–1822 (2004). - PubMed
    1. Yoo JW, Irvine DJ, Discher DE & Mitragotri S Bio-inspired, bioengineered and biomimetic drug delivery carriers. Nat Rev Drug Discov 10, 521–535 (2011). - PubMed
    1. Lyerly HK, Osada T & Hartman ZC Right Time and Place for IL12: Targeted Delivery Stimulates Immune Therapy. Clin Cancer Res 25, 9–11 (2019). - PubMed
    1. Fioranelli M & Roccia MG Twenty-five years of studies and trials for the therapeutic application of IL-10 immunomodulating properties. From high doses administration to low dose medicine new paradigm. J Integr Cardiol 1, 2–6 (2014).
    1. Samanta S et al. Exosomes: new molecular targets of diseases. Acta Pharmacol Sin 39, 501–513 (2018). - PMC - PubMed

Publication types