. 2021 Dec;3(12):1694-1705.
doi: 10.1038/s42255-021-00502-8. Epub 2021 Dec 20.

Microbial metabolite delta-valerobetaine is a diet-dependent obesogen

Affiliations

Microbial metabolite delta-valerobetaine is a diet-dependent obesogen

Ken H Liu et al. Nat Metab. 2021 Dec.

Abstract

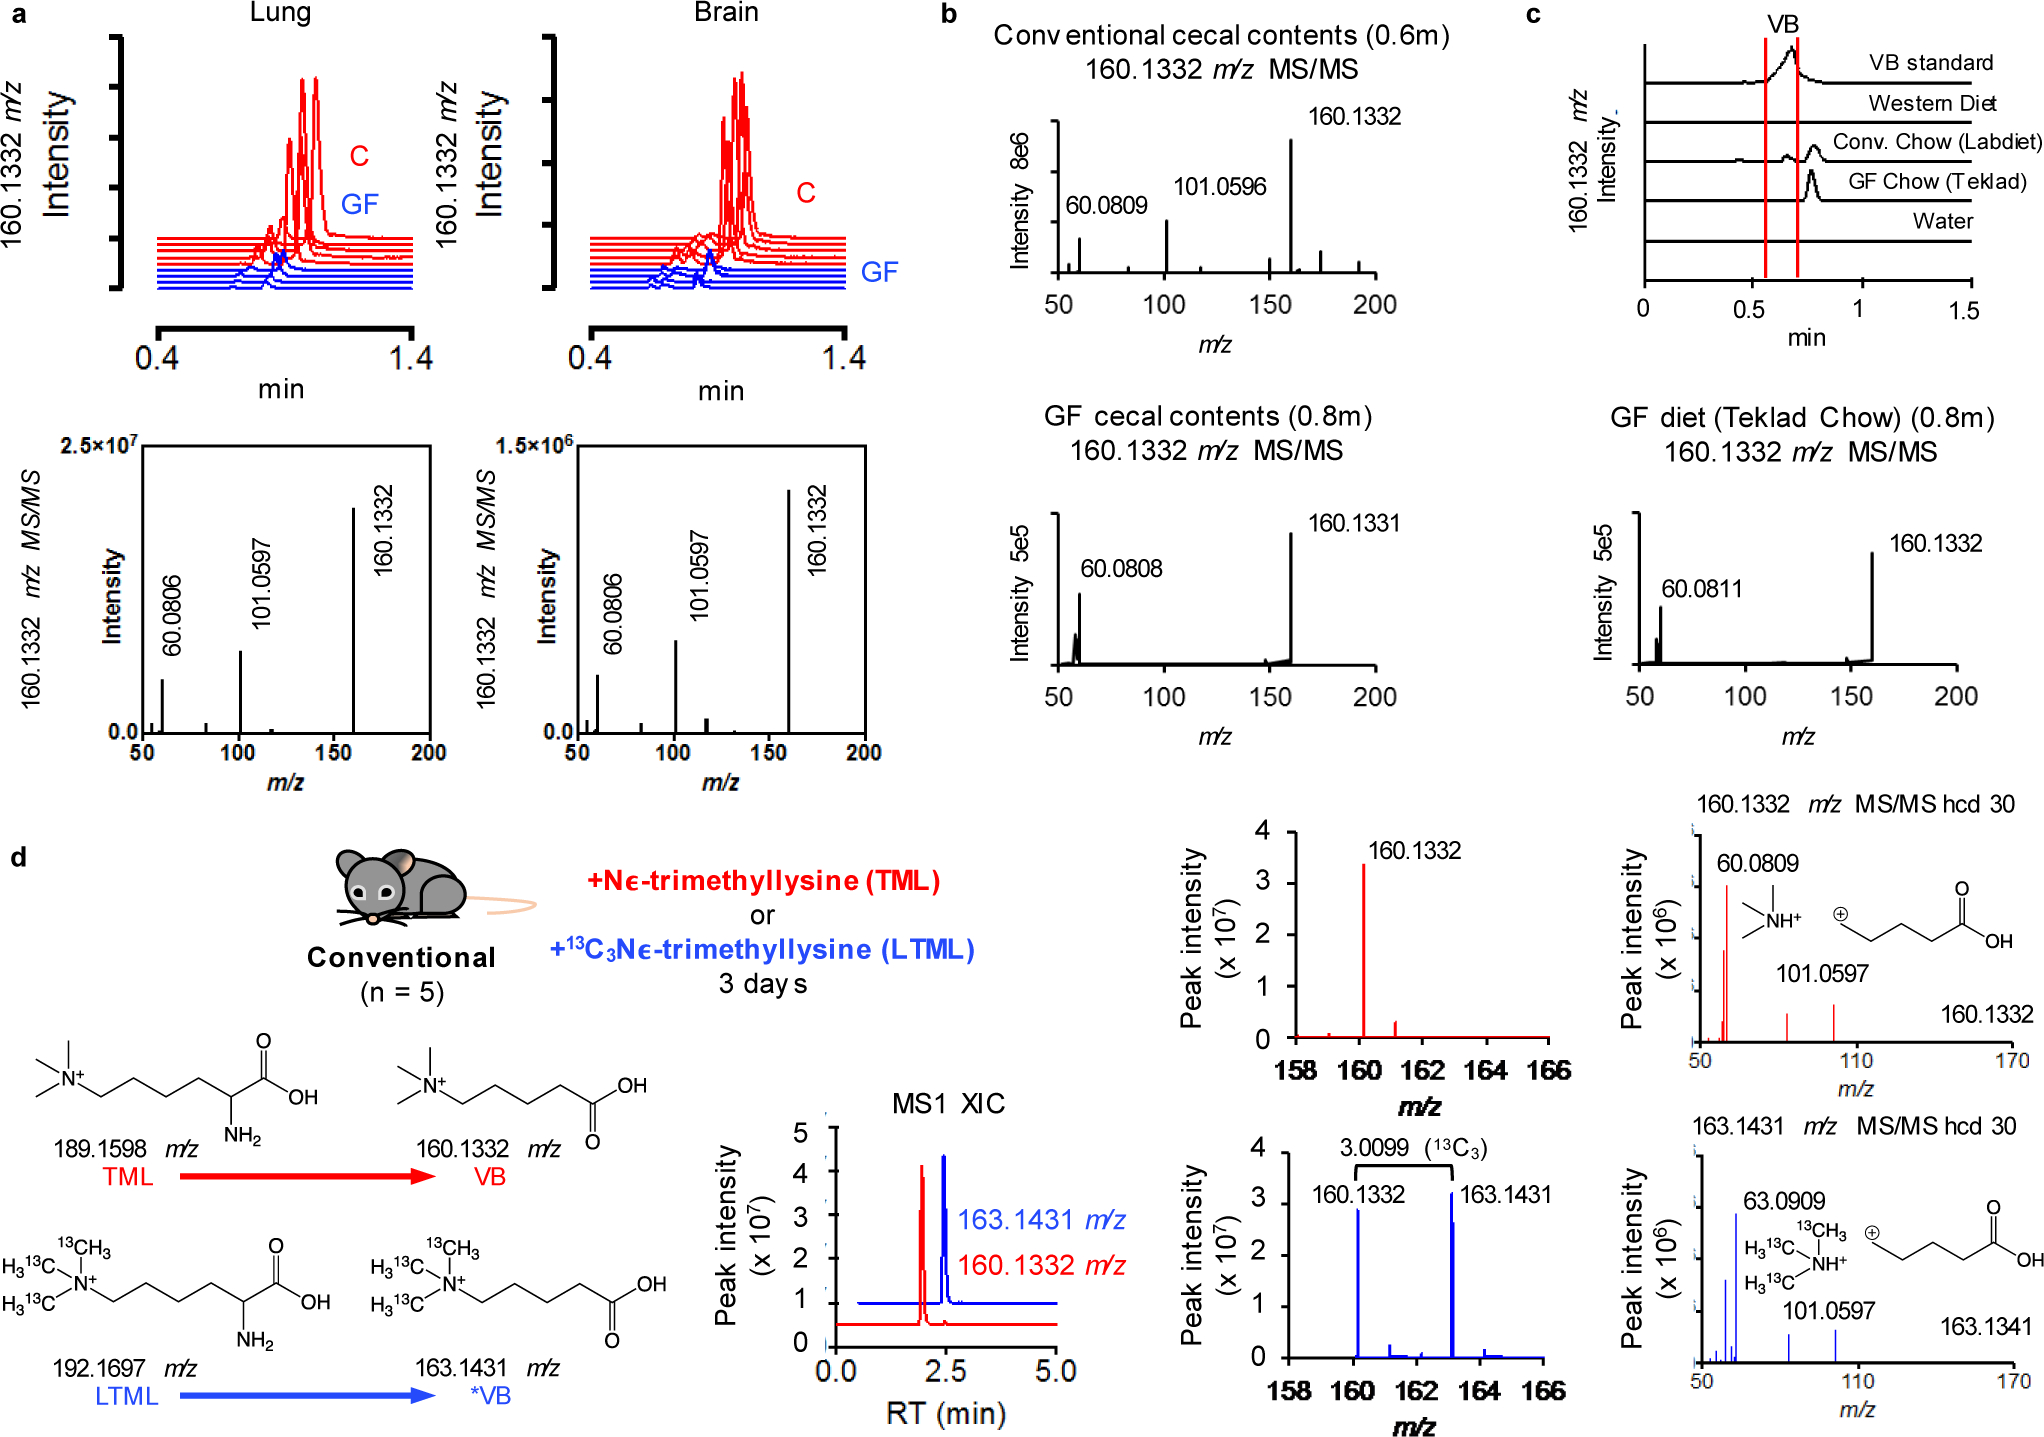
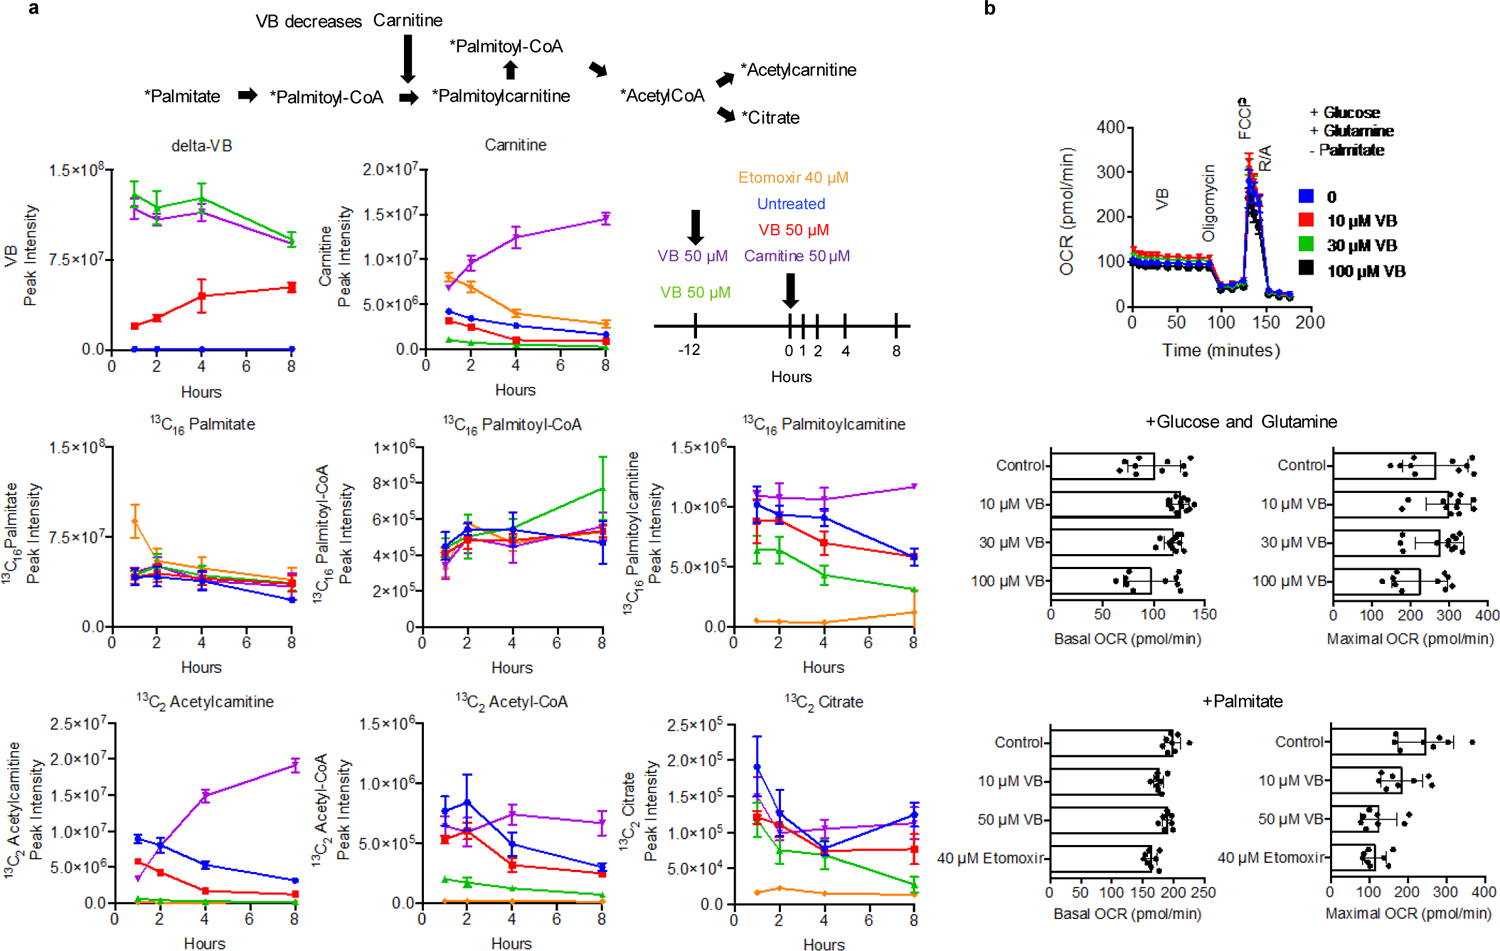
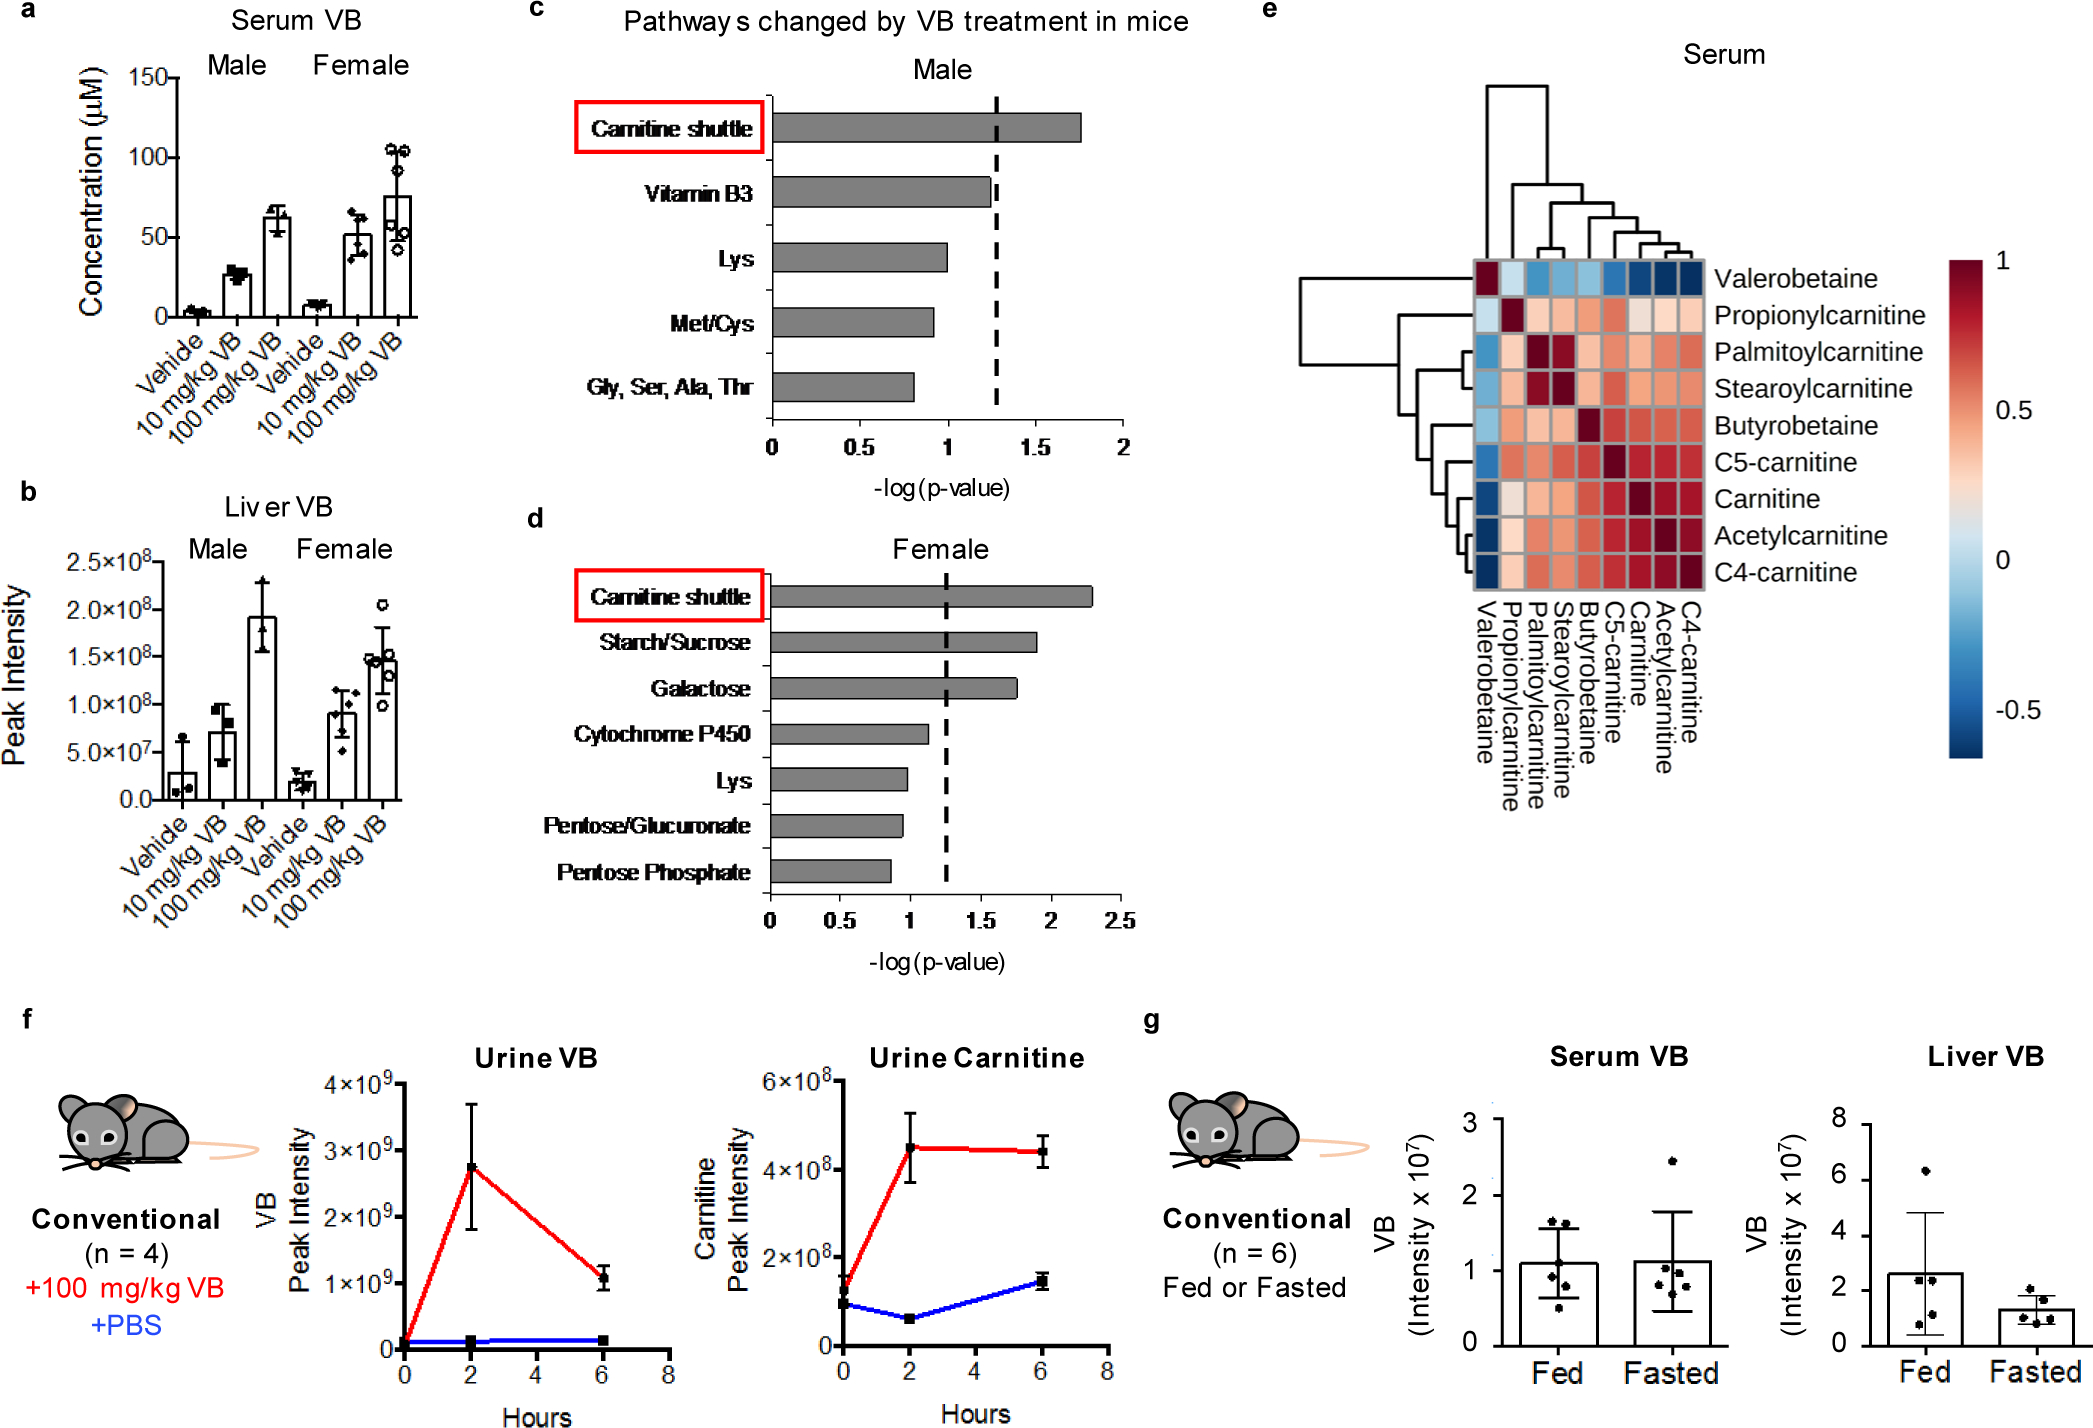
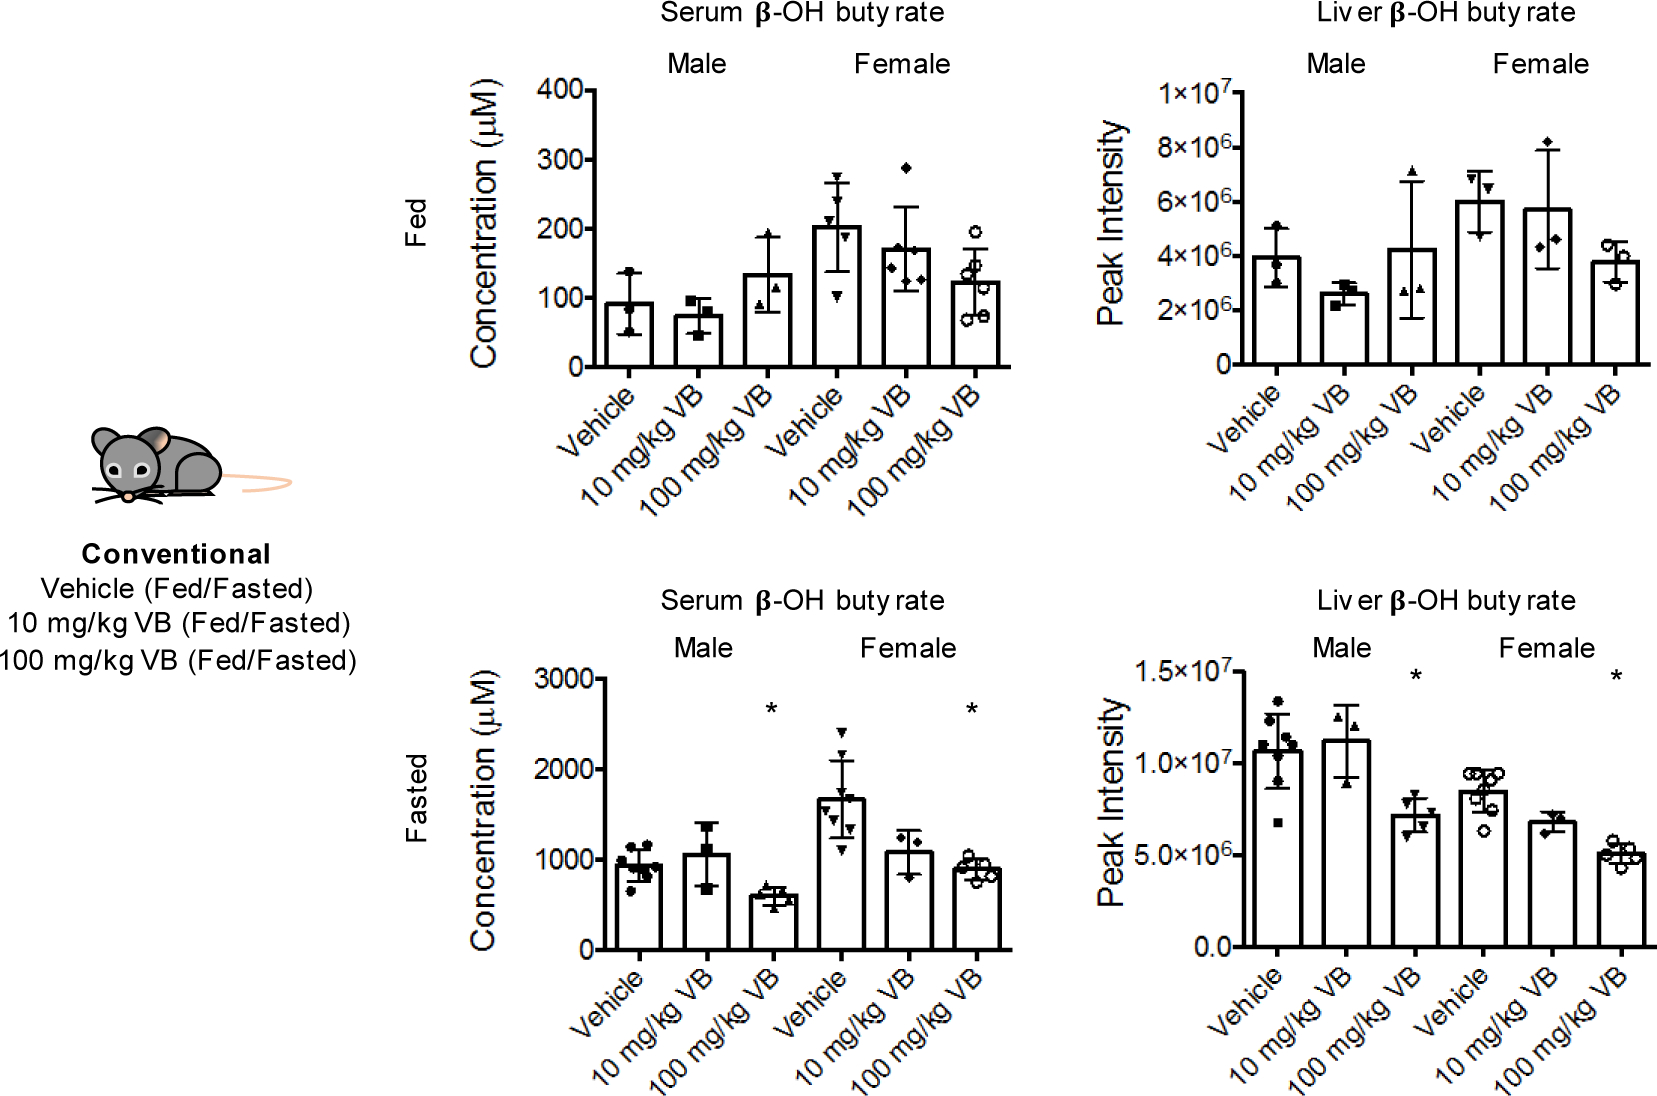
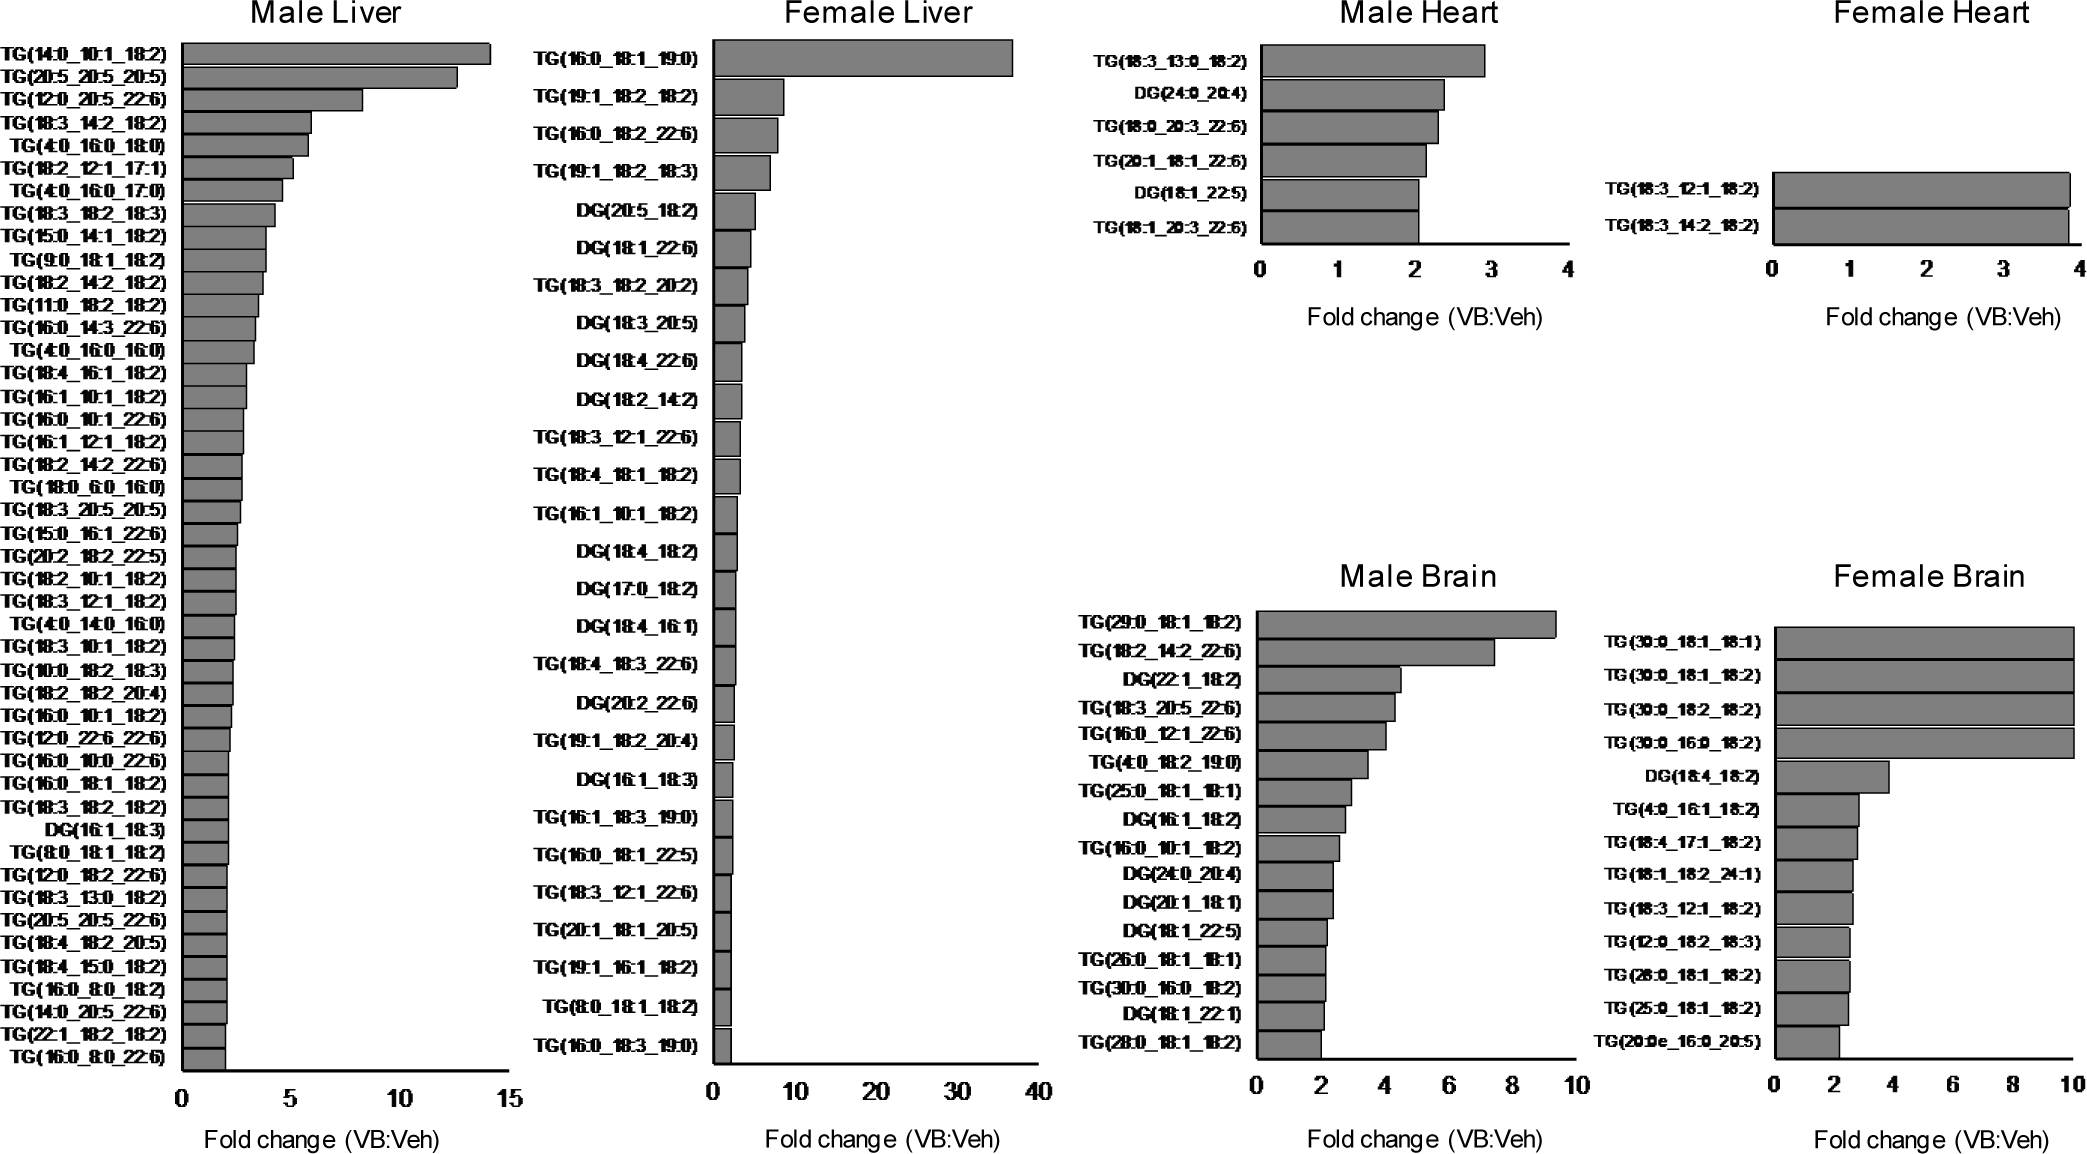
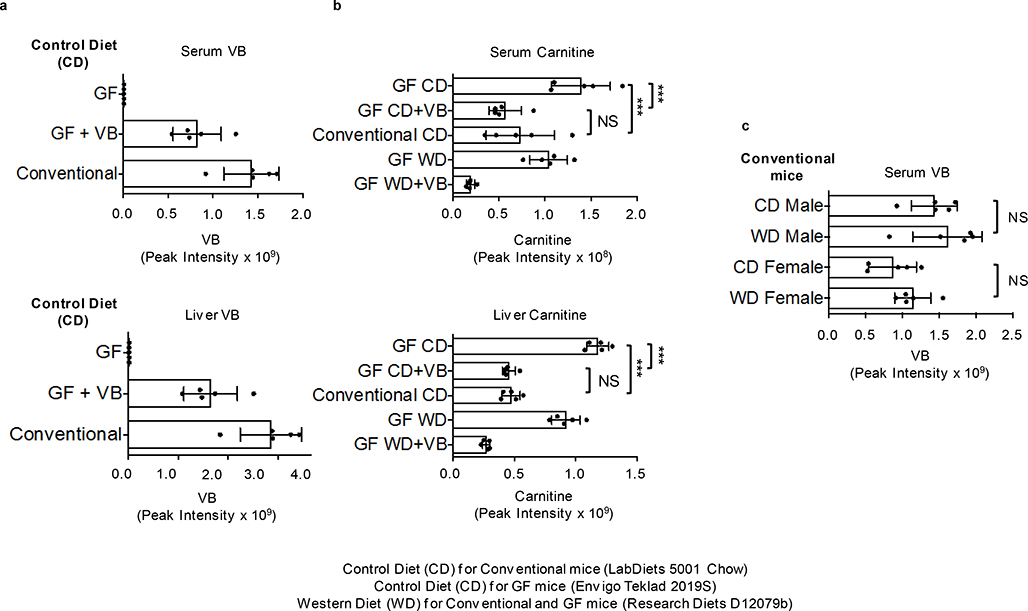
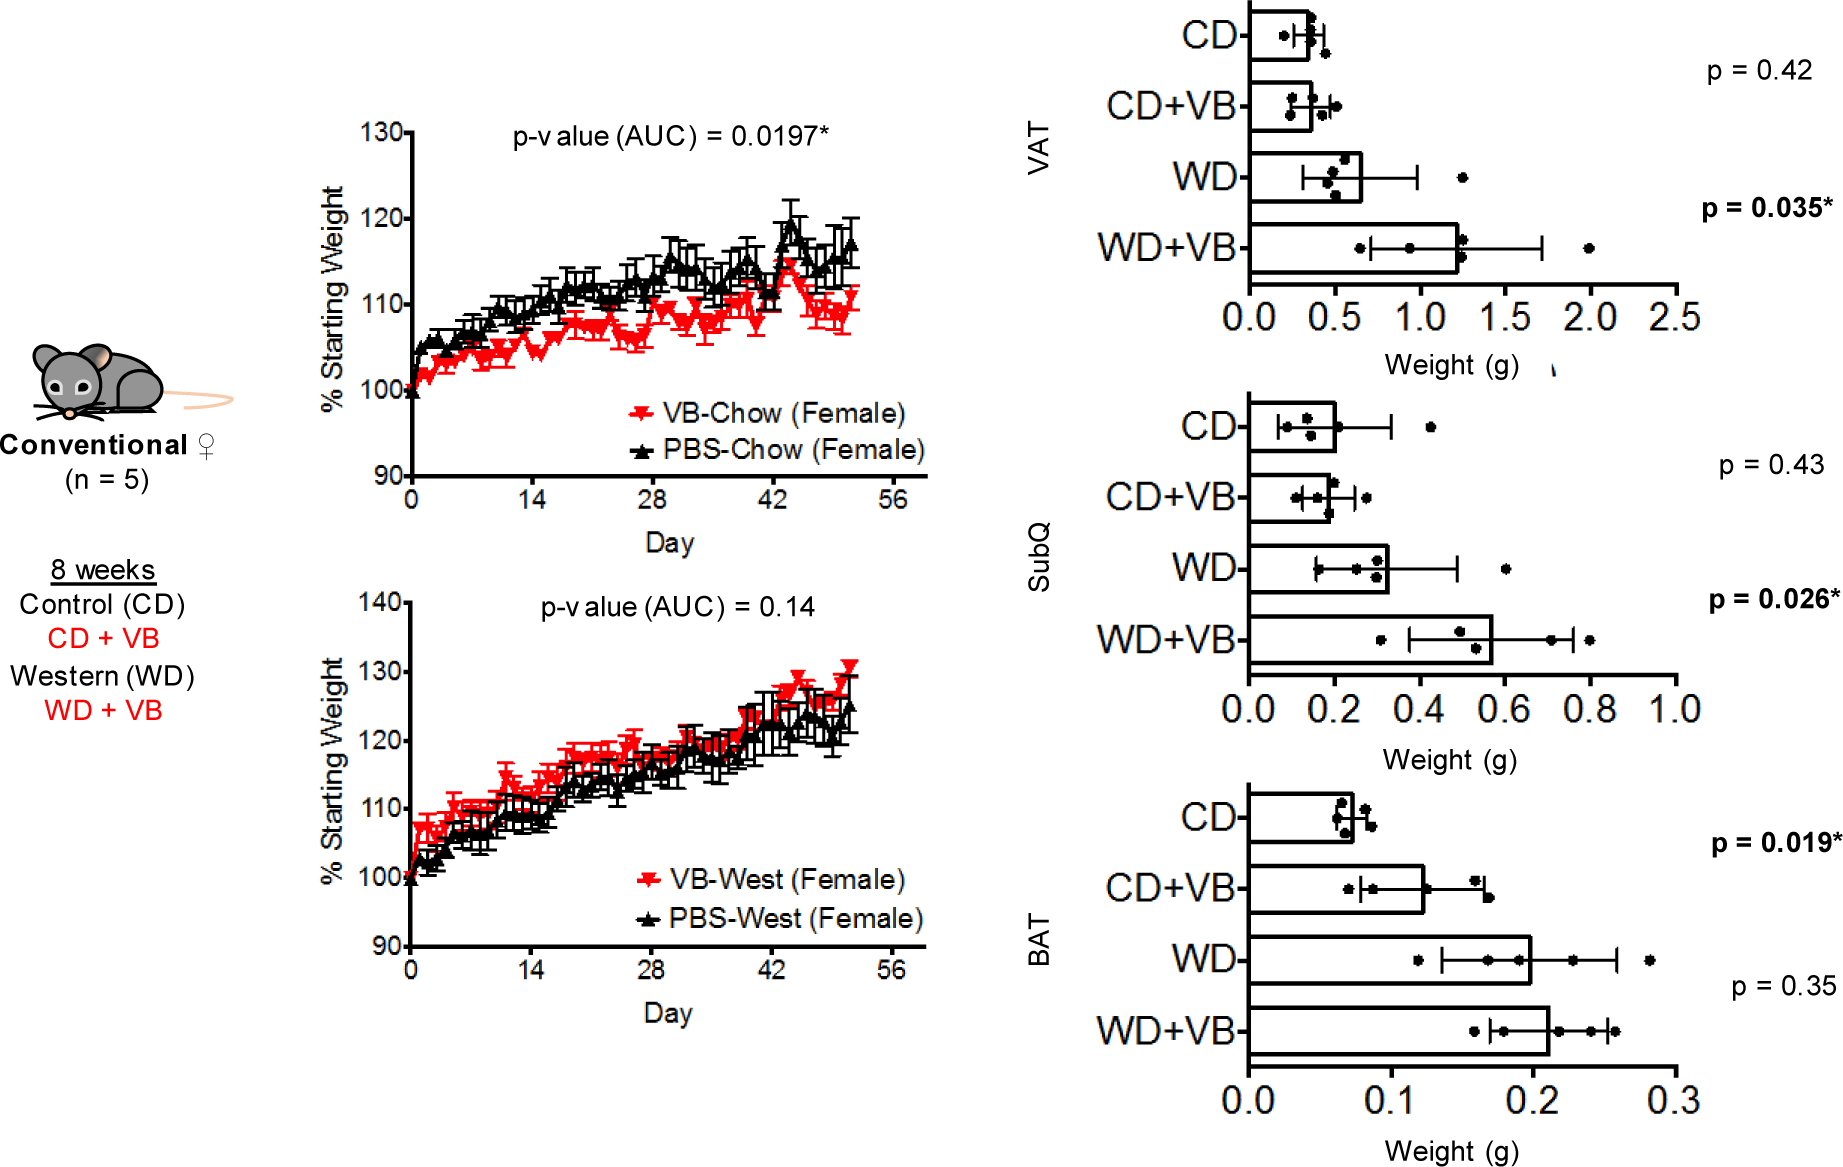
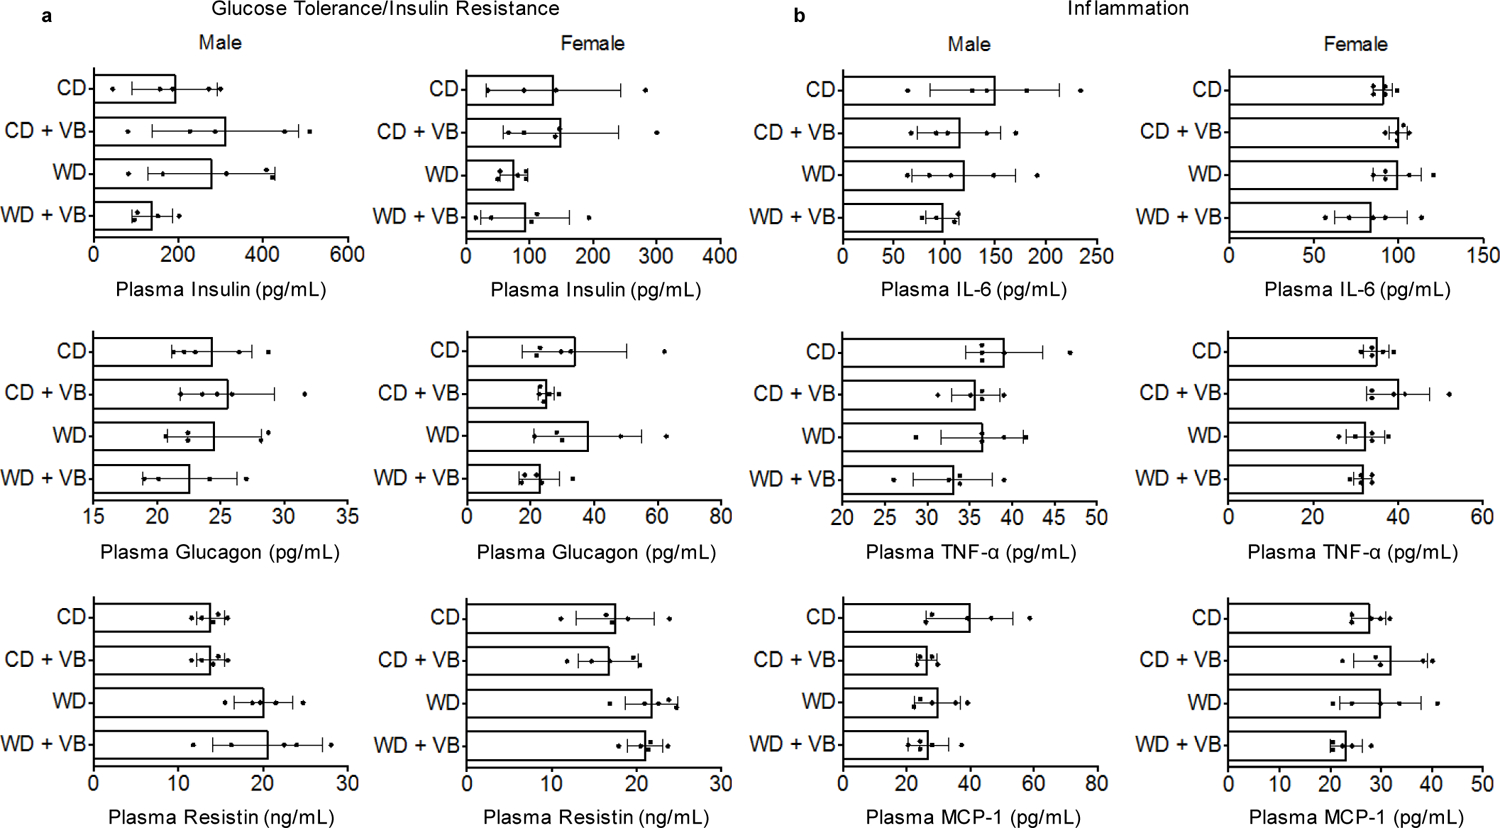
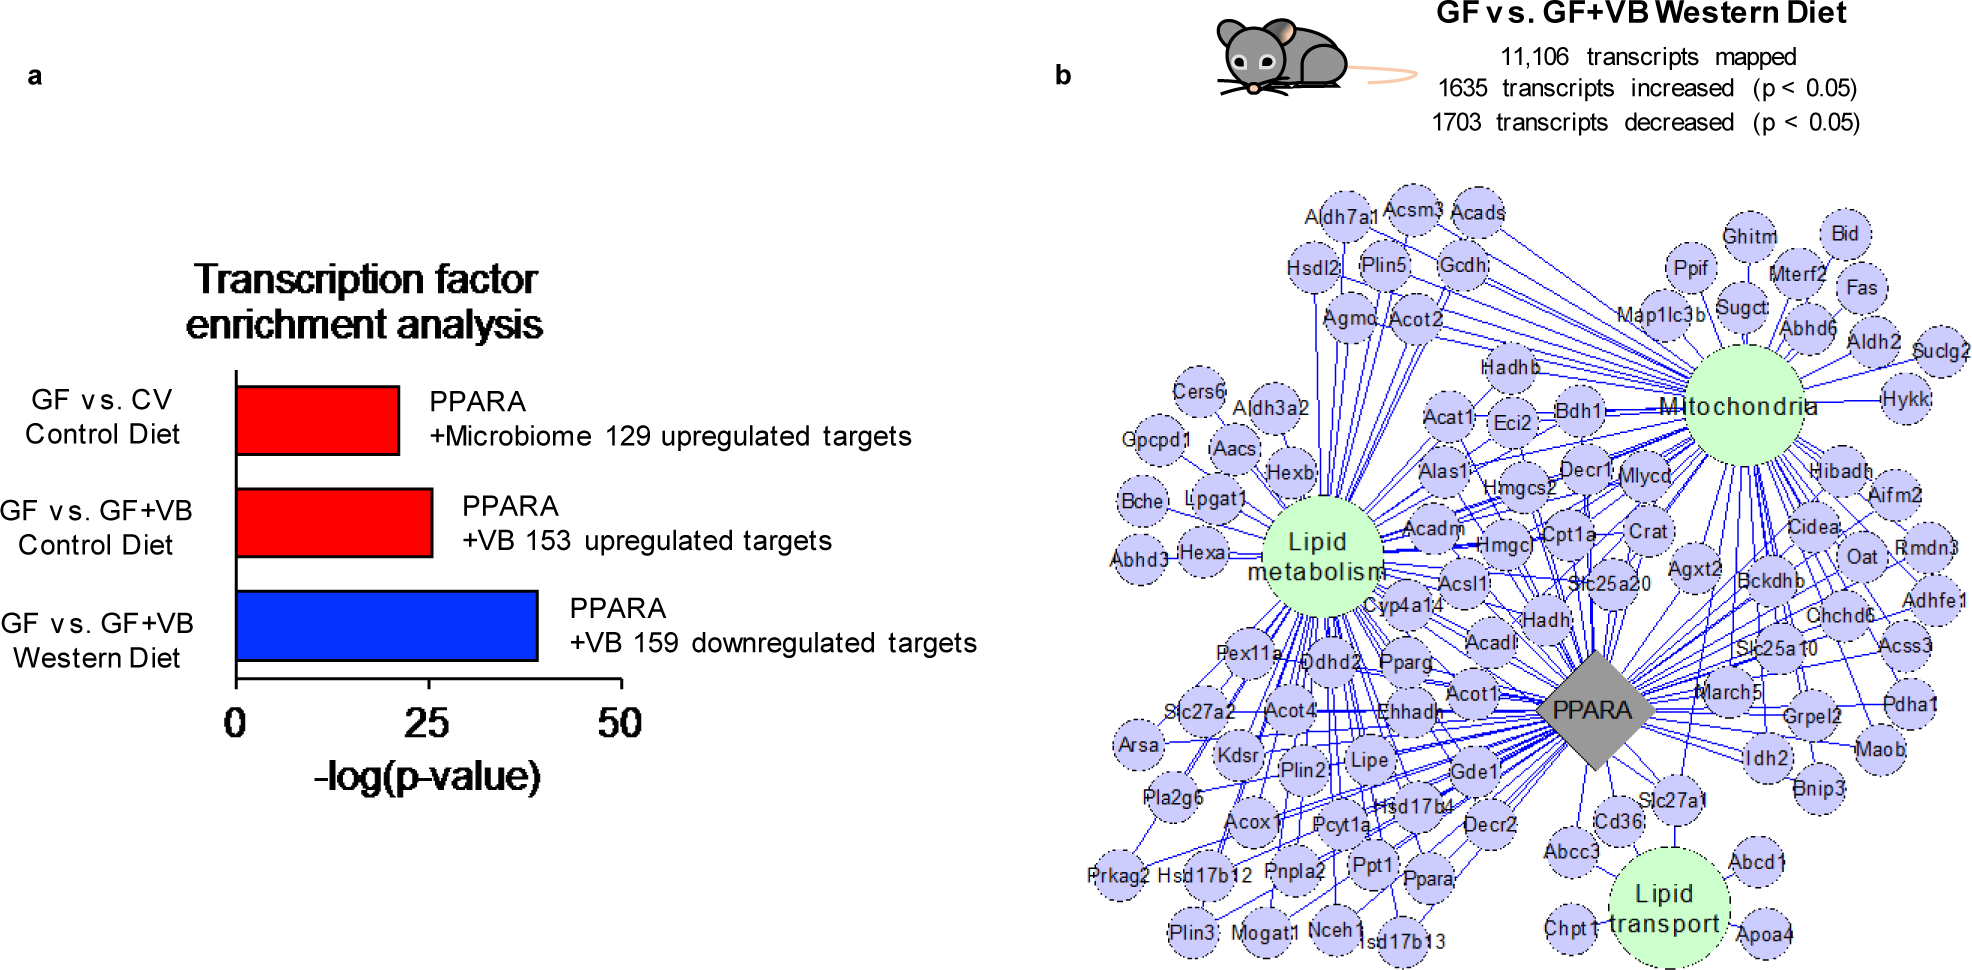
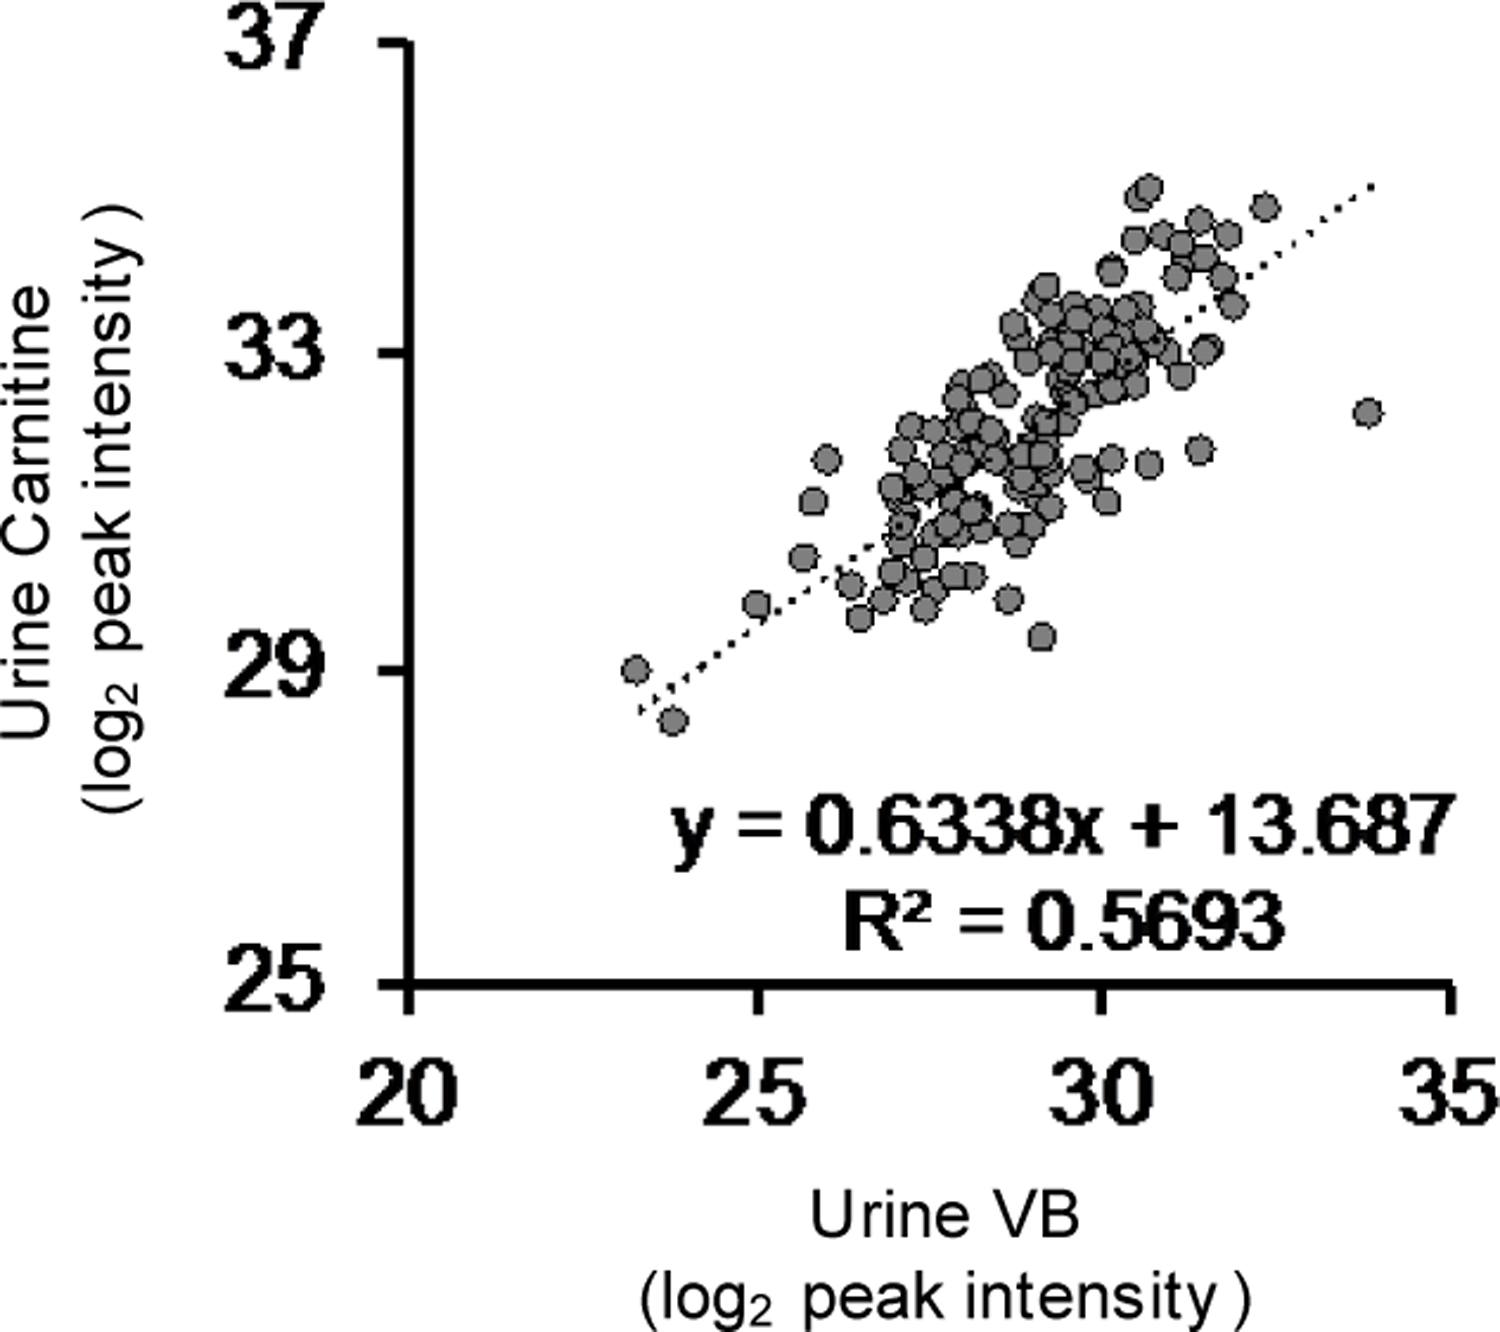
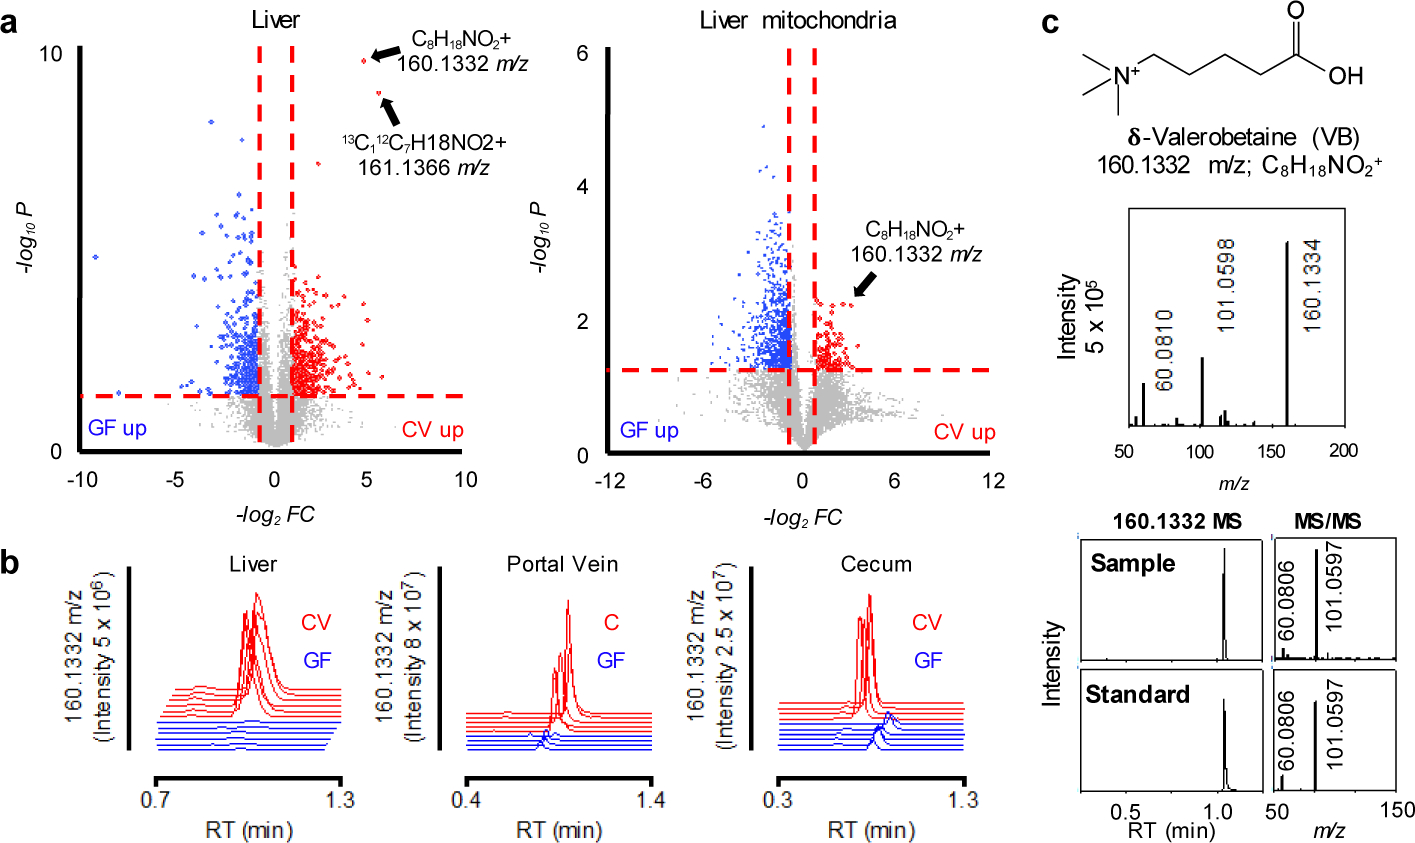
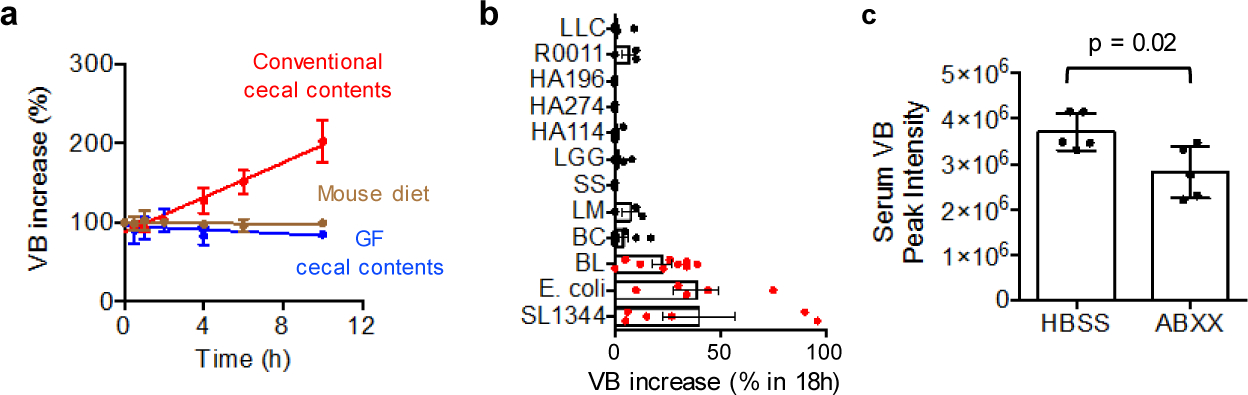
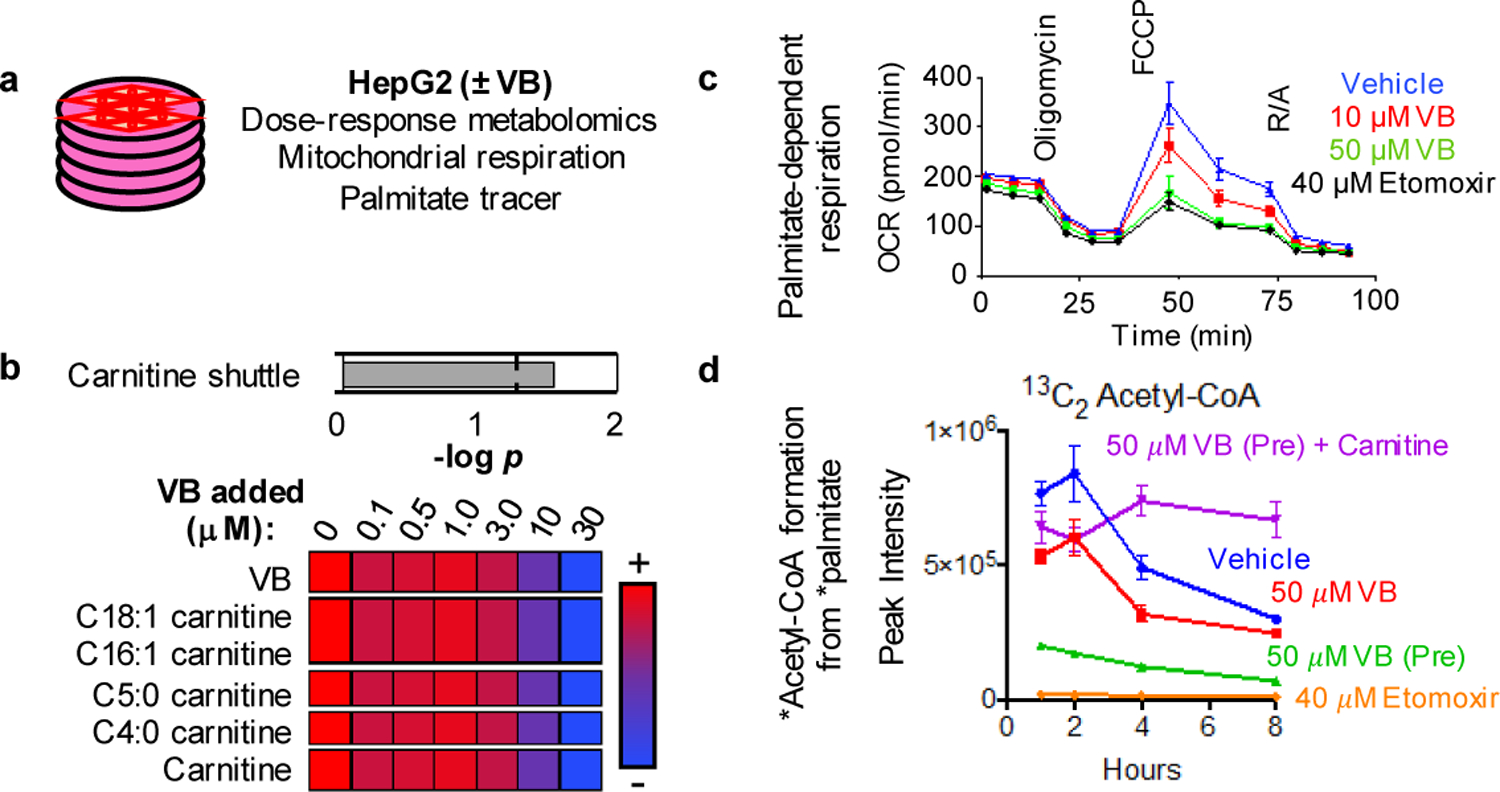
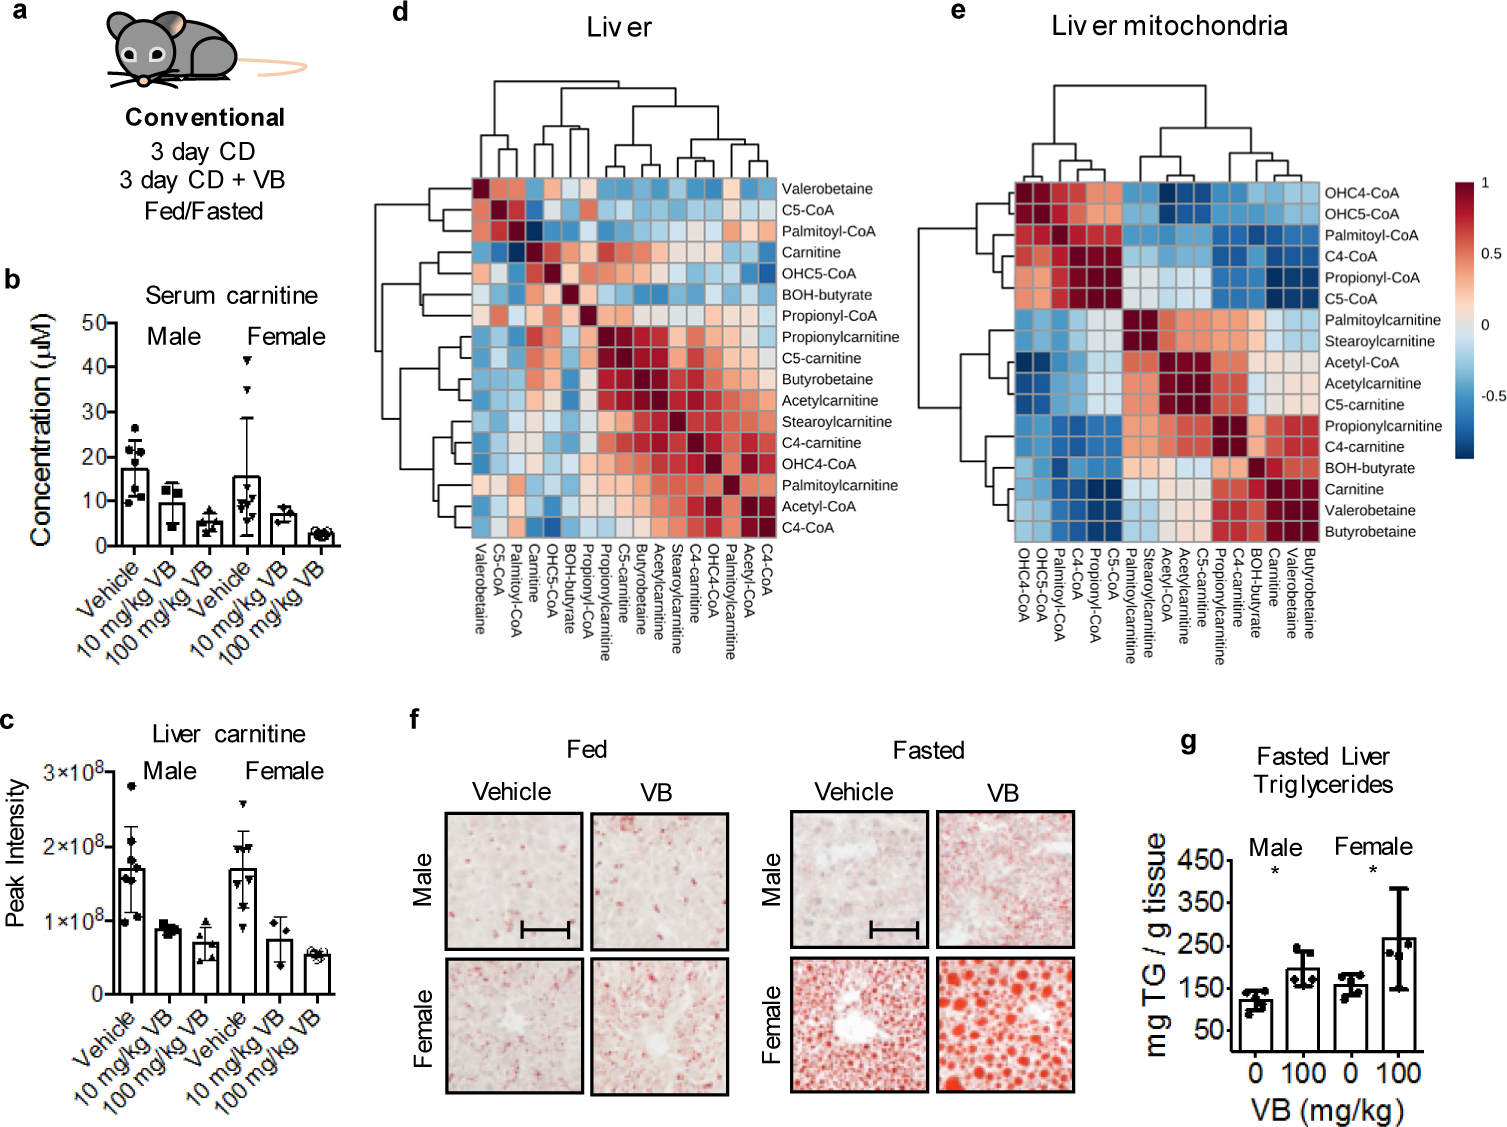
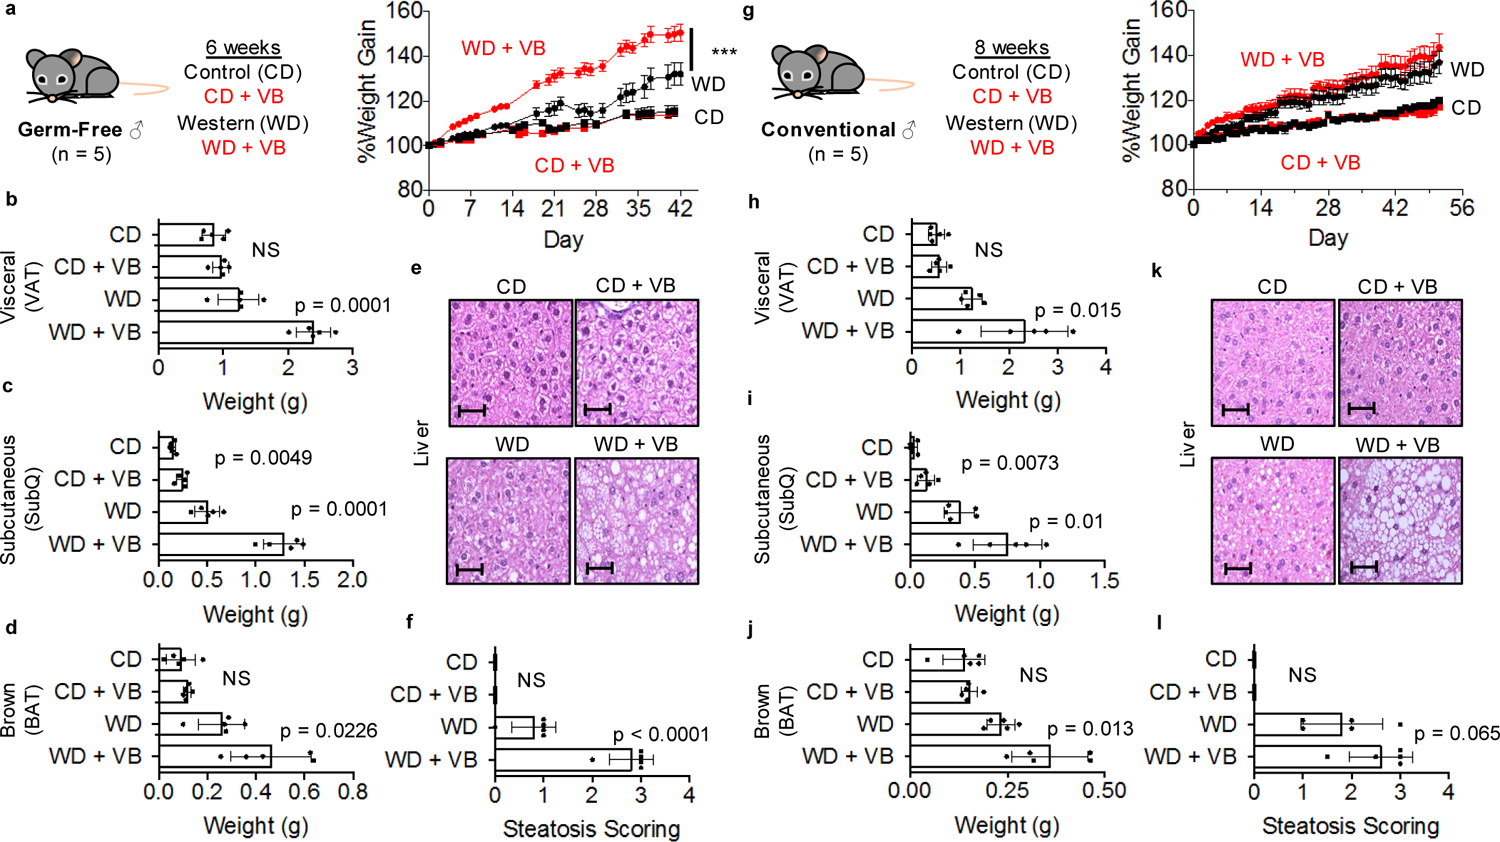
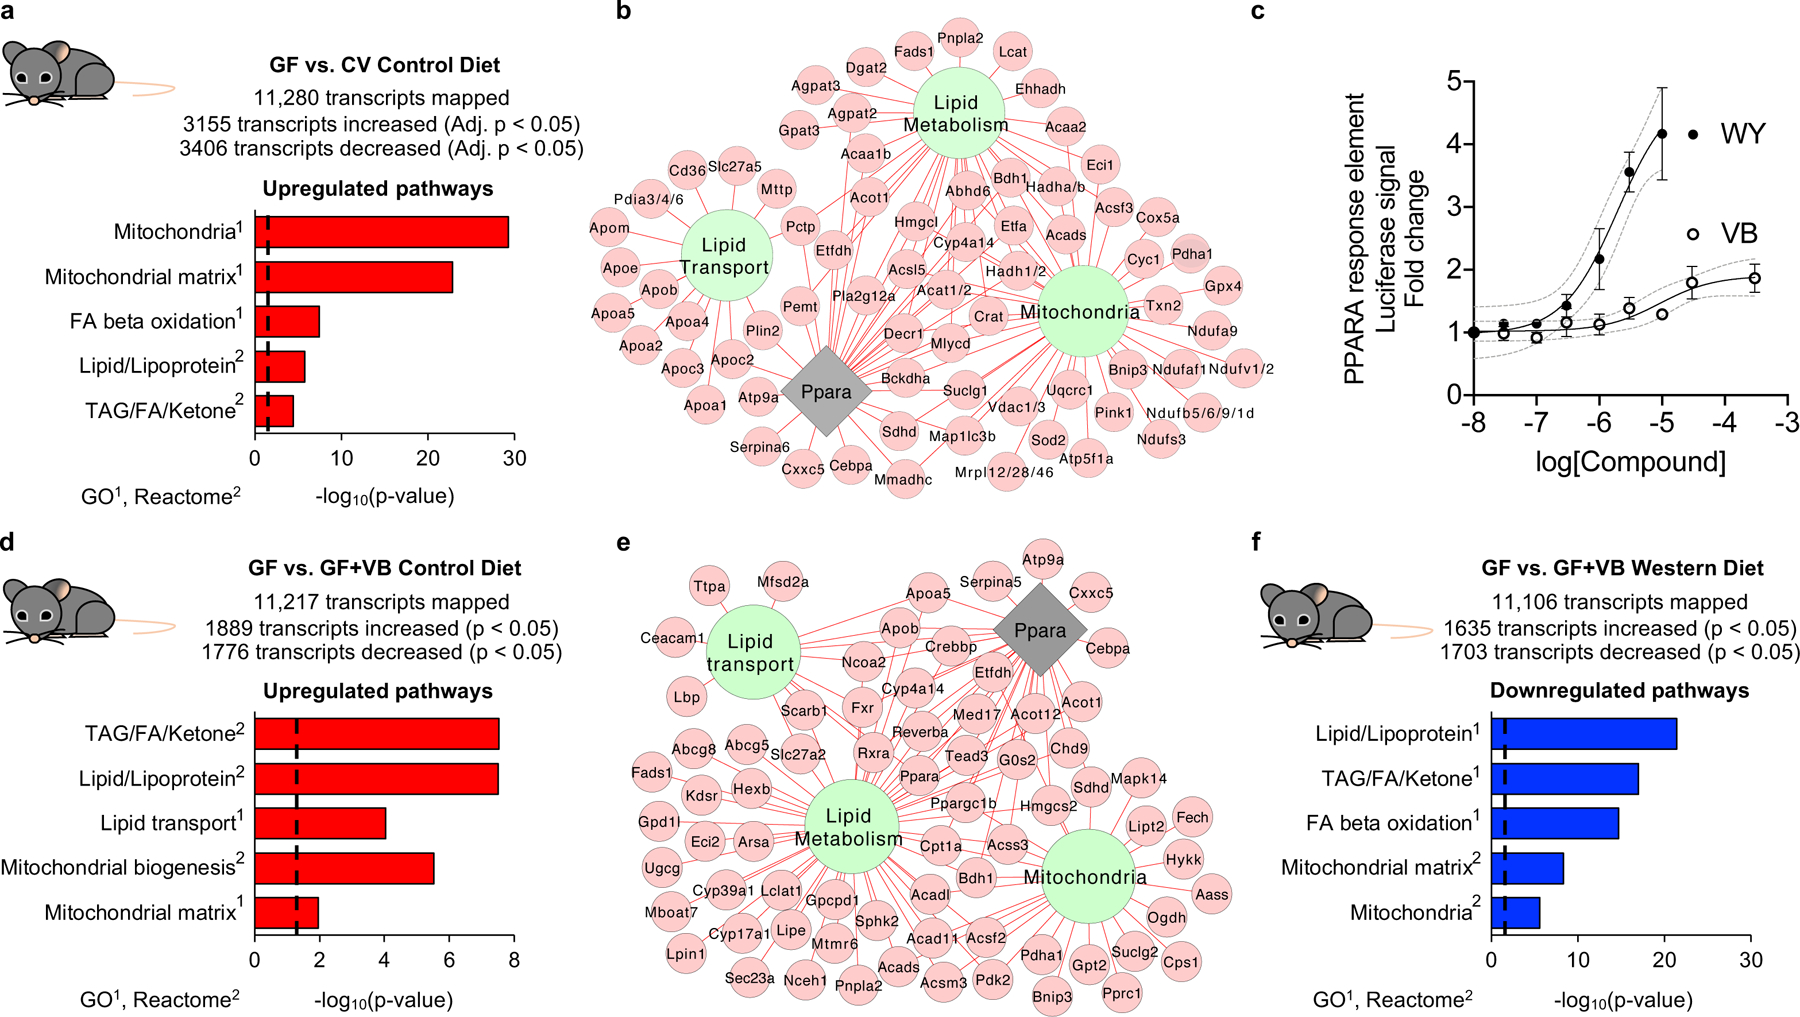
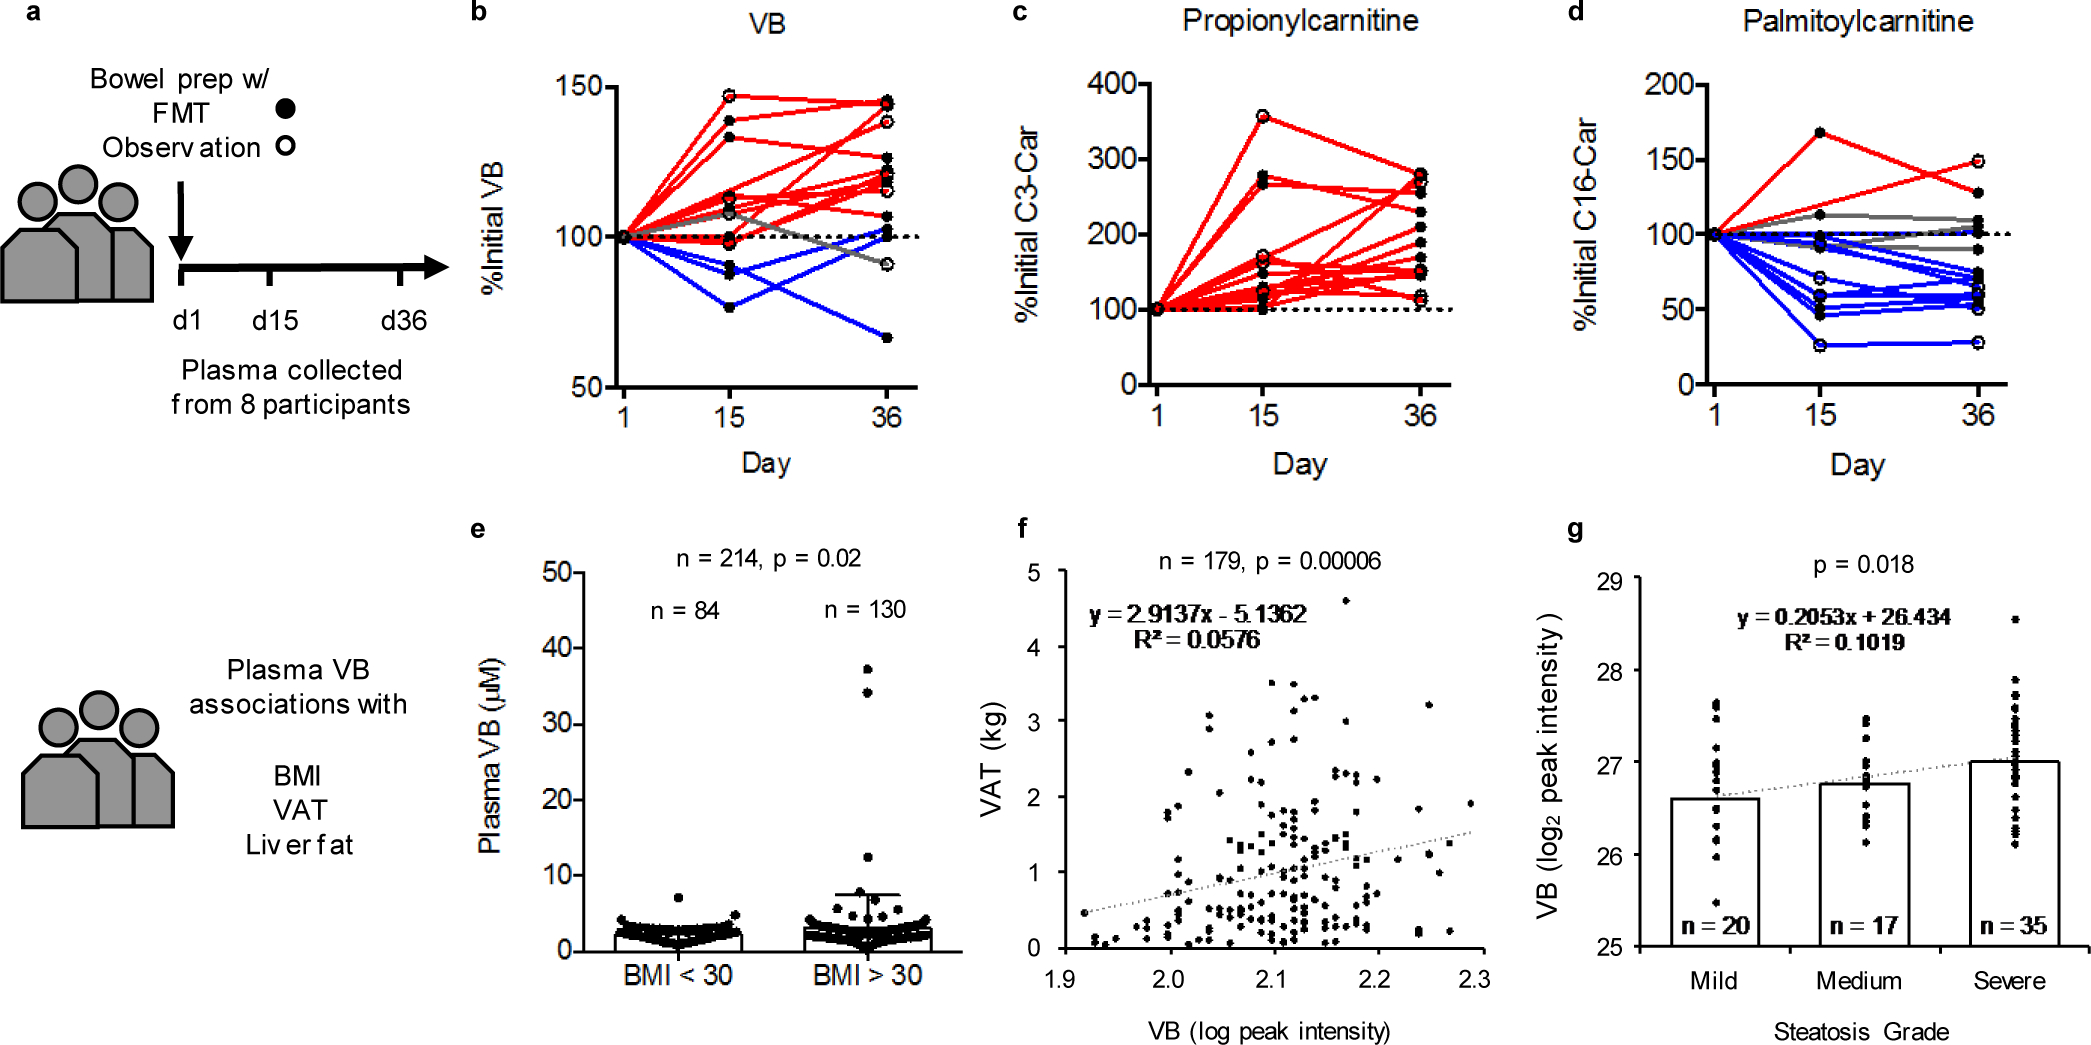
Obesity and obesity-related metabolic disorders are linked to the intestinal microbiome. However, the causality of changes in the microbiome-host interaction affecting energy metabolism remains controversial. Here, we show the microbiome-derived metabolite δ-valerobetaine (VB) is a diet-dependent obesogen that is increased with phenotypic obesity and is correlated with visceral adipose tissue mass in humans. VB is absent in germ-free mice and their mitochondria but present in ex-germ-free conventionalized mice and their mitochondria. Mechanistic studies in vivo and in vitro show VB is produced by diverse bacterial species and inhibits mitochondrial fatty acid oxidation through decreasing cellular carnitine and mitochondrial long-chain acyl-coenzyme As. VB administration to germ-free and conventional mice increases visceral fat mass and exacerbates hepatic steatosis with a western diet but not control diet. Thus, VB provides a molecular target to understand and potentially manage microbiome-host symbiosis or dysbiosis in diet-dependent obesity.


Conflict of interest statement

Competing interests

Authors have no conflict of interest.

Figures

Extended Data Fig. 1
Extended Data Fig. 1. Additional mass spectrometry analysis of VB
Mass spectrometric analysis of VB in a) lung and brain of conventional (C) and germ-free (GF) mice and b) Ion dissociation spectra (MS/MS) analysis of 160.1332 m/z (hcd 30) in cecal contents and mouse diet. VB was not present in GF cecal contents, or the control chow (Teklad) diet used for GF mouse experiments. The fragmentation of 160.1332 m/z in GF cecal contents and GF control diet is consistent with valine betaine (Supplementary Information). c) Ion fragmentation spectra of 160.1332 m/z in GF control diet and extracted ion chromatograms of 160.1332 m/z in all diets used in this study. There was no peak for 160.1332 m/z observed in the Western diet. c) Extracted ion chromatograms of 160.1332 m/z from mouse diets used for this study. VB is not present in the sterilized chow (Teklad) used as the control diet for GF and conventionalization experiments. The conventional chow (Labdiet), which was not autoclavable, was used as the control for conventional mouse experiments. This diet contained a minor peak for VB (red brackets), but the later eluting major peak (0.8m) had a fragmentation pattern observed for 160.1332 m/z (valine betaine) in the GF diet. The small amount of VB present in the Labdiet chow is not the major source of VB in conventional mice since serum VB was equivalent between WD-fed (which does not contain VB) and Labdiet chow-fed conventional mice (Extended data 6c). d) (Nε, Nε, Nε)-trimethyllysine (TML) is a precursor to δ-valerobetaine (VB). (Nε, Nε, Nε)-trimethyllysine (100 mg/kg) or (13C Nε, 13C Nε, 13C Nε)-trimethyllysine (25 mg/kg) was gavaged into conventional mice for 3 days. The formation of unlabeled VB (160.1332 m/z) from TML and labeled VB (163.1431 m/z) from isotopically labeled TML is shown here along with accurate mass MS1 and ion fragmentation spectra consistent with VB and labeled VB.
Extended Data Fig. 2
Extended Data Fig. 2. VB inhibits mitochondrial fatty acid oxidation
a) Tracing the oxidation of 13C16 palmitic acid in HepG2 cells to examine the effect of VB treatment on cellular mitochondrial fatty acid oxidation. 12 hour pretreatment with VB (green) decreased (p = 0.0015 (AUC - Area under the curve), two-tailed student’s t-test) the formation of labeled acetyl-CoA (bottom middle) by approximately 75% compared to vehicle (blue). Addition of carnitine back to cells pretreated with VB for 12 hours (purple) restored the carnitine-dependent formation of mitochondrial acetyl-CoA (p = 0.49 (AUC), two-tailed student’s t-test). Co-treatment of VB with the addition of stable isotope-labeled palmitate (red) decreased the formation of labeled acetyl-CoA by approximately 25% compared to vehicle (p = 0.04 (AUC), two-tailed student’s t-test). Data for VB, carnitine, and other metabolites are shown to illustrate VB treatment does not affect uptake of labeled 13C16 palmitate (middle left), or the conjugation of labeled palmitate to CoA (middle middle). VB treatment decreased carnitine approximately 20% after one hour (top middle) and these changes drive decreased formation of labeled palmitoylcarnitine (middle right), labeled acetyl-CoA (bottom middle), labeled acetylcarnitine (bottom left), and labeled citrate (bottom right). Each data point represents the average of 3 biological replicates ± standard deviation. b) The effects of VB on mitochondrial respiration is dependent on the availability of fuel substrates. In the presence of glucose and glutamine, VB does not decrease basal respiration (ANOVA (F = 6.239, p = 0.0014) with post-hoc test for linear trend (R2 = 0.0078, p = 0.50)) or maximum respiratory capacity after addition of FCCP (ANOVA (F = 2.223, p = 0.10). VB does not influence basal respiration with culture conditions with palmitate but without glucose and glutamine (ANOVA (F = 9.729, p = 0.001) with post-hoc test for linear trend (R2 = 0.075, p < 0.096). Each data point represents at least 8 biological replicates.
Extended Data Fig. 3
Extended Data Fig. 3. VB alters carnitine metabolism in mice.
VB treatment increased a) circulating and b) hepatic VB in conventional mice [Kruskal-Wallis analysis to determine group-wise differences with Dunn’s multiple comparisons test (serum VB males (n = 3 per treatment) – KW statistic 7.2, p = 0.0036; serum VB females (Vehicle n = 5, 10 mg/kg n = 6, 100 mg/kg n = 6) – KW statistic 10.84, p = 0.0008; liver VB males – KW statistic 6.489, p = 0.0107; liver VB females – KW statistic 12.94, p < 0.0001)]. c, d) Pathway enrichment analysis of serum metabolites correlated with VB treatment shows VB alters carnitine shuttle metabolism in male and female mice (p < 0.05, mummichog p-value based on permutation analysis). e) VB decreases circulating carnitines in mice. Correlation heatmaps are based on Spearman’s correlation values with red corresponding to Spearman’s rho = 1 and blue Spearmen’s rho = −1. f) VB treatment increases urinary carnitine in mice (n = 3, time 0 p = 0.126, time 2h p = 0.001, time 6h p = 5.86e-005, two-tailed student’s t-test). g) Fasting does not change circulating (n = 6, p = 0.95, two-tailed student’s t-test) or hepatic (n = 5, p = 0.24, two-tailed student’s t-test) VB compared to fed mice.
Extended Data Fig. 4
Extended Data Fig. 4. VB decreases circulating and hepatic beta-hydroxybutyrate
VB decreases circulating and hepatic beta-hydroxybutyrate, produced from mitochondrial fatty acid oxidation during fasting. Kruskal-Wallis with Dunn’s multiple comparisons test was used for fasted serum and liver analyses (n = 8 vehicle, n = 3 10 mg/kg, n = 5 100 mg/kg for male and female). Male serum KW statistic 7.864, p = 0.0085; female serum KW statistic 10.46, p = 0.0006. Male liver KW statistic 7.864, p = 0.0085; female liver KW statistic 11.73, p = 0.0001. Control vs. 100 mg/kg was significantly different for all comparisons in fasted mice. For fed mice, (n = 3 vehicle, n = 3 10 mg/kg, n = 3 100 mg/kg for male and female), one-way ANOVA with Dunnett’s multiple comparison tests was used. Male serum (ANOVA F = 0.9472, p = 0.4390); Female serum (ANOVA F = 6.8, p = 0.028, vehicle vs. 100 mg/kg significant); Male liver (ANOVA F = 0.9032, p = 0.454); Female liver (ANOVA F = 4.295, p = 0.0695).
Extended Data Fig. 5
Extended Data Fig. 5. Untargeted lipidomics of VB treated mice
VB alters neutral lipid profiles liver, heart, and brain of male and female mice. Neutral lipids from untargeted lipidomic profiling with average fold-change greater than 2 in 100 mg/kg VB-treated mice (n = 5 male, n = 5 female) versus control (n = 5 male, n = 5 female).
Extended Data Fig. 6
Extended Data Fig. 6. Baseline data for long-term mouse experiments with VB
a) Comparison of VB in GF mouse serum and liver after treatment with 25 mg/kg VB with conventional mice on respective control diets. Samples were analyzed after 6 week treatment with VB and normal conventional mice. GF mice control diet was Teklad 2019S chow and conventional mice control diet was LabDiets 5001 chow. Serum GF+VB (n = 5) and conventional (n = 5) comparison (p = 0.01, two-tailed t-test with conventional mice having approximately 1.7x circulating VB compared to GF mice treated with VB. Liver GF+VB (n = 5) and conventional (n = 5) comparison (p = 0.0004, two-tailed t-test with conventional mice having approximately 0.74x liver VB compared to GF mice treated with VB. b) Comparison of carnitine in mouse serum and liver after treatment with 25 mg/kg in GF mice with conventional mouse (control diet) data for comparison. Carnitine is decreased in conventional mice compared to GF mice. VB treatment to GF mice led to serum and liver carnitine concentrations equivalent to conventional mice. (Two-tailed unpaired student t-tests: Serum GFCD vs. GFCD+VB p = 0.0001, GFCD vs. Conventional CD p < 0.0001, GFCD+VB vs. Conventional CD p = 0.395; Liver GFCD vs. GFCD+VB p < 0.0001, GFCD vs. Conventional CD p < 0.0001, GFCD+VB vs. Conventional CD p = 0.6559) c) Comparison of circulating VB in conventional mice (male M, female F) between Western diet (WD) and control chow (Two-tailed unpaired student t-tests: CD male vs. WD male p = 0.4982; CD female vs. WD female p = 0.1653).
Extended Data Fig. 7
Extended Data Fig. 7. Effects of 8-week VB treatment on weight gain and adipose tissue mass in control or Western diet in conventional female mice
Effects of 8-week VB treatment on weight gain and adipose tissue mass in control or Western diet in conventional female mice (n = 5 per treatment). The combination of Western Diet with VB led to approximately a 3–6% increase in body weight compared to Western Diet alone in female mice, however these results were not statistically significant at a p-value threshold of 0.05 (p = 0.14, one-tailed t-test). In control-diet fed female conventional mice (n = 5 per treatment), VB did not increase weight gain (p-value for increase in weight = 0.9803 (1 – 0.0197), one-tailed t-test). VB treatment increased perigonadal visceral adipose tissue (VAT) and posterior subcutaneous adipose (SubQ) tissue mass in conventional female mice fed a Western diet. VB treatment increased interscapular brown adipose tissue (BAT) mass on a control diet but did not increase BAT mass with the Western diet in conventional female mice. One-tailed t-tests with p < 0.05 used to test for an increase in adipose tissue mass following VB treatment.
Extended Data Fig. 8
Extended Data Fig. 8. Cytokine panel following long-term VB treatment to male and female conventional mice
a) Plasma biomarkers of glucose tolerance/insulin resistance (insulin, glucagon, resistin) in conventional mice after 8 weeks of VB treatment (n = 5 per treatment, outliers removed by Robust regression and Outlier removal (ROUT) in Prism 6.0). (One-way ANOVA with Sidak’s multiple comparisons: Insulin male F = 1.648, p = 0.2205; Insulin female F = 1.034, p = 0.4059; Glucagon male F = 0.5165, p = 0.6772; Glucagon female F = 1.723, p = 0.2025; Resistin male F = 4.747, p = 0.0149 [CD vs. CDVB not significant, WD vs. WDVB not significant]; Resistin female F = 2.687, p = 0.0814) b) Plasma biomarkers of inflammation (IL-6, TNF-alpha, MCP-1) in conventional mice after 8 weeks of VB treatment. (One-way ANOVA with Sidak’s multiple comparisons: IL-6 male F = 0.9316, p = 0.4497; IL-6 female F = 1.646, p = 0.2185; TNF-alpha male F = 1.645, p = 0.2186; TNF-alpha female F = 3.241, p = 0.0499 [CD vs. CDVB not significant, WD vs. WDVB not significant]; MCP-1 male F = 2.467, p = 0.1021; MCP-1 female F = 2.048, p = 0.1477).
Extended Data Fig. 9
Extended Data Fig. 9. Transcription factor analysis for Western Diet-fed conventional mice
Transcription factor enrichment analysis shows that Ppara target genes are upregulated by a) microbiome acquisition and VB treatment in control diet fed GF mice. Ppara target genes are downregulated by VB treatment in Western diet (WD) fed GF mice. b) VB treatment in WD fed mice downregulates genes linked to Ppara which function in mitochondria and lipid processing pathways (p-value < 0.005, FC < 0.8)
Extended Data Fig. 10
Extended Data Fig. 10. Urinary carnitine correlations with urinary VB
Urinary carnitine is correlated with urinary VB in humans (n = 143, Pearson’s R = 0.754, p < 0.00001).
Fig. 1.
Fig. 1.. δ-Valerobetaine (VB) is a microbiome-derived mitochondrial metabolite.
a) Volcano-plots of ultra-high-resolution mass spectrometry of extracts from germ-free (GF, blue, n = 6) and conventionalized (CV, red, n = 6) mouse liver and liver mitochondria show a metabolite with accurate mass m/z 160.1332 is higher in CV mouse liver and liver mitochondria. The accurate mass allows prediction of an elemental composition C8H18NO2. The horizontal broken line is at limma FDR (Benjamini-Hochberg) corrected p-value = 0.05, and the vertical broken line is at fold-change (FC) equal two. A list of differentially expressed annotated features is provided in the source data file. b) 160.1332 m/z is detected in liver, portal vein, and cecum of mice with intact microbiome (red extracted ion chromatograms) but not in germ-free mice (blue extracted ion chromatograms). c) Experimental confirmation that the chemical structure of m/z 160.1332 is VB is provided by co-elution and fragmentation pattern for experimental sample and synthesized standard. High-resolution tandem mass spectral analysis shows the characteristic fragmentation pattern of m/z 160.1332 includes the trimethyl ammonium product ion, 60.061 m/z and C5H9O2+, 101.06 m/z. VB standard was synthesized and structure confirmed by 1H-nuclear magnetic resonance spectroscopy (Supplementary figure 2).
Figure 2.
Figure 2.. δ-Valerobetaine (VB) is a microbiome-derived metabolite
a) Proof that VB is generated by the microbiome is obtained by mass spectrometry detection of time-dependent increase in m/z 160.1332 in ex vivo incubation of cecum contents of mice with intact microbiome (red) Linear regression (F = 165.4, p < 0.0001, 95% confidence interval for slope (9.186 to 12.76). Cecum contents from germ-free mice did not generate VB (blue) (F = 2.332, p = 0.1462, slope CI (−2.997 to 0.4872)), and control incubation of mouse food showed no generation of VB (brown) (F = 0.3341, p = 0.5701, slope CI (−1.127 to 0.6393) (n = 3 biological replicates per group). Cecal contents and food were submerged in MRS media. b) Multiple species of commensal and pathogenic bacteria generate VB as shown by time dependent increase in VB (m/z 160.1332) in monocultures. Species included Lactococcus lactis Subsp. cremoris (LC, ATCC 19257), Lactobacillus rhamnosus GG (LGG, ATCC 53103), Lactobacillus rhamnosus (HA-114, R0011), Bacillus cereus (BC), E. coli (K12) [One-sample t-test (H0 = 0), p = 0.024], Streptococcus salivarius (SS), Listeria monocytogenes (LM), Salmonella typhimurium (SL1344) [One-sample t-test (H0 = 0), p = 0.067], and Bifidobacterium longum (LM) [One-sample t-test (H0 = 0), p = 0.0032]. Data are presented as fold-change (%) at 18h compared with initial sample for at least 3 replicates of each monoculture (± SEM). This experiment was designed to test for generation of VB and used different culture conditions for different species; consequently, the relative productions may not be representative of enteric generation. c) 5 day oral gavage of broad spectrum antibiotics [200 microliters of ampicillin (1 mg/mL), gentamicin (1 mg/mL), metronidazole (1 mg/mL), neomycin (1 mg/mL), vancomycin (1 mg/mL)] decreased (p = 0.01, one-tailed t-test) circulating VB in conventional mice.
Fig. 3.
Fig. 3.. Valerobetaine (VB) decreases fatty acid oxidation.
a) Experimental in vitro characterization of VB activity in HepG2 cells. b) VB alters carnitine shuttle metabolism (p < 0.05, mummichog pathway enrichment analysis) and decreases carnitine and acylcarnitines in cultured cells treated with 12h with VB at indicated concentrations (n = 8 each concentration). Spearman correlation analysis with Benjamini-Hochberg FDR corrections were used to identify metabolites with a dose-response relationship with VB-treatment. Data are presented as average relative intensities per treatment with red being the highest relative intensity and blue being the lowest. c) Mitochondrial palmitate-dependent O2 consumption rate is inhibited by VB. HepG2 cells were incubated for 12 h without glucose, glutamine and pyruvate and studied with either vehicle, 10 or 50 μM VB. Effect of VB is most pronounced in the spare capacity measured after addition of the uncoupler FCCP (ANOVA (F = 10.48, p < 0.0001) with post-hoc test for linear trend (R2 = 0.4905, p < 0.0001, Slope −22.79). Data presented are 6–8 biological replicates ± standard error of the mean. d) VB decreases formation of labeled acetyl-CoA from labeled palmitate in cultured HepG2 cells (n = 3 biological replicates for each treatment, Ordinary one-way ANOVA of Area Under the Curve (F = 60.59, p < 0.0001) with Tukey’s multiple comparisons test showing significance between Untreated and VB treated, but not between Untreated and VB + carnitine treated).
Fig. 4.
Fig. 4.. VB increases lipid accumulation in host tissues.
a) Experimental in vivo characterization of VB activity in mice. Mice of each sex were given daily intraperitoneal injection with saline (n = 5), VB at 10 mg/kg (n = 3), or VB at 100 mg/kg (n = 8) for 1 week. b, c) VB decreases circulating and hepatic carnitine in mice. Mice of each sex were given daily intraperitoneal injection with saline (n = 5), VB at 10 mg/kg (n = 3) or VB at 100 mg/kg (n = 8) for 1 week. Kruskal-Wallis test with Dunn’s multiple comparisons test to identify pairwise differences. Serum male (KW statistic – 9.02, p = 0.0029); female serum carnitine (KW statistic 10.98, p = 0.0004); male liver carnitine (KW statistic 11, p = 0.0003); female liver carnitine (KW statistic 10.83, p = 0.0004). d) VB is correlated with increased hepatic palmitoyl-CoA and palmitoylcarnitine in the fasted state. Spearman correlations for selected metabolites in carnitine shuttle metabolism and VB. e) VB is correlated with decreased mitochondrial long chain acylcarnitine and CoAs. f, g) VB exacerbates hepatic steatosis in male and female mice under fasted conditions as measured by Oil Red O staining (Males p = 0.0457, 1-tailed t-test; Females p = 0.0184, 1-tailed t-test) and triglyceride analysis (Males p = 0.0039, 1-tailed t-test; Females p = 0.0278, One-tailed Mann-Whitney). Mice of each sex were given daily intraperitoneal injection with saline (n = 5) or VB at 100 mg/kg (n = 5) for 3 days ± fasting. Scale bar represents 100 μm.
Figure 5.
Figure 5.. Long-term valerobetaine (VB) treatment in GF and conventional mice
a) Male GF mice were administered PBS or VB in conjunction with a control diet (CD) or western diet (WD) for 6 weeks with body weight recorded as percent weight gain. (2-way repeat measures ANOVA with multiple comparisons per day, VB treatment with WD F = 17.19, p = 0.0032, AUC p-value = 0.0028; VB treatment with CD F = 0.4609, p = 0.5164, AUC p-value = 0.5164) Weight of b) visceral adipose tissue (VAT), c) Subcutaneous white adipose tissue (SubQ), d) brown-adipose tissue (BAT) in GF mice after 6 weeks. e) Representative liver hematoxylin and eosin (H&E) stains for each GF group under 40x magnification. Scale bar represents 50 μm. f) Scoring of hepatic steatosis from H&E from GF mice. g) Male conventional mice were administered PBS or VB in conjunction with a CD or WD for 8 weeks with body weight recorded as percent weight gain. Weight of h) VAT, i) SubQ, j) BAT in conventional mice after 8 weeks. (2-way repeat measures ANOVA with multiple comparisons per day, VB treatment with WD F = 1.218, p = 0.3019, AUC p-value = 0.1462; VB treatment with CD F = 0.4609, p = 0.5164, AUC p-value = 0.4917) k) Representative liver H&E stains for each conventional group under 40x magnification. Scale bar represents 50 μm. l) Scoring of hepatic steatosis from H&E from conventional mice. One-way student’s t-test (n = 5, p < 0.05) used for comparisons unless otherwise noted.
Fig. 6.
Fig. 6.. VB participates in microbiome-mitochondria communication to reprogram host lipid metabolism.
a) Mitochondria and lipid pathways are the top transcriptome pathways upregulated in mouse liver following microbiome acquisition [conventionalized mice (CV)] (n = 6 per group). Results from differential expression analysis were filtered with a Benjamini-Hochberg FDR < 0.05 and increased by 2-fold in CV mice over GF mice samples for pathway enrichment analysis. b) Gene expression for mitochondrial energy metabolism, FA uptake, FA oxidation, TAG biosynthesis, and lipoprotein assembly and export are increased (Benjamini-Hochberg FDR < 0.05, FC > 2) in CV mice. Many of these changes were linked to activation of Ppar-α. c) VB treatment elicits a dose-dependent increase in PPAR-response element linked luciferase activity in HepG2 cells. The calculated EC50 for VB is 14 μM, similar to concentrations observed in the portal circulation of conventional mice. Data for Wy14643, a synthetic PPAR-alpha agonist (EC50 = 1.9 μM), shown for comparison. Data are displayed as the mean ± S.D. of 3 biological replicates. d) Mitochondria and lipid pathways are upregulated in GF mice treated with VB (n = 5 per group). Transcripts increased (raw p-value < 0.005, FC > 1.2) in VB-treated control diet fed GF mice were used for pathway enrichment analysis. e) Gene expression for mitochondria and lipid pathways linked to Ppar-α activation are upregulated (raw p-value < 0.005, FC > 1.2) by VB treatment in GF mice with the control diet. f) Mitochondria and lipid pathways were downregulated by VB treatment in GF mice with the Western diet. Transcripts decreased (raw p-value < 0.005, FC < 0.8) in VB-treated Western diet fed GF mice were used for pathway enrichment analysis. For b and e, green nodes indicate Reactome pathways or gene ontologies, the grey node represents transcription factor enrichment, red edges/nodes indicate increased transcript abundance.
Figure 7.
Figure 7.. Clinical associations of plasma VB with microbiome manipulation and obesity-related phenotypes in people.
a) Fecal microbiota transplantation (FMT) clinical trial design at Emory University Hospital. b) Circulating VB increases in 11 out of 15 cycles following treatment (χ2 = 11.2, DF 2, p = 0.0037). c) Circulating propionycarnitine increases in all cycles following treatment (χ2 = 30, DF 2, p < 0.0001). d) Circulating palmitoylcarnitine decreases in 10 out of 15 cycles following treatment (χ2 = 7.6, DF 2, p = 0.0224). e) In a subclinical population of individuals without diagnosis of disease, individuals with BMI > 30 (n = 130) have higher VB concentration than individuals with BMI < 30 (n=84) (One-tailed t-test (p = 0.0213) with Welch’s correction, F, DFn, Dfd: 20.79, 129, 83, p < 0.0001). f) Plasma VB is correlated with increased central adiposity in adults (Visceral Adipose Tissue mass, n = 179, p = 0.00006). g) Plasma VB is positively associated with severity of hepatic steatosis in adolescents (n = 74, β = 0.345, p < 0.02).

Comment in

References

    1. Miranda JJ et al. Understanding the rise of cardiometabolic diseases in low- and middle-income countries. Nature medicine 25, 1667–1679, doi:10.1038/s41591-019-0644-7 (2019). - DOI - PubMed
    1. Wang Y et al. Has the prevalence of overweight, obesity and central obesity levelled off in the United States? Trends, patterns, disparities, and future projections for the obesity epidemic. LID - dyz273 [pii] LID - 10.1093/ije/dyz273 [doi]. - DOI - PMC - PubMed
    1. Carding S, Verbeke K, Vipond DT, Corfe BM & Owen LJ Dysbiosis of the gut microbiota in disease. - PMC - PubMed
    1. Rosenbaum M, Knight R & Leibel RL The gut microbiota in human energy homeostasis and obesity. Trends Endocrinol Metab 26, 493–501, doi:10.1016/j.tem.2015.07.002 (2015). - DOI - PMC - PubMed
    1. Ignacio A et al. Correlation between body mass index and faecal microbiota from children. Clin Microbiol Infect 22, 258 e251–258, doi:10.1016/j.cmi.2015.10.031 (2016). - DOI - PubMed

Publication types

LinkOut - more resources