. 2021 Dec;3(12):1662-1679.
doi: 10.1038/s42255-021-00499-0. Epub 2021 Dec 20.

Insulin signalling in tanycytes gates hypothalamic insulin uptake and regulation of AgRP neuron activity

Affiliations

Insulin signalling in tanycytes gates hypothalamic insulin uptake and regulation of AgRP neuron activity

Marta Porniece Kumar et al. Nat Metab. 2021 Dec.

Abstract

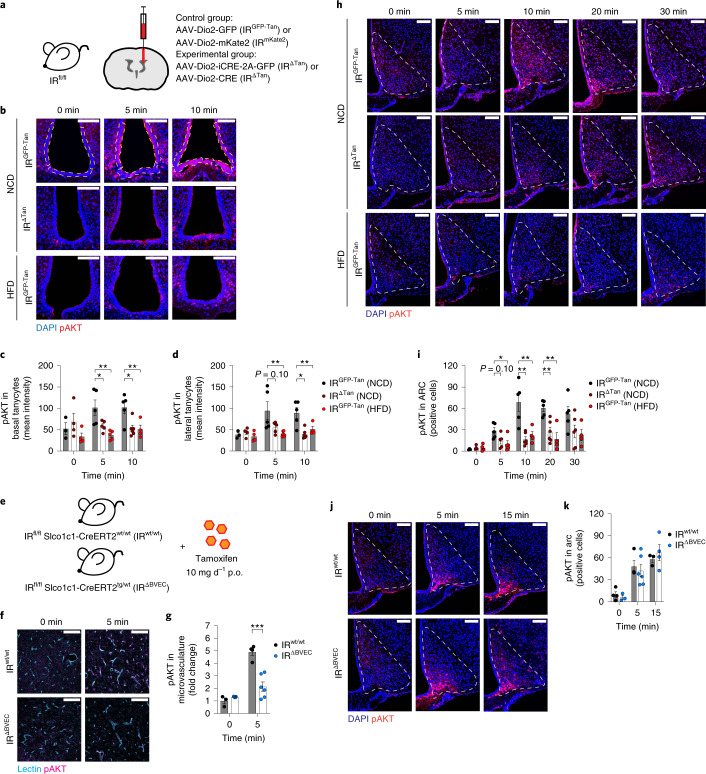
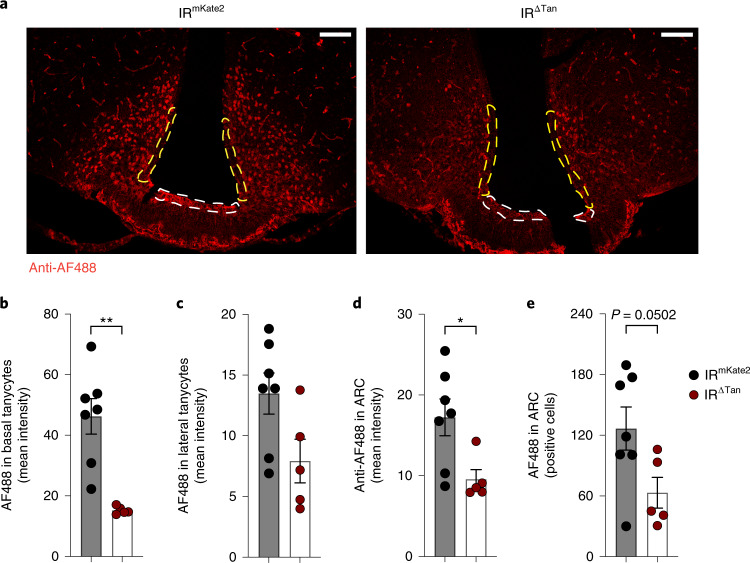
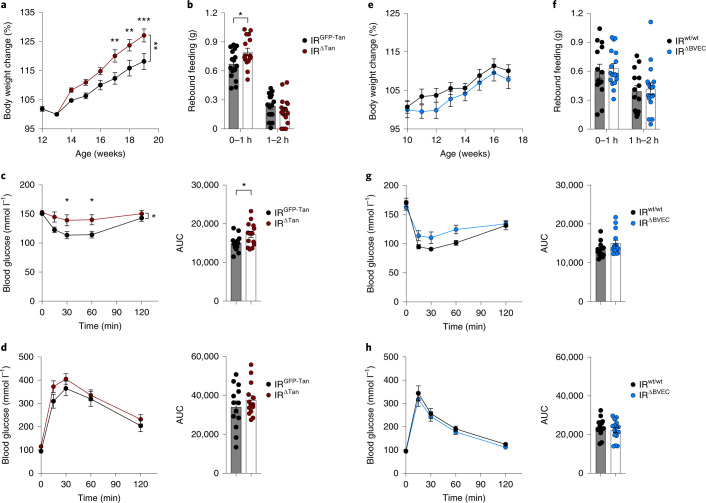
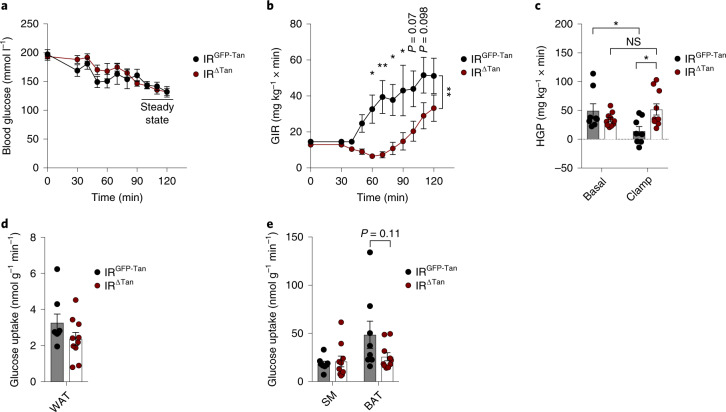
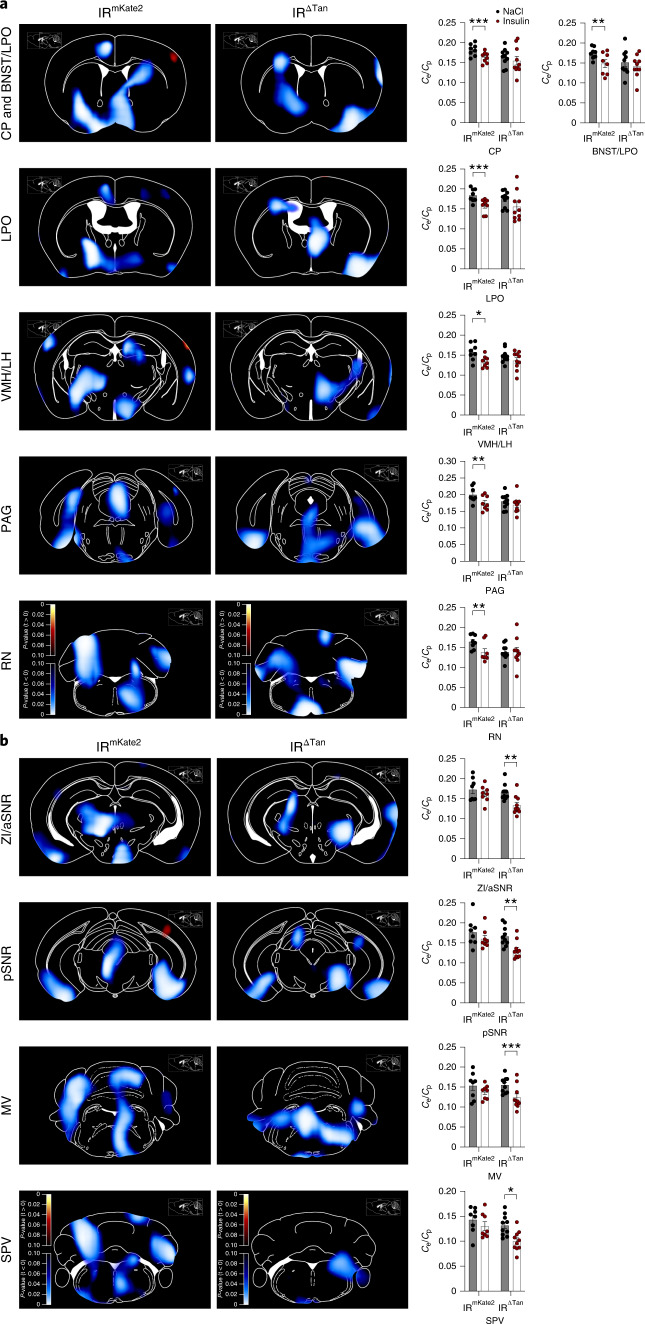
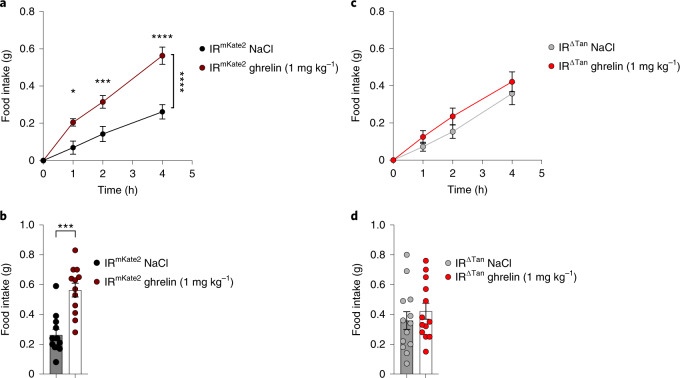
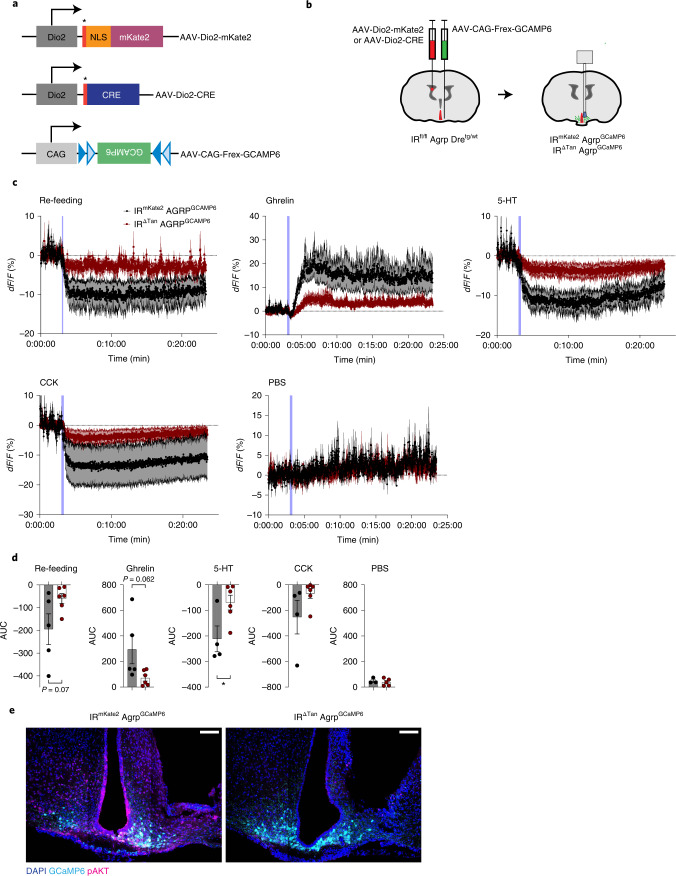
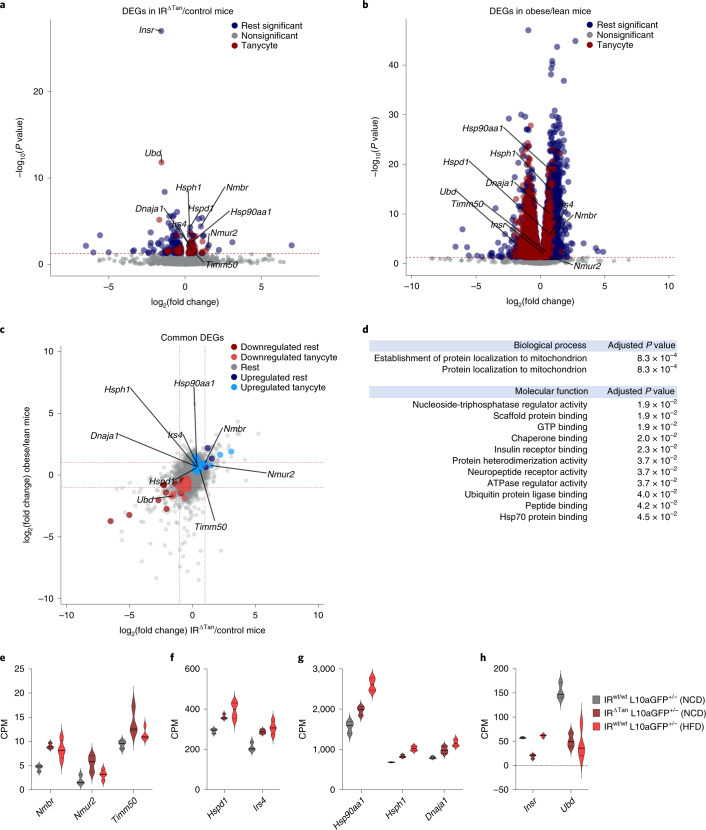
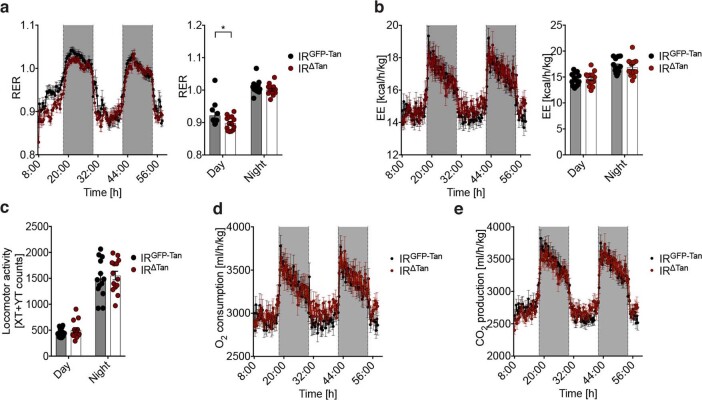
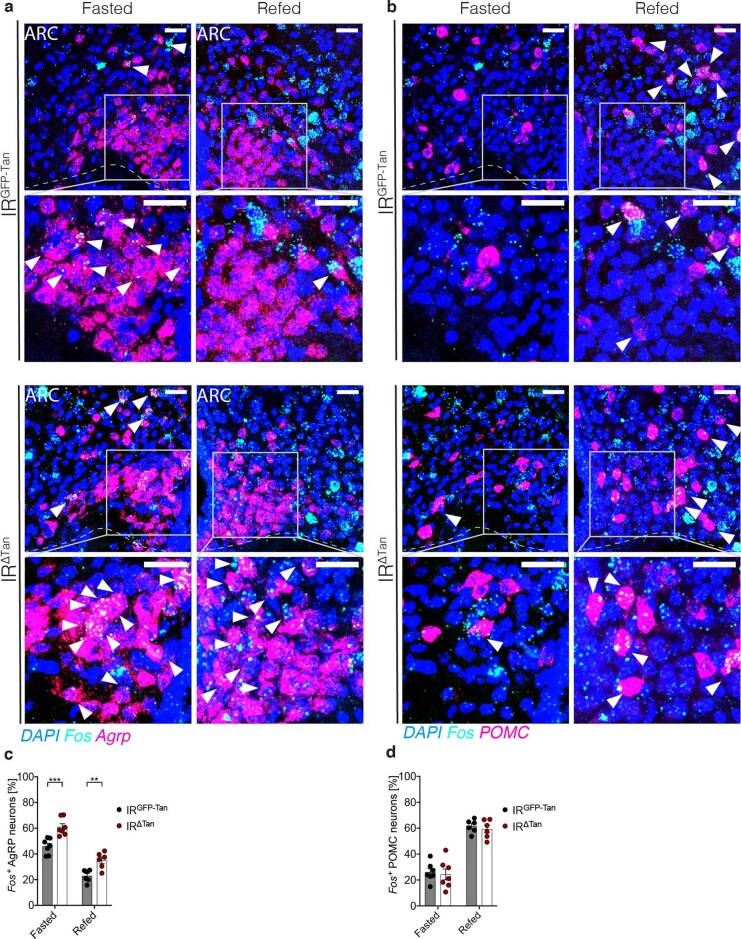
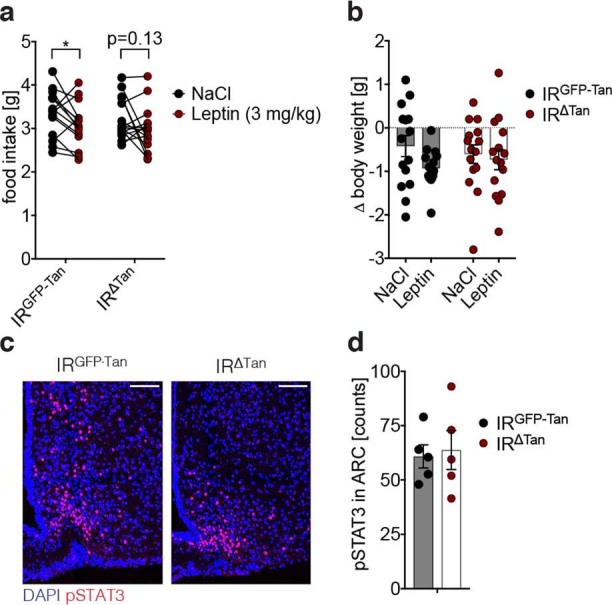
Insulin acts on neurons and glial cells to regulate systemic glucose metabolism and feeding. However, the mechanisms of insulin access in discrete brain regions are incompletely defined. Here we show that insulin receptors in tanycytes, but not in brain endothelial cells, are required to regulate insulin access to the hypothalamic arcuate nucleus. Mice lacking insulin receptors in tanycytes (IR∆Tan mice) exhibit systemic insulin resistance, while displaying normal food intake and energy expenditure. Tanycytic insulin receptors are also necessary for the orexigenic effects of ghrelin, but not for the anorexic effects of leptin. IR∆Tan mice exhibit increased agouti-related peptide (AgRP) neuronal activity, while displaying blunted AgRP neuronal adaptations to feeding-related stimuli. Lastly, a highly palatable food decreases tanycytic and arcuate nucleus insulin signalling to levels comparable to those seen in IR∆Tan mice. These changes are rooted in modifications of cellular stress responses and of mitochondrial protein quality control in tanycytes. Conclusively, we reveal a critical role of tanycyte insulin receptors in gating feeding-state-dependent regulation of AgRP neurons and systemic insulin sensitivity, and show that insulin resistance in tanycytes contributes to the pleiotropic manifestations of obesity-associated insulin resistance.


Conflict of interest statement

A.S. and T.Å.P. are current employees and stakeholders at Novo Nordisk A/S. The labelled insulin was provided by Novo Nordisk as well. The other authors declare no competing interests.

Figures

Fig. 1
Fig. 1. IR in tanycytes is necessary for insulin signalling in the ARC.
a, Knockout strategy to inactivate IR specifically in tanycytes. Animals 10–12 weeks old received i.c.v. injection of either control virus AAV-Dio2-GFP or AAV-Dio2-mKate2 (IRGFP-Tan, IRmKate2) or Cre-recombinase-carrying virus AAV-Dio2-iCRE-GFP or AAV-Dio2-Cre (IRΔTan). b, Representative images of pAKT signal in basal and lateral tanycytes of unstimulated (0 min) and 5 and 10 min post i.v. injection of 0.5 IU kg−1 insulin in NCD-fed control animals IRGFP-Tan (NCD) (top panel), tanycyte-specific IR KO animals (IRΔTan) (NCD) (middle panel) and HFD-fed control animals IRGFP-Tan (HFD) (lower panel). pAKT was quantified in DAPI-positive tanycyte layer. White and yellow dashed lines indicate quantified ROI in basal and lateral tanycytes, respectively. c,d, Mean intensity of pAKT signal in DAPI-positive nuclei of basal (c) and lateral tanycytes (d). c, 5 min: P(IRGFP-Tan (NCD) versus IRΔTan (NCD)) = 0.047, P(IRGFP-Tan (NCD) versus IRGFP-Tan (HFD)) = 0.0041; 10 min: P(IRGFP-Tan (NCD) versus IRΔTan (NCD)) = 0.0144, P(IRGFP-Tan (NCD) versus IRGFP-Tan (HFD)) = 0.0205. d, P(IRGFP-Tan (NCD) versus IRΔTan (NCD)) = 0.0994, P(IRGFP-Tan (NCD) versus IRGFP-Tan (HFD)) = 0.0151; 10 min: P(IRGFP-Tan (NCD) versus IRΔTan (NCD)) = 0.0031, P(IRGFP-Tan (NCD) versus IRGFP-Tan (HFD)) = 0.0309. bd, n(0 min) = 3/IRGFP-Tan (NCD), 4/IRΔTan (NCD), 4/IRGFP-Tan (HFD); n(5 min) = 5 mice per group; n(10 min) = 5/IRGFP-Tan (NCD), 6/IRΔTan (NCD), 4/IRGFP-Tan (HFD). e, Knockout strategy to inactivate IR in endothelial cells. The 10–12-week-old IRfl/fl Slco1c1-CreERT2wt/wt and IRfl/fl Slco1c1-CreERT2tg/wt littermates received tamoxifen (10 mg d−1, 5 d). f, Representative images of pAKT signal in lectin-positive brain cortices of unstimulated mice (0 min) and 5 min post i.v. injection of 0.5 IU kg−1 insulin in IRwt/wt and IRΔBVEC mice. g, pAKT in lectin-positive microvessels, normalized to IRwt/wt control animals. P(5 min) = 0.0007. f,g, n(0 min) = 3/IRwt/wt, 4/IR ΔBVEC; n(5 min) = 4/IRwt/wt, 6/IR ΔBVEC (unpaired, two-sided Student’s t-test). h, Representative images of pAKT in the ARC of unstimulated mice (0 min) and 5, 10, 20 and 30 min post i.v. injection of 0.5 IU kg−1 insulin in NCD-fed control animals IRGFP-Tan (NCD) (top panel), tanycyte-specific IR KO animals IRΔTan (NCD) (middle panel) and HFD-fed control animals IRGFP-Tan (HFD) (lower panel). i, Quantification of pAKT-positive cells per ARC hemisphere. 5 min: P(IRGFP-Tan (NCD) versus IRΔTan (NCD)) = 0.104, P(IRGFP-Tan (NCD) versus IRGFP-Tan (HFD)) = 0.0341; 10 min: P(IRGFP-Tan (NCD) versus IRΔTan (NCD)) = 0.0014, P(IRGFP-Tan (NCD) versus IRGFP-Tan (HFD)) = 0.0069; 20 min: P(IRGFP-Tan (NCD) versus IRΔTan (NCD)) = 0.007, P(IRGFP-Tan (NCD) versus IRGFP-Tan (HFD)) = 0.0023. h,i, n(0 min) = 3/IRGFP-Tan (NCD), 4/IRΔTan(NCD), 4/IRGFP-Tan (HFD); n(5 min) = 5 mice per group; n(10 min, 20 min, 30 min) = 5/IRGFP-Tan (NCD), 6/IRΔTan(NCD), 4/IRGFP-Tan (HFD). j, Representative images of pAKT in ARC of unstimulated mice (0 min) and 5 and 15 min post i.v. injection of 0.5 IU kg−1 insulin in tamoxifen-treated IRwt/wt and IRΔBVEC mice. k, Quantification of pAKT-positive cells per hemisphere of ARC in treated IRwt/wt and IRΔBVEC mice. j,k, n(0 min) = 4/IRwt/wt, 3/IRΔBVEC; n(5 min) = 3/IRwt/wt, 5/IRΔBVEC; n(5 min) = 3/IRwt/wt, 4/IRΔBVEC. c,d,i, One-way ANOVA, Tukey post hoc test. Data are represented as the mean ± s.e.m. b,f,h,k, Scale bar, 100 µm. KO, knockout; p.o., per oral; ROI, region of interest. Source data
Fig. 2
Fig. 2. Insulin uptake in tanycytes and MBH is distorted in IR∆Tan mice.
a, Representative images of immunostaining for fluorescently labelled insulin (anti-Alexa-Fluor-488) 15 min post i.v. injection of 488-insulin (250 nmol kg−1) in IRfl/fl mice, which received either AAV-Dio2-mKate2 (IRmKate2) control or Cre-recombinase-expressing AAV-Dio2-Cre virus (IRΔTan). 488-insulin was quantified in DAPI-positive tanycyte layer. White and yellow dashed lines indicate quantified ROI in basal and lateral tanycytes, respectively. bd, Mean intensity signal of Alexa-Fluor-488 fluorescent insulin in basal, P = 0.013, (b) and lateral (c) tanycytes and ARC, P = 0.0251, (d) of IRmKate2 and IRΔTan mice. e, Quantification of Alexa-Fluor-488-positive cells per hemisphere of ARC of IRmKate2 and IRΔTan mice, P = 0.0502. b,d,e, Unpaired, two-sided Student’s t-test. ae, n = 7/IRmKate2, 5/IRΔTan. Data are represented as the mean ± s.e.m. Scale bar, 100 µm. Source data
Fig. 3
Fig. 3. Tanycyte but not endothelial IR is necessary to maintain insulin sensitivity and rebound food intake.
a,e, Body weight change of IRGFP-Tan and IRΔTan mice normalized to 1 week post i.c.v. injection (13 weeks) (a) and IRwt/wt and IRΔBVEC mice normalized to 1 week post tamoxifen treatment (11 weeks) (e), n = 13/IRGFP-Tan, IRwt/wt; n = 14/IRΔTan; n = 15/IRΔBVEC. a, Two-way ANOVA P = 0.0064, P(17 w) = 0.0055, P(18 w) = 0.0046, P(19 w) = 0.0008 (two-way ANOVA, Šídák post hoc test). b,f, Rebound food intake after 16-h fasting of IRGFP-Tan and IRΔTan mice, P(0–1 h) = 0.028, (b) and IRwt/wt and IRΔBVEC mice (f); n = 16/IRGFP-Tan, IRΔTan; n = 17/IRwt/wt, IRΔBVEC (unpaired, two-sided Student’s t-test). c,g, Insulin tolerance test and area under the curve (AUC) of IRGFP-Tan and IRΔTan mice (c) and IRwt/wt and IRΔBVEC mice (g), n = 13/IRGFP-Tan, IRwt/wt; n = 14/IRΔTan; n = 15/IRΔBVEC, c, Two-way ANOVA P = 0.0334, P(30 min) = 0.0327, P(60 min) = 0.0318 (two-way ANOVA, Šídák post hoc test), P(AUC) = 0.031. d,h, Glucose tolerance test and AUC of IRGFP-Tan and IRΔTan mice (d) and IRwt/wt and IRΔBVEC mice (h), n = 13/IRGFP-Tan, IRwt/wt; n = 14/IRΔTan; n = 15/IRΔBVEC. ah, Data are represented as the mean ± s.e.m. w, weeks. Source data
Fig. 4
Fig. 4. Regulation of glucose homoeostasis in tanycyte-specific IR knockout animals.
a, Blood glucose levels during the hyperinsulinaemic–euglycaemic clamp period of IRGFP-Tan and IRΔTan mice. b, GIR during the clamp period of IRGFP-Tan and IRΔTan mice, two-way ANOVA P = 0.0048, P(60 min) = 0.0287, P(70 min) = 0.0027, P(80 min) = 0.0213, P(90 min) = 0.0131 (two-way ANOVA, Šídák post hoc test). c, HGP measured under basal and steady-state conditions during the clamp of IRGFP-Tan and IRΔTan mice, P(IRGFP-Tan (basal) versus IRGFP-Tan (clamp)) = 0.0493, P(IRGFP-Tan (clamp) versus IRΔTan (clamp)) = 0.0227, P(IRΔTan (basal) versus IRΔTan (clamp)) = 0.4341 (one-way ANOVA, Tukey post hoc test). d,e, Tissue-specific insulin-stimulated glucose uptake rates of IRGFP-Tan and IRΔTan mice in WAT (d), skeletal muscle (SM) and BAT (e), e unpaired, two-sided Student’s t-test. ae, n = 8/IRGFP-Tan; n = 10/IRΔTan. Data are represented as the mean ± s.e.m. NS, not significant. * - P <0.05, ** - P <0.01, *** - P <0.001. Source data
Fig. 5
Fig. 5. Altered insulin-evoked signalling in IRΔTan mice.
a,b, Parametric maps of P values from paired t-test of differences in cumulative glucose metabolism over the recorded time determined by [18 F]FDG PET between insulin-stimulated (16-h fasted, i.p. 0.325 IU kg−1 insulin) and NaCl (0.9%)-injected, anaesthetized IRmKate2 and IRΔTan mice (n = 8/IRmKate2; n = 10/IRΔTan). Brain regions that had significantly reduced cumulative glucose metabolism in IRmKate2 were not altered in IRΔTan mice (a), and brain regions that had significantly reduced signal in IRΔtan remained unaltered in IRmKate2 (b). Blue colour scale indicates regions where metabolism at NaCl > insulin (inhibition on insulin injection). Sagittal reference image inserts show location of corresponding coronal plates. Ce/Cp is the ratio of tissue and blood glucose concentrations, a blood glucose level-insensitive measure for glucose metabolism. CP, caudate putamen; BNST/LPO, bed nucleus of stria terminalis/lateral preoptic area; PAG, periaqueductal grey; RN, reticular nucleus; ZI/aSNR, zona incerta/anterior substantia nigra; pSNR, posterior substantia nigra; MV, medial vestibular nucleus; SPV, spinal vestibular nucleus. Paired, two-sided Student’s t-test. a, For IRmKate2 P(CP) = 0.0007, P(BNST/LPO) = 0.0056, P(LPO) = 0.0003, P(VMH/LH) = 0.0109, P(PAG) = 0.0015, P(RN) = 0.0097, b, For IRΔTan P(ZI/aSNR) = 0.003, P(pSNR) = 0.0023, P(MV) = 0.0006, P(SPV) = 0.0105. Data are represented as the mean ± s.e.m. * - P <0.05, ** - P <0.01, *** - P <0.001. Source data
Fig. 6
Fig. 6. Tanycyte IR is required for ghrelin access in ARC.
a, Food intake in random-fed IRmKate2 control animals after NaCl (0.9%) or ghrelin injection (i.p., 1 mg kg−1) over the 4-h measurement time. Two-way ANOVA P = 0.0002, P(1 h) = 0.013, P(2 h) = 0.0009, P(4 h) < 0.0001 (two-way ANOVA, Šídák post hoc test). b, Food intake 4 h post treatment with NaCl (0.9%) or ghrelin (i.p., 1 mg kg−1) in IRmKate2 control animals, P = 0.0001 (paired, two-tailed Student’s t-test). a,b, n = 12/IRmKate2. c, Mean food intake in random-fed IRΔTan animals after saline or ghrelin injection (i.p., 1 mg kg−1) over the 4-h measurement time. d, Food intake 4 h post treatment with NaCl or ghrelin injection (i.p., 1 mg kg−1) in IRΔTan animals. c,d, n = 13/IRΔTan. ad, Data are represented as the mean ± s.e.m. * - P <0.05, ** - P <0.01, *** - P <0.001, **** - P <0.0001. Source data
Fig. 7
Fig. 7. Altered AgRP neuron calcium dynamics in response to food and gut hormones in IR∆Tan mice.
a, Tanycyte- and AgRP neuron-specific rAAVs, which were employed to record AgRP neuron dynamics. NLS, nuclear localization signal; *Kozak sequence. b, Targeting strategy of tanycytes and AgRP to record AgRP neuron dynamics in mice with inactivated IR in tanycytes. At age 10 weeks IRfl/fl Agrp-2a-Dretg/wt were injected with rAAV into the lateral ventricle expressing either Cre-recombinase (AAV-Dio2-CRE) or mKate2 fluorescent protein (AAV-Dio2-mKate2), and in the ARC unilaterally with an AAV virus carrying Dre-dependent, neuron-specific AAV-CAG-Frex-GCAMP6 flanked by two rox sites. c,d, Calcium signal traces (c) and AUC (d) from AgRP neurons in nonfasted IRmKate2 AgRPGCaMP6 and IR∆Tan AgRPGCaMP6 mice treated with ghrelin (60 µg per mouse, i.p.) and in 16-h-fasted IRmKate2 AgRPGCaMP6 and IR∆Tan AgRPGCaMP6 mice exposed to food pellet, treated with CCK (10 µg kg−1, i.p.), 5-HT (2 mg kg−1, i.p.) or PBS control (10 µl g−1 body weight, i.p.). Blue lines in the figure indicate the time of the intervention. Data are represented as the mean ± s.e.m. n = 3–6 mice per group. P(5-HT) = 0.030 (unpaired, two-tailed Student’s t-test (d)), *P ≤ 0.05. e, Representative images of GCaMP6 expression and pAKT signal in ARC 10 min post i.v. injection of insulin (0.5 IU kg−1) of IRmKate2 AgRPGCaMP6 and IR∆Tan AgRPGCaMP6 mice at the end of the fibre photometry recordings, n = 3–6 mice per group. Scale bar, 100 µm. dF/F, represents the change in GCaMPs fluorescence from the mean level before the treatment. Source data
Fig. 8
Fig. 8. TRAP-based RNA sequencing identifies coordinated regulation of mitochondrial quality control.
a,b, Volcano plots of nonsignificant genes (Nonsignificant, adjusted P > 0.05) and significant (adjusted P < 0.05) tanycyte-unrelated (Rest significant) and tanycyte-related (Tanycyte) genes in NCD control/IRΔTan (a) and NCD control/HFD control (b), shown as DEGs. c, Overlap analysis of DEGs in tanycytes of both comparisons (coloured region) revealed 60 out of 74 and 28 out of 50 tanycyte-specific upregulated and downregulated genes, respectively. d, GO analysis revealed upregulated biological processes and molecular functions in tanycytes of NCD control/IRΔTan versus NCD control/HFD control. P values are FDR-adjusted using Benjamini–Hochberg correction. a,b, Significantly differentially enriched transcripts (P ≤ 0.05) are indicated in the coloured region (P values were FDR-adjusted for multiple comparisons using Wald test). Red dashed line indicates the significance level (adjusted P < 0.05). Highlighted genes were selected from upregulated GO terms: protein localization to mitochondrion (Timm50, Dnaja1, Hsp90aa1, Hspd1, Hsph1), neuropeptide receptor activity (Nmbr, Nmur2), IR binding (Irs4). c, Red dashed line indicates the log2(fold change) = ±1. eh, Expression values of selected upregulated genes with low (e), medium (f) or high (g) expression and of selected downregulated (h) genes. n = 3/NCD control mice and NCD IRΔTan, n = 4/HFD control. CPM, counts per million reads; FDR, false discovery rate. Source data
Extended Data Fig. 1
Extended Data Fig. 1. Validation of Cre-mediated recombination in tanycytes.
a. Expression profiles of tanycytes specific Cre-expressing rAAVs in reporter mice across the brain. Expression of AAV-Dio2-iCRE-GFP was assessed in ROSA26|STOP|tdTomatofl/fl reporter mice 3 weeks post i.c.v. injection in ARC, d3V, LV and AP. AAV-Dio2-Cre was injected i.c.v. in mice expressing Cre-dependent ZsGreen reporter from ROSA26 locus (Rosa26|STOP|ZsGreenfl/fl) and assessed in ARC, SFO, LV and AP. Virus expression and fluorescence of the ZsGreen reporter was assessed 3 – 4 weeks post injection in 3 – 5 mice. b. AAV-Dio2-GFP representative images were acquired from IRGFP-Tan mice 6 weeks post injection. AAV-Dio2-mKate2 expression in tanycyte nuclei was verified in IRfl/fl mice 3 weeks post injection. Because AAV-Dio2-mKate2 exhibited a weak fluorescent signal, it was amplified with immunohistochemistry staining for red fluorescent protein (RFP). All viruses were expressed in the lateral and basal tanycytes of the 3rd ventricle. n = 4/group. c. Representative images of smISH of ZsGreen mRNA expression in mediobasal hypothalamus of Rosa26|STOP | ZsGreenfl/fl-mice 3 weeks post i.c.v. injection of AAV-Dio2-Cre virus in 5 mice. Expression of Zsgreen reporter gene was assessed in the anterior and posterior hypothalamus (c1 – medial dorsal, c2 – medial ventral, c3 – posterior dorsal, c4 – posterior ventral) by co-labelling for tanycyte- (Dio2) and astrocyte- (GFAP) specific genes. Dashed lines indicate the outline of the ARC. ARC – arcuate nucleus, d3V – dorsal third ventricle, SFO - subfornical organ, LV – lateral ventricle, AP – Area Postrema.
Extended Data Fig. 2
Extended Data Fig. 2. Verification of IR inactivation in tanycytes, HFD-induced insulin resistance in IRGFP-Tan-mice, and assessment of insulin signalling in VMH and LH of IRΔTan-mice.
a. Microphotographs of smFISH assessing Insr expression in lateral (B’, B’) and basal (B’’) tanycytes of IRGFP-Tan and IRΔTan animals. b. Quantification of Insr positive cells in lateral and basal tanycytes. a-b. p(lateral) = 0.0026, p(basal) = 0.0186, n = 5/IRGFP-Tan, n = 7/IRΔTan. c. Body weight of NCD and HFD fed IRGFP-Tan animals. Animals were fed a HFD starting at 4 weeks of age, at 12 weeks mice received an i.c.v. injection with the AAV-Dio2-GFP virus. d. ITT of NCD and HFD fed IRGFP-Tan animals (as in Fig. 3c). e. GTT of NCD and HFD fed IRGFP-Tan animals (as in Fig. 3c). c-e. n = 13/IRGFP-Tan (NCD), 14/IRGFP-Tan (HFD). f-i. Representative images and quantification of pAKT immunostaining in ventromedial hypothalamus (g, h) and lateral hypothalamus (I, j) of unstimulated mice and 5, 10, 20 and 30 min post i.v. injection of 0.5 IU/kg insulin in IRGFP-Tan (top panel) or IRΔTan (bottom panel). n(0 min) = 3/IRGFP-Tan (NCD), 4/IRΔTan(NCD); n(5 min) = 4/IRGFP-Tan (NCD), 5/IRΔTan (NCD); n(10 min, 20 min, 30 min) = 5/IRGFP-Tan (NCD), 6/IRΔTan (NCD). For VMH: p(10 min) = 0.0012, p(20 min) = 0.0058, p(30 min) = 0.023, a-b, f-i. unpaired, two-tailed Student’s t-test. Data are represented as the mean ± SEM. Scale bar: 100 µm. Source data
Extended Data Fig. 3
Extended Data Fig. 3. Validation of Cre-mediated recombination in brain vascular endothelial cells.
a. PCR for wildtype insulin receptor gene (IR) and Exon 4 deleted insulin receptor allele (IR del) in hypothalamus, cortex, muscle, liver, BAT and WAT of IRfl/fl Slco1c1-CreERT2wt/wt (wt) and IRfl/fl Slco1c1-CreERT2tg/wt mice (tg) 8 weeks post tamoxifen treatment (n = 4/4). L – Gene Ruler 1 kb Plus DNA ladder. b. ZsGreen reporter protein expression in hypothalamus, cortex, brain vasculature, skeletal muscle, liver, BAT, WAT and pancreas of Rosa26|STOP | ZsGreenfl/fl Slco1c1-CreERT2tg/wt mice 2 weeks post tamoxifen treatment. Arrows indicate co-localized ZsGreen signal with lectin positive microvessels. Scale bar: 100 µm, scale bars in insets 30 µm. Source data
Extended Data Fig. 4
Extended Data Fig. 4. Reduced insulin uptake and insulin receptor signalling in tanycytes in IRΔTan-mice.
a, b. Representative images and quantification of spontaneous fluorescence of fluorescently labelled 488-insulin (250 nmol/kg) 15 min post i.p. injection in IRmKate2 and IRΔTan animals, p = 0.0187. c. Representative images of pAKT immunostaining 15 min post injection of 488-insulin (250 nmol/kg) in IRmKate2 and IRΔTan animal. d-f. Immunostaining of pAKT revealed reduced insulin signalling in basal, lateral tanycytes and in ARC, quantified as mean intensity and positive cells per ARC hemisphere, respectively p(basal) = 0.0237, p(lateral) = 0.0145, p(ARC) = 0.0002. a-f. n = 7/IRmKate2; n = 5/IRΔTan, unpaired, two-tailed Student’s t-test. Data are represented as the mean ± SEM. Scale bar: 100 µm. Source data
Extended Data Fig. 5
Extended Data Fig. 5. Indirect calorimetry of IRΔTan-mice.
a. Respiratory exchange ratio (RER) during day and night, p(Day) = 0.0448, unpaired, two-tailed Student’s t-test. b. Energy expenditure (EE) measurement during day and night. c. Mean locomotor activity during day and night. d. O2 consumption. e. CO2 production. a-e. n = 13/ IRGFP-Tan; n = 14/ IRΔTan. Data are represented as the mean ± SEM. Source data
Extended Data Fig. 6
Extended Data Fig. 6. Tanycyte insulin receptor gates insulin dependent activity of AgRP neurons.
a, c. Fos mRNA expression in Agrp (a) and POMC (c) mRNA expressing cells of the ARC (Fos+ positive cells per ARC hemisphere) in 16h fasted animals, which were further fasted for 1 h (Fasted) or refed for 1 h (Refed) of IRGFP-Tan and IRΔTan mice. Scale bar: 100 µm, Scale bar in insets: 30 µm. b, d. Quantification of Fos and Agrp (b) and POMC (d) neurons (Fos+ positive cells per ARC hemisphere) in 16 h fasted animals, which were further fasted for 1 h (Fasted) or refed for 1 h (Refed) animals revealed increased AgRP neuron activation. For Agrp p(Fasted) = 0.0009, p(Refed) = 0.0036, For POMC p(Fasted) = 0.7436, p(Refed) = 0.5483, unpaired, two-sided Student’s t-test. Data are represented as the mean ± SEM. a, c. Dashed line represent the bottom of the Arcuate nucleus (ARC). Arrows indicate co-localized signal with DAPI and the respective neuronal marker (Agrp or POMC). n = 7/Fasted IRGFP-Tan and IRΔTan; n = 6/Refed IRGFP-Tan and IRΔTan. Source data
Extended Data Fig. 7
Extended Data Fig. 7. IR∆Tan-mice exhibit an increased propensity for repetitive and compulsive behaviours.
a-e. Open field test (5 min) of IRGFP-Tan and IRΔTan mice, n = 13/ IRGFP-Tan, n = 14/ IRΔTan. a. Time spent in outer-zone during 5 min open field test. b. Distance travelled in inner, outer and in total during 5 min long open field test. p(outer zone) = 0.0069, p(total) = 0.006. c. Mean speed during open field test, p = 0.0087. d. Rearing counts during 5 min long open field test. e. Rearing time in inner, outer and in total during 5 min open field test p(outer zone) = 0.0366, p(total) = 0.0665. f-i. Layout of marble burying test (f). Burying behaviour of 18 marbles was determined over 30 min in IRGFP-Tan and IRΔTan mice, n = 16/mice group. g. Burying behaviour of 18 marbles of IRGFP-Tan and IRΔTan mice during 30 min long marble burying test, Two-way ANOVA p = 0.037, p(30 min) = 0.0519, (two way-ANOVA, Šídák post-hoc test). h. Count of total marbles buried after 30 min measurement, p = 0.0439. i. Latency to bury marbles, p = 0.0294. b, c, e, h, i. unpaired, two-tailed Student’s t-test. a – e, h – i. Data are represented as the mean ± SEM. Source data
Extended Data Fig. 8
Extended Data Fig. 8. Tanycyte insulin receptor is not required for leptin access in ARC.
a. Mean food intake during 3-day leptin (3 mg/kg) or NaCl (0.9%) administration in IRGFP-Tan and IRΔTan mice, p(IRGFP-Tan) = 0.0364, p(IRΔTan) = 0.1372, paired, two-sided Student’s t-test. b. Body weight change during 3-day leptin (3 mg/kg) or NaCl (0.9%) administration in IRGFP-Tan and IRΔTanΔTan animals. c. Representative images of pSTAT3 in ARC 20 min post i.p. injection of 3 mg/kg leptin of IRGFP-Tan and IRΔTan animals. Scale bar: 100 µm. c - d. Quantification of pSTAT3 positive cells per side of ARC, n = 5/group. a-b, d. Data are represented as the mean ± SEM. Source data
Extended Data Fig. 9
Extended Data Fig. 9. Validation of AAV-CAG-Frex-GCaMP6 expression in AgRP neurons.
Coronal sections showing anterior to posterior GCaMP6 expression in the ARC of IRfl/fl AgRP-p2a-Dretg/wt mice 3 weeks post unilateral injection. n = 2. Scale bar: 100 µm.
Extended Data Fig. 10
Extended Data Fig. 10. Validation of L10a-GFP tagged ribosome expression and Cre-recombinase mediated splicing of Exon 4 of IR in IR∆Tan-mice.
a. Expression of GFP-tagged ribosomes in control L10a-GFPtg/wt and experimental IRfl/fl L10a-GFPtg/wt-mice 3 weeks post i.c.v. injection of AAV-Dio2-Cre virus. Endogenous GFP (EGFP, green) signal was amplified via immunostaining (GFP, red). n = 3/group. Scale: 100 µm. b. ggShashimi visualization of splicing events and read coverage of insulin receptor gene Insr (Chromosome 8: 3,172,061-3,329,617) by displaying exon spanning reads in pulldowns of L10a-GFPtg/wt (control) and IRfl/fl L10a-GFPtg/wt (IRΔTan) mice. For visual clarity, we require a minimum of 10 exon spanning reads to be displayed. The plots show a splicing event in exon 4 of the IRΔTan condition as well as a lower read coverage compared to wild-type.

References

    1. Könner AC, Brüning JC. Selective insulin and leptin resistance in metabolic disorders. Cell Metab. 2012;16:144–152. - PubMed
    1. Brüning JC, et al. Role of brain insulin receptor in control of body weight and reproduction. Science. 2000;289:2122–2125. - PubMed
    1. Koch L, et al. Central insulin action regulates peripheral glucose and fat metabolism in mice. J. Clin. Invest. 2008;118:2132–2147. - PMC - PubMed
    1. Scherer T, et al. Brain insulin controls adipose tissue lipolysis and lipogenesis. Cell Metab. 2011;13:183–194. - PMC - PubMed
    1. Könner AC, et al. Insulin action in AgRP-expressing neurons is required for suppression of hepatic glucose production. Cell Metab. 2007;5:438–449. - PubMed

Publication types

MeSH terms