

Innate, translation-dependent silencing of an invasive transposon in Arabidopsis
- PMID: 34931432
- PMCID: PMC8892269
- DOI: 10.15252/embr.202153400
Innate, translation-dependent silencing of an invasive transposon in Arabidopsis
Abstract
Co-evolution between hosts' and parasites' genomes shapes diverse pathways of acquired immunity based on silencing small (s)RNAs. In plants, sRNAs cause heterochromatinization, sequence degeneration, and, ultimately, loss of autonomy of most transposable elements (TEs). Recognition of newly invasive plant TEs, by contrast, involves an innate antiviral-like silencing response. To investigate this response's activation, we studied the single-copy element EVADÉ (EVD), one of few representatives of the large Ty1/Copia family able to proliferate in Arabidopsis when epigenetically reactivated. In Ty1/Copia elements, a short subgenomic mRNA (shGAG) provides the necessary excess of structural GAG protein over the catalytic components encoded by the full-length genomic flGAG-POL. We show here that the predominant cytosolic distribution of shGAG strongly favors its translation over mostly nuclear flGAG-POL. During this process, an unusually intense ribosomal stalling event coincides with mRNA breakage yielding unconventional 5'OH RNA fragments that evade RNA quality control. The starting point of sRNA production by RNA-DEPENDENT-RNA-POLYMERASE-6 (RDR6), exclusively on shGAG, occurs precisely at this breakage point. This hitherto-unrecognized "translation-dependent silencing" (TdS) is independent of codon usage or GC content and is not observed on TE remnants populating the Arabidopsis genome, consistent with their poor association, if any, with polysomes. We propose that TdS forms a primal defense against EVD de novo invasions that underlies its associated sRNA pattern.
Keywords: RDR6; ribosome stalling; small RNAs; translation; transposons.
© 2021 The Authors. Published under the terms of the CC BY 4.0 license.
Figures
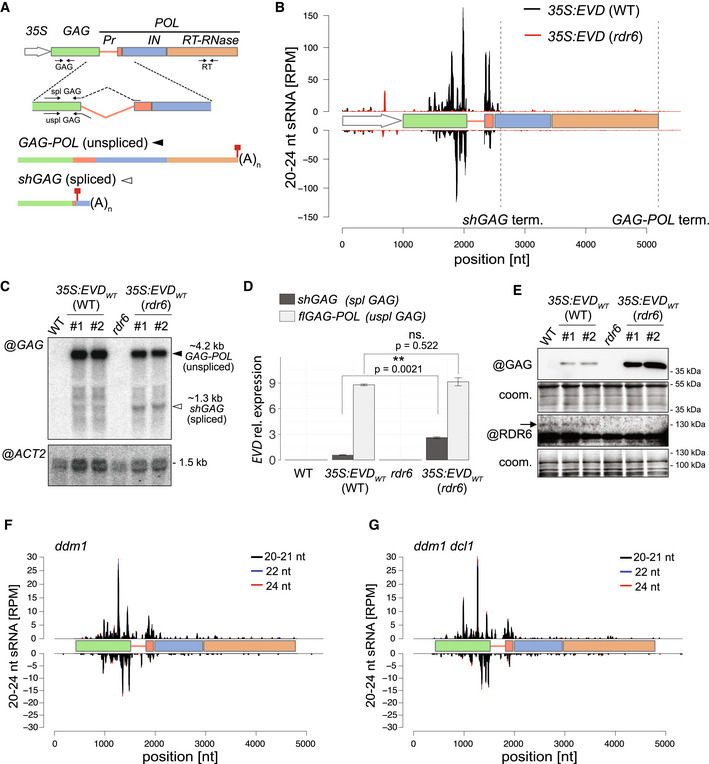
- A
EVD flGAG‐POL and spliced shGAG mRNAs are distinguishable using specific PCR primer sets (arrows) for quantification and northern analysis. (35S) Cauliflower Mosaic Virus 35S promoter, (Pr) protease, (IN) integrase, (RT‐RNase) reverse‐transcriptase RNase; red squares: stop codons.
- B
sRNA‐seq reads profile of EVD expressed from 35S:EVDWT in WT (black) or rdr6 (red). (RPM) Reads per million. Positions are indicated in nucleotides (nt) from the start of the 35S sequence. Dashed vertical lines: shGAG and GAG‐POL 3’ ends.
- C
Northern analysis of EVD RNA isoforms using a probe for the GAG region or for ACTIN2 (ACT2) as a loading control.
- D
qPCR quantification of shGAG and flGAG‐POL normalized to ACT2 and to GLYCERALDEHYDE‐3‐PHOSPHATE DEHYDROGENASE C SUBUNIT (GAPC) levels. qPCR was performed on n = 3 biological replicates; bars: standard error. **P < 0.01 (two‐sided t‐test between indicated values).
- E
Western analysis of GAG and RDR6 with Coomassie (coom.) staining as a loading control. Arrow indicates cognate RDR6 protein band.
- F, G
sRNA‐seq profiles from EVD de‐repressed in the ddm1 (F) or ddm1 dcl1 (G) backgrounds. Different siRNA size categories are stacked. Nomenclature as in (B).
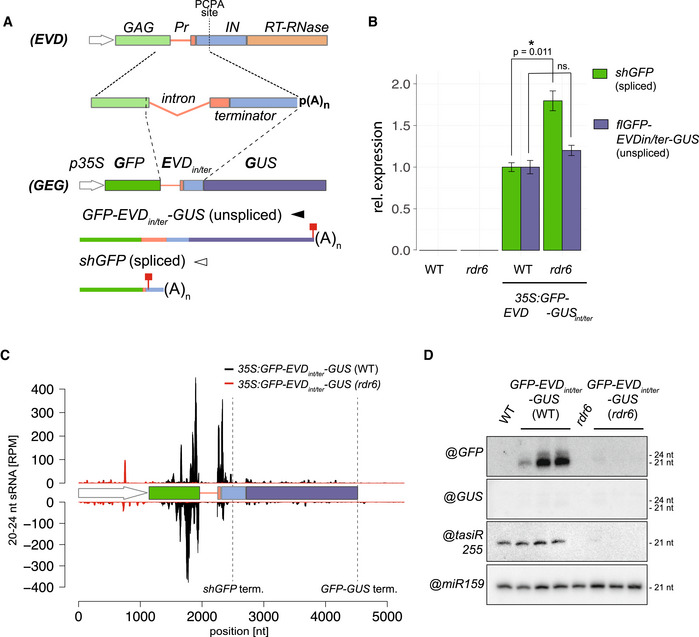
The 35S:GFP‐EVDint/ter‐GUS fusion was made by introducing the EVD intron and proximal shGAG terminator (including the premature cleavage and polyadenylation site; PCAP) between the GFP and GUS coding sequence. Like EVD, it spawns full‐length unspliced and short‐spliced mRNAs. Red squares: stop codons.
Expression levels of shGFP (spliced) and GFP‐EVDint/ter‐GUS (unspliced) transcripts, relative to ACT2 and AT4G26410 (RHIP1), in the WT or rdr6 background. qPCR was performed on three biological replicates and error bars represent the standard error on. *P < 0.05 (two‐sided t‐test against corresponding controls).
sRNA‐seq profile mapped on the genomic 35S:GFP‐EVDint/ter‐GUS locus. (RPM) Reads per million. Positions indicated in nucleotides (nt) from the start of the 35S sequence. Dashed vertical lines: shGFP and GFP‐GUS 3’ ends.
Low‐molecular‐weight RNA analysis of the GFP‐ and GUS‐spanning regions. tasiRNA255 is a control for the rdr6 mutation and miR159 provides a loading control.
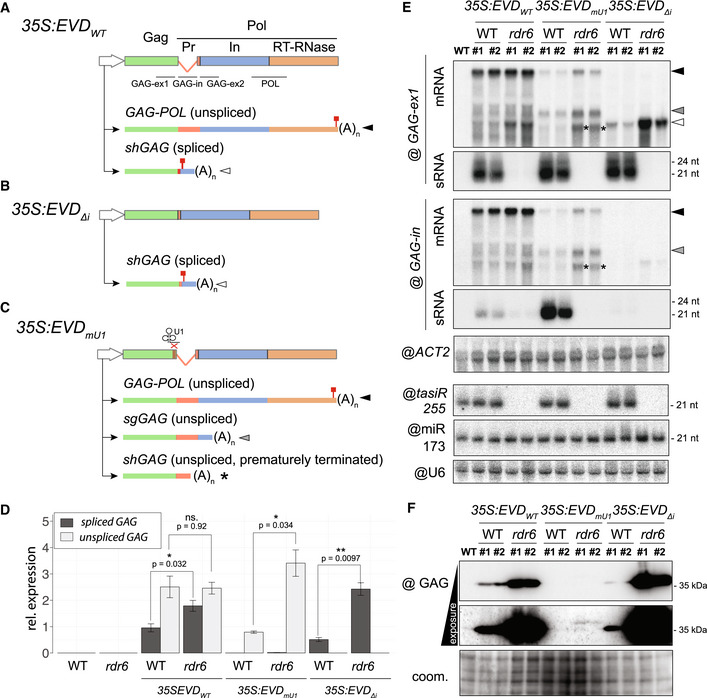
- A–C
Constructs and isoforms transcribed from 35S:EVD wt (A), 35S:EVD Δintron (B) and 35S:EVD mU1 (C). Probes for northern analysis of GAG exon 1 (GAG‐ex1), intron (GAG‐in), exon2 (GAG‐ex2), and the POL region are depicted with black lines. Red squares: stop codons.
- D
Relative expression levels of spliced and unspliced transcripts in the three EVD constructs relative to ACT2. qPCR was performed on three biological replicates and error bars represent the standard error. (ns.) = non‐significant, *P < 0.05, **P < 0.01, (two‐sided t‐test between indicated samples/targets).
- E
High‐ and low‐molecular‐weight RNA analysis of EVD GAG (GAG‐ex1) and EVD intron (GAG‐in) in two independent T1 bulks from each indicated line. The filled arrows on the right‐hand side or with an asterisk on the blots correspond to the transcripts depicted in (A‐C). ACT2: loading control for mRNAs; tasiR255, miR173, and U6: loading controls for sRNAs. Hybridizations for GAG‐ex2 and POL probes are found in Appendix Fig S5A.
- F
Western blot analysis of the GAG protein with Coomassie (coom.) staining as a loading control.
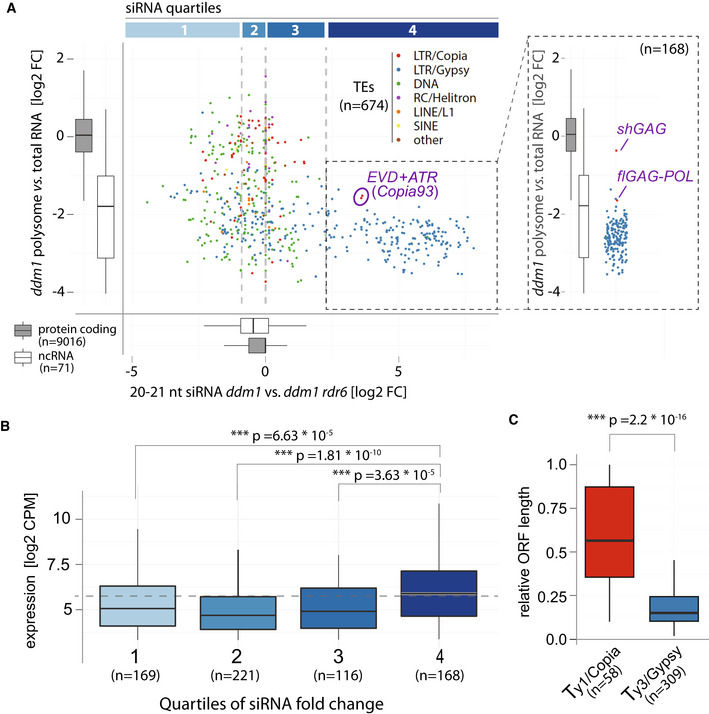
Scatter plot comparing polysome association score (defined as fold‐change between abundance in polysome libraries vs. total RNA) and RDR6‐dependent siRNA levels of TEs found de‐repressed in ddm1 (brief description of RDR6 dependency). Quartiles of siRNA levels are confined by gray vertical lines. For comparison and reference, polysome association and RDR6‐dependent siRNA levels of protein coding and non‐coding transcripts are displayed as boxplots. Copia93 elements: EVD (AT5G17125) + ATR (AT1G34967), are circled. Inlet: Polysome association score of TEs in quartile 4, EVD mRNA isoforms are displayed separately.
Boxplots of RNA expression levels of TEs in ddm1 from the quartiles in (A).
ORF length of Ty1/Copia and Ty3/Gypsy elements expressed in ddm1 relative to their genomic length.
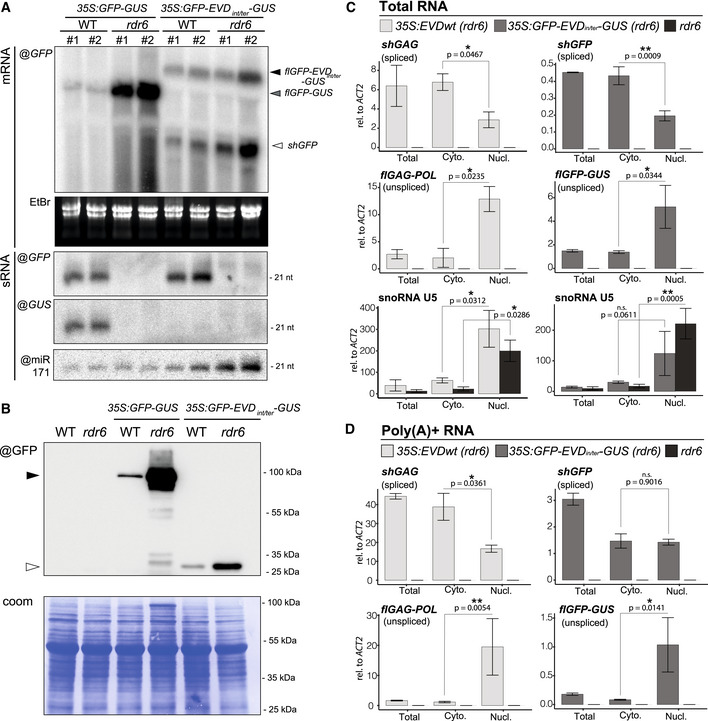
Comparison of RNA isoforms and sRNA patterns generated by 35S:GFP‐GUS and 35S:GFP‐EVDint/ter‐GUS. High‐ and low‐molecular‐weight RNA analysis using a GFP or GUS probe in two independent transgenic lines from each construct in the WT or rdr6 background. mRNA isoforms are indicated with arrows and correspond to the transcripts depicted in Fig 2A. EtBr staining of the agarose gel and miR171 probe serve as loading control for mRNAs and sRNAs, respectively.
Western blot analysis of the translation products from GFP and GFP‐GUS transcripts. Coomassie (coom.) staining as a loading control. Black arrow: GFP‐GUS fusion protein; white arrow: GFP protein.
Nucleo‐cytosolic distribution of 35S:EVD and 35S:GFP‐EVDint/ter‐GUS RNA isoforms in rdr6 relative to that of ACT2 analyzed by qPCR. RNA extracted from total, nuclear (Nucl) and cytoplasmic (Cyto) fractions was reverse‐transcribed with random hexamers and oligo(dT). snoRNA U5 is shown as a nuclear‐only RNA control.
Same as in (C) but using exclusively oligo(dT) to reverse transcribe poly(A)+ RNAs.
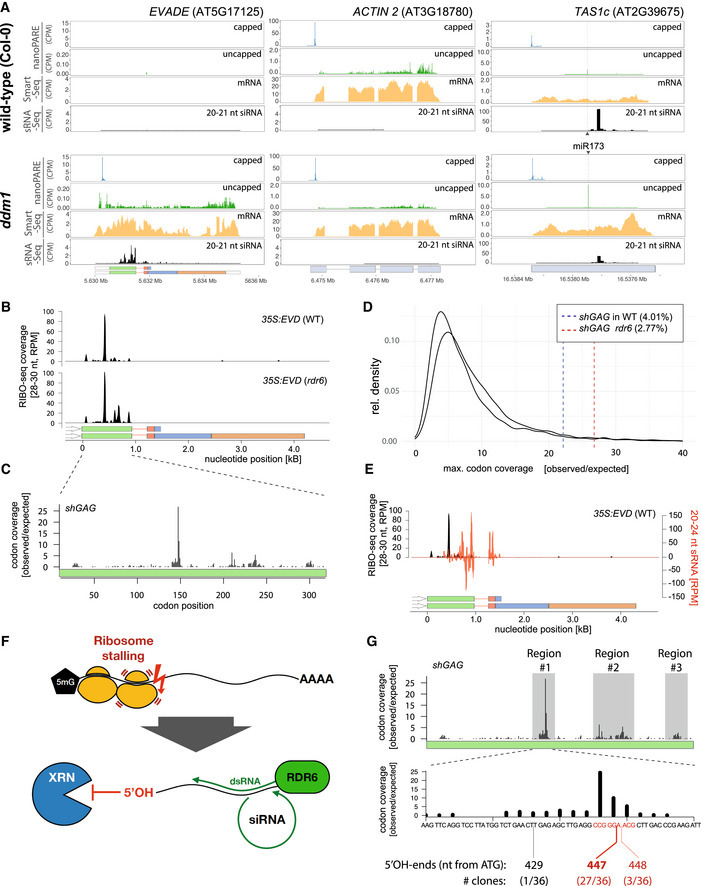
EVD, ACT2, and TAS1c capped and uncapped 5’ ends from nanoPARE and Smart‐seq2 libraries along 20–21 nt siRNA in WT and ddm1.
RIBO‐seq coverage profiles from 35S:EVD in WT or rdr6. RPM: Reads per million.
Ribosomal footprints on shGAG in rdr6 displaying codon occupancy at P‐sites to calculate codon coverage. The coverage observed at each codon position was divided by the expected mean coverage along the entire GAG coding sequence.
Maximal individual codon coverage over the expected coverage for all translated transcripts of Arabidopsis. Vertical lines indicate the strength of stalling sites of shGAG in the WT or rdr6 background. Percentages specify the proportion of transcripts with more pronounced stalling events than shGAG.
Overlay between 35S:EVD siRNAs (red) and RIBO‐seq profiles (black) in the WT background.
Schematic representation of putative ribosome stalling‐linked mRNA breakage generating 5’OH ends. Lack of 5’PO4 prevents XRN 5’‐>3’ exonucleolytic activity (see Fig 6A), granting the RNA to be used as template by RDR6.
Overlap between ribosomal footprints and mapping of 5’OH ends from 35S:EVD in rdr6 cloned through RtbC ligation. Regions investigated are highlighted in gray. 5’OH ends were only successfully cloned from region #1. Alignment of sequenced clones to EVD is displayed in Appendix Fig S9.
References
-
- Baeg K, Iwakawa H, Tomari Y (2017) The poly(A) tail blocks RDR6 from converting self mRNAs into substrates for gene silencing. Nat Plants 3: 17036–17044 - PubMed
Publication types
MeSH terms
Substances
Associated data
- Actions
- Actions
- Actions
- Actions
LinkOut - more resources
Full Text Sources
Molecular Biology Databases
Miscellaneous
