. 2022 Mar 21;43(12):1251-1264.
doi: 10.1093/eurheartj/ehab772.

Role of plakophilin-2 expression on exercise-related progression of arrhythmogenic right ventricular cardiomyopathy: a translational study

Affiliations

Role of plakophilin-2 expression on exercise-related progression of arrhythmogenic right ventricular cardiomyopathy: a translational study

Marina Cerrone et al. Eur Heart J. .

Erratum in

Abstract

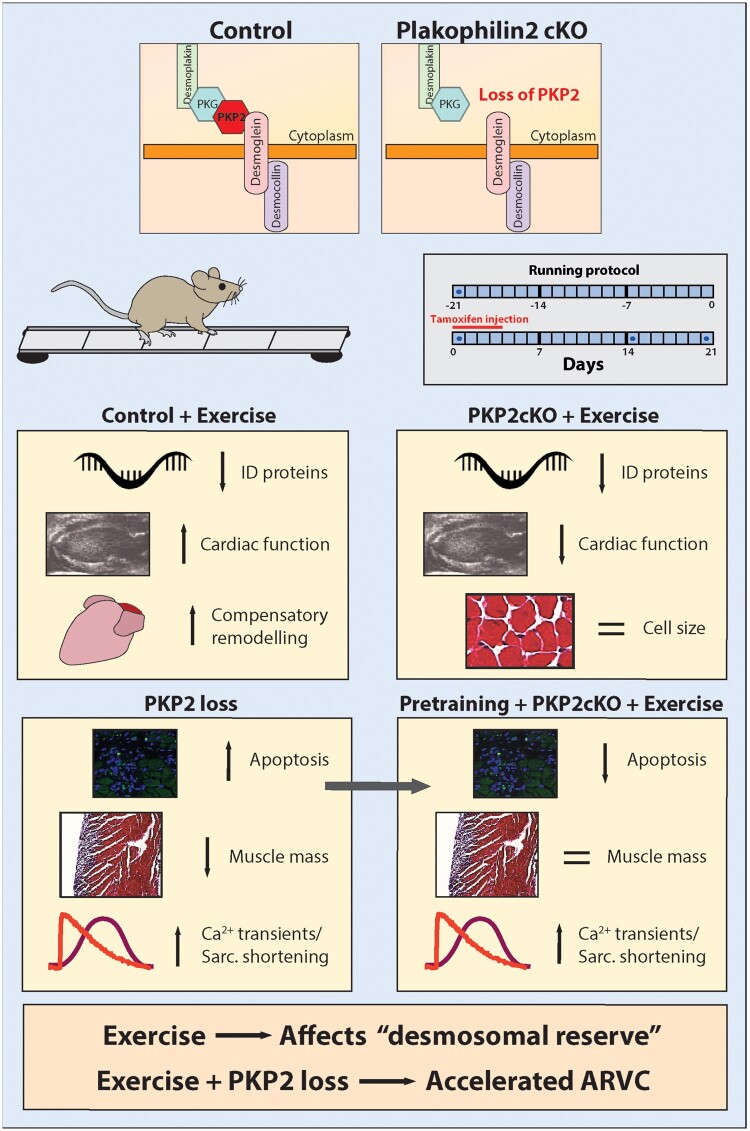
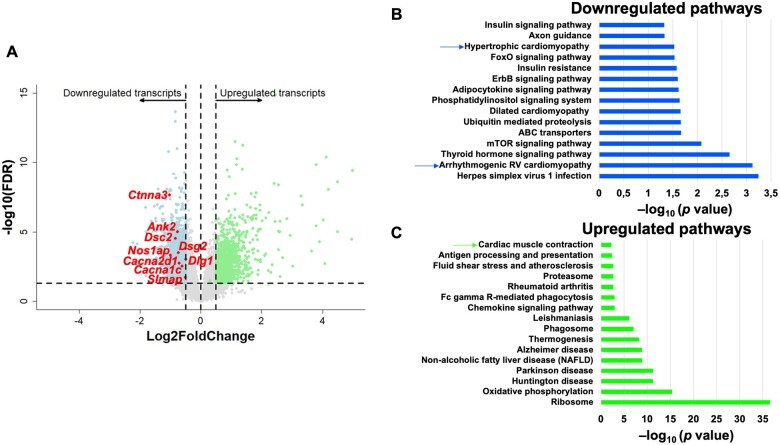
Aims: Exercise increases arrhythmia risk and cardiomyopathy progression in arrhythmogenic right ventricular cardiomyopathy (ARVC) patients, but the mechanisms remain unknown. We investigated transcriptomic changes caused by endurance training in mice deficient in plakophilin-2 (PKP2cKO), a desmosomal protein important for intercalated disc formation, commonly mutated in ARVC and controls.

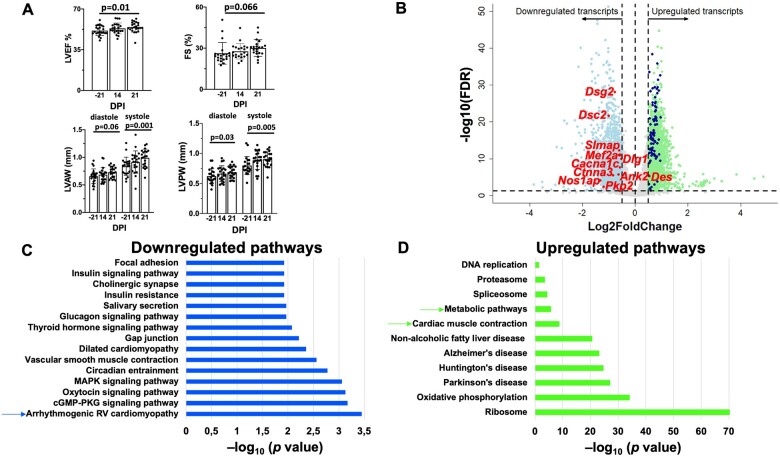
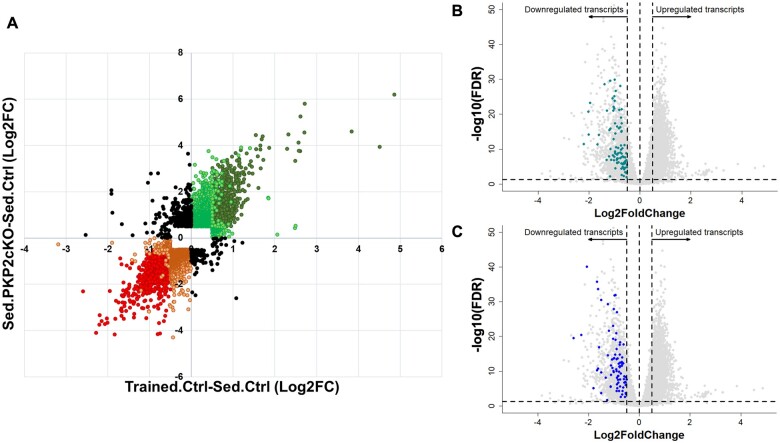
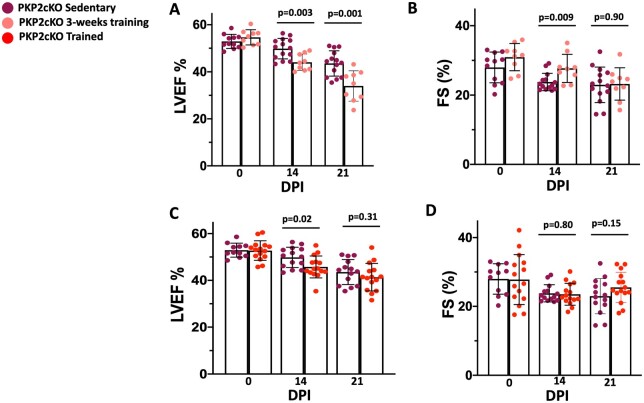
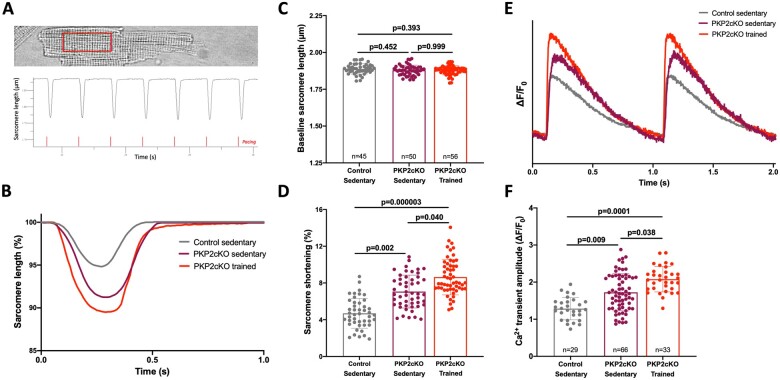
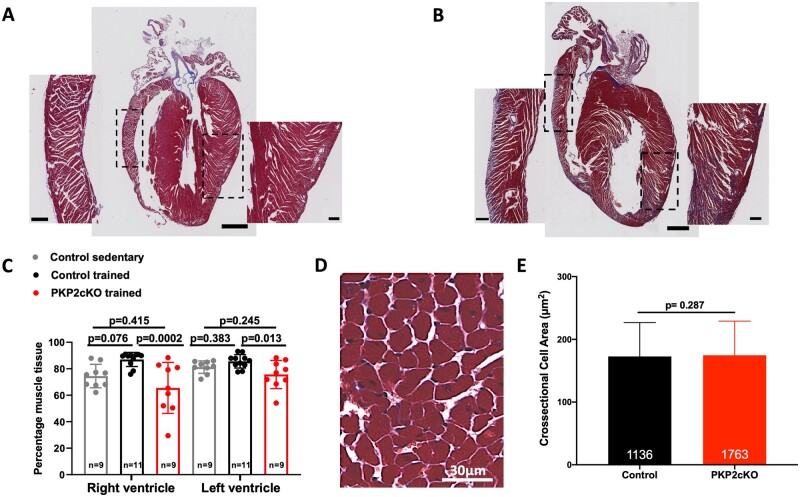
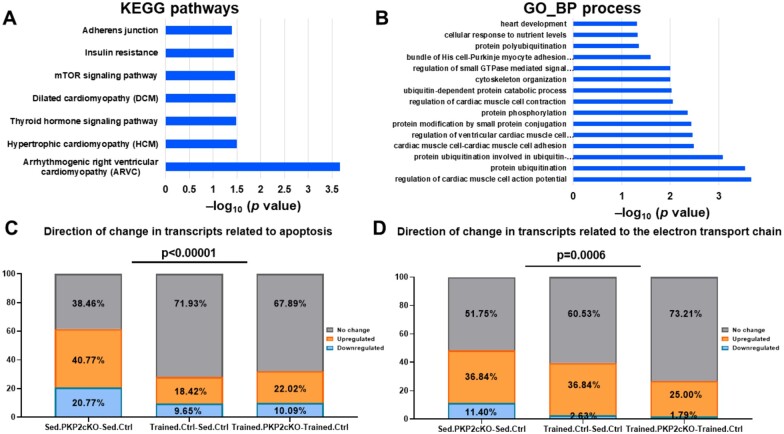
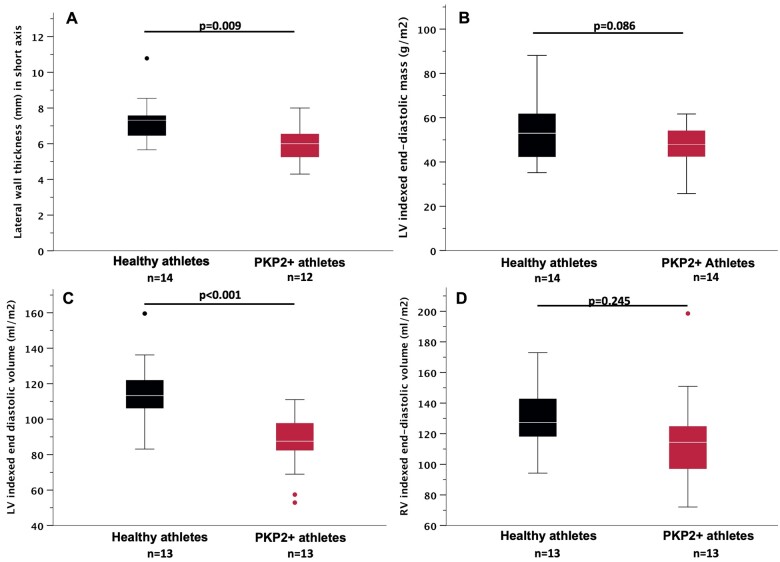
Methods and results: Exercise alone caused transcriptional downregulation of genes coding intercalated disk proteins. The changes converged with those in sedentary and in exercised PKP2cKO mice. PKP2 loss caused cardiac contractile deficit, decreased muscle mass and increased functional/transcriptomic signatures of apoptosis, despite increased fractional shortening and calcium transient amplitude in single myocytes. Exercise accelerated cardiac dysfunction, an effect dampened by pre-training animals prior to PKP2-KO. Consistent with PKP2-dependent muscle mass deficit, cardiac dimensions in human athletes carrying PKP2 mutations were reduced, compared to matched controls.

Conclusions: We speculate that exercise challenges a cardiomyocyte "desmosomal reserve" which, if impaired genetically (e.g., PKP2 loss), accelerates progression of cardiomyopathy.

Keywords: ARVC; Desmosomes; Exercise; Plakophilin-2; Arrhythmogenic right ventricular cardiomyopathy.


Figures

Graphical Abstract
Graphical Abstract
Exercise challenges a cardiomyocyte “desmosomal reserve” which, if impaired genetically (e.g., Plakophilin2 loss), can cause accelerated progression of the cardiomyopathy.
Figure 1
Figure 1
Functional and transcriptomic characteristics of murine hearts after exercise. (A) Echocardiographic parameters in 21 control mice undergoing 6 weeks of endurance treadmill training. FS, left ventricular fractional shortening; LVAW, left ventricular anterior wall; LVEF, left ventricular ejection fraction; LVPW, left ventricular posterior wall. Student’s t-test to compare baseline (−21) to effect of PKP2cKO 21 dpi. (B) Transcriptome of hearts from trained mice (6-week treadmill running protocol; n = 3) compared with that of sedentary controls (n = 6). Volcano plot of up-regulated (green) or down-regulated (blue) transcripts. The terms ‘up-regulated’ or ‘down-regulated’ refer to more or less abundance, respectively, of a given transcript in the hearts of mice that followed the training protocol, vs. the sedentary controls. Inclusion criteria: | Log2FC | > 0.5 and false discovery rate < 0.05. Dots in grey: transcripts excluded by criteria. The position of transcripts for desmosomal proteins plakophilin-2 (PKP2), desmocollin-2 (DSC2), and desmoglein-2 (DSG-2) together with additional genes of interest are noted with red and with purple dots. (C and D) KEGG (Kyoto Encyclopedia Genes and Genomes)-based identification of down-regulated and up-regulated pathways, respectively, in the differential transcriptome of trained control murine hearts.
Figure 2
Figure 2
Additive effects and preserved directionality of transcriptomic changes induced by exercise and by PKP2 knockdown. (A) Cartesian map where each dot represents the log2Fc value of a given transcript in the ‘trained control’ dataset (X-axis; differential transcriptome of Trained.Ctrl-Sed.Ctrl; same dataset as in Figure 1C and D) against the log2FC recorded for the same transcript in the sedentary PKP2cKO dataset (Sed.PKP2cKO-Sed.Ctrl dataset; Y-axis; dataset previously reported in Ref.3). Notice that, as an overall trend, transcriptomic changes caused by training in controls showed the same direction as those caused by loss of PKP2 in sedentary animals. Red circles in bottom left quadrant show transcripts significantly down-regulated (false discovery rate <0.05), with absolute log2FC values ≥0.5, both in the trained control and in the sedentary PKP2cKO dataset. Similarly, dark green circles in upper right quadrant correspond to transcripts significantly up-regulated (false discovery rate <0.05) with absolute log2FC values >0.5 in both datasets. Orange and light green circles show transcripts with absolute log2FC values >0.5 in one dataset but not in the other, regardless of their significance. Orange and light green data points also represent data where Log2FC’s were >0.5 but the value did not reach statistical significance in one or both of the datasets. Black circles denote data points for which the directionality of the change in one dataset was opposite to that of the other. The latter amounted to only 7.2% of the complete dataset. Red and orange data points correspond to 44.3% and 55.7% of the total data points in the 3rd quadrant, respectively. Green and light green data points correspond to 41.3% and 58.7% of the total data points in the 1st quadrant, respectively. (B and C) Grey dots represent differential transcriptome after exercise (same as in Figure 1A). Turquoise (B) and blue dots (C) mark transcripts identified by Montnach et al.   as components of the human PKP2 gene network.
Figure 3
Figure 3
Echocardiographic changes in trained PKP2cKO mice compared with sedentary PKP2cKO mice. (A and B) Left ventricular ejection fraction (LVEF) and fractional shortening changes in 3-week trained PKP2-cKO compared with PKP2-cKO sedentary mice. (C and D) Left ventricular ejection fraction and fractional shortening changes between trained (i.e. animals completed 6 weeks of treadmill running) and sedentary PKP2-cKO mice. Purple: sedentary (n = 11 at 0 dpi, 14 at 14 and 21 dpi). Pink: 3-week training (n = 9). Red: trained mice (n = 15). DPI: days post-TAM injection. ‘0’ in C and D reflects the baseline pre-exercise in trained mice (3 weeks before TAM injection). Sedentary data in A and B also displayed in C and D to facilitate comparison. Top bars indicate P-values by unpaired Student’s t-test.
Figure 4
Figure 4
Sarcomere length and calcium transient measurements in cardiac myocytes of sedentary and trained PKP2cKO mice. (A) Top: Example of cell region of interest (red square). Bottom: Example of sarcomere length recording, collected in Ionoptix, and analysed with IonWizard. Red lines highlight electrical stimulation; cells were paced for 20–30 s before the start of the recording to achieve steady-state. (B) Exemplary sarcomere shortening traces from sedentary control (grey line), sedentary PKP2cKO (purple line), and trained PKP2cKO myocytes (red line) 21 days post-TAM injection (21 dpi). (C and D) Baseline sarcomere length (C) and sarcomere shortening (D) in sedentary control (grey bar and symbols), sedentary PKP2cKO (purple bar and symbols), and trained PKP2cKO myocytes (red bar and symbols) 21 dpi. Numbers inside bars in C indicate number of cells and apply to both C and D panels. (E) Examples of electrically evoked Ca2+ transients in PKP2cKO myocytes 21 dpi, maintained at room temperature and in standard Tyrode solution. Grey: Myocyte from sedentary control mouse. Purple: Myocyte from sedentary PKP2cKO mouse 21 dpi. Red: Myocyte from trained PKP2cKO mouse 21 dpi. (F) Average Ca2+ transient amplitude in sedentary control (grey bar and symbols), sedentary (purple bar and symbols), and trained (red bar and symbols) PKP2cKO myocytes 21 days dpi. Numbers inside bars indicate number of cells. Data from 4 to 5 mice per group, presented as mean ± SD. Statistical tests: Hierarchical test was used for all parameters (details in Methods section).
Figure 5
Figure 5
Effect of 6-week training on cardiac histology. (A and B) Examples of Masson Trichrome stained longitudinal axis sections of a control (A) and a PKP2cKO trained heart (B). Scale bars: 1000 µm. Dotted squares indicate area showed at higher magnification on the respective sides. Scale bars: 200 µm. (C) Percentage of healthy muscle tissue detected by Masson Trichrome staining of control sedentary (grey bars and symbols), control trained (black bars and symbols), and PKP2cKO trained (red bars and symbols). Number of hearts indicated inside each bar. One-way analysis of variance. (D) Representative example of left ventricular histology section of PKP2cKO trained heart used for cross-sectional area analysis. (E) Cross-sectional area of left ventricular myocytes in control (black bars) and trained PKP2cKO mice (red bars). Number of cells measured per group is noted inside each bar (from n = 10 control and n = 7 PKP2cKO mice, respectively). Mann–Whitney U test for non-parametric samples. Individual symbols are not shown given the total n values included (over 1000 per bar).
Figure 6
Figure 6
Differential transcriptome of murine trained PKP2cKO hearts. Transcriptome of trained control hearts (Trained.Ctrl-Sed.Ctrl) was compared with that of trained PKP2cKO mice (Trained.PKP2cKO-Trained.Ctrl). (A) Volcano plot of up-regulated (green) or down-regulated (blue) transcripts. Inclusion criteria: Log2FC ± 0.5 and false discovery rate < 0.05. Up-regulated or down-regulated refers to more or less abundance, respectively, of a given transcript in the PKP2cKO hearts. Dots in grey: transcripts not meeting inclusion criteria. Some of the down-regulated transcripts in the ‘hypertrophic cardiomyopathy’ pathway are noted in the plot. (B and C) KEGG (Kyoto Encyclopedia Genes and Genomes)-based identification of down-regulated and up-regulated pathways, respectively, in the differential transcriptome of trained PKP2cKO hearts.
Figure 7
Figure 7
Comparative analysis of transcriptomes in three experimental groups studied (trained control, sedentary PKP2cKO, and trained PKP2cKO). (A and B) KEGG (Kyoto Encyclopedia Genes and Genomes) and GO (Biological process-based) pathways obtained from analysis of transcripts that were down-regulated in all three groups. (C) Stack bars representing the direction of change for transcripts under the KEGG term ‘apoptotic pathways’ (136 genes) for the three groups studied (sedentary PKP2cKO, trained control, trained PKP2cKO). Numbers within each block in the bar indicate the per cent of genes that were either down-regulated (blue block), up-regulated (orange block), or showed no significant change (grey block). Exercise significantly reduced the number of apoptosis-related transcripts that were modified consequent to loss of PKP2 deletion (left bar vs. right bar; P-value < 0.00001). In fact, the per cent of transcripts modified by training in the PKP2cKO group was similar to that modified by training in controls (right bar vs. middle bar). The upper bar shows the statistical significance in a comparison between all groups (χ2 test). (D) A comparison for transcripts included under the KEGG term ‘electron transport chain’ showed a similar trend (P = 0.00059).
Figure 8
Figure 8
Cardiac magnetic resonance in arrhythmogenic right ventricular cardiomyopathy patients and healthy controls with history of comparable athletic training. (A) Short-axis recording of lateral wall thickness. (B) Left ventricular indexed end-diastolic mass. (C) Left ventricular indexed end-diastolic volume. (D) Right ventricular indexed end-diastolic volume. Black: healthy athletes. Red: PKP2-positive athletes. Student’s t-test. Boxplots: median and interquartile range. Whiskers: 1.5× interquartile range, with outliers indicated as single dots.

Comment in

References

    1. Chen SN, Gurha P, Lombardi R, Ruggiero A, Willerson JT, Marian AJ. The hippo pathway is activated and is a causal mechanism for adipogenesis in arrhythmogenic cardiomyopathy. Circ Res 2014;114:454–468. - PMC - PubMed
    1. Lombardi R, da Graca Cabreira-Hansen M, Bell A, Fromm RR, Willerson JT, Marian AJ. Nuclear plakoglobin is essential for differentiation of cardiac progenitor cells to adipocytes in arrhythmogenic right ventricular cardiomyopathy. Circ Res 2011;109:1342–1353. - PMC - PubMed
    1. Cerrone M, Montnach J, Lin X et al. Plakophilin-2 is required for transcription of genes that control calcium cycling and cardiac rhythm. Nature Comm 2017;8:106. - PMC - PubMed
    1. Kim JC, Perez-Hernandez Duran M, Alvarado FJ et al. Disruption of Ca(2+)i homeostasis and Cx43 hemichannel function in the right ventricle precedes overt arrhythmogenic cardiomyopathy in PKP2-deficient mice. Circulation 2019;140:1015–1030. - PMC - PubMed
    1. Corrado D, Link MS, Calkins H. Arrhythmogenic right ventricular cardiomyopathy. N Engl J Med 2017;376:61–72. - PubMed

Publication types

LinkOut - more resources