. 2021 Dec 24;6(66):eabf2489.
doi: 10.1126/sciimmunol.abf2489. Epub 2021 Dec 24.

Mitochondrial C5aR1 activity in macrophages controls IL-1β production underlying sterile inflammation

Affiliations

Mitochondrial C5aR1 activity in macrophages controls IL-1β production underlying sterile inflammation

Nathalie Niyonzima et al. Sci Immunol. .

Abstract

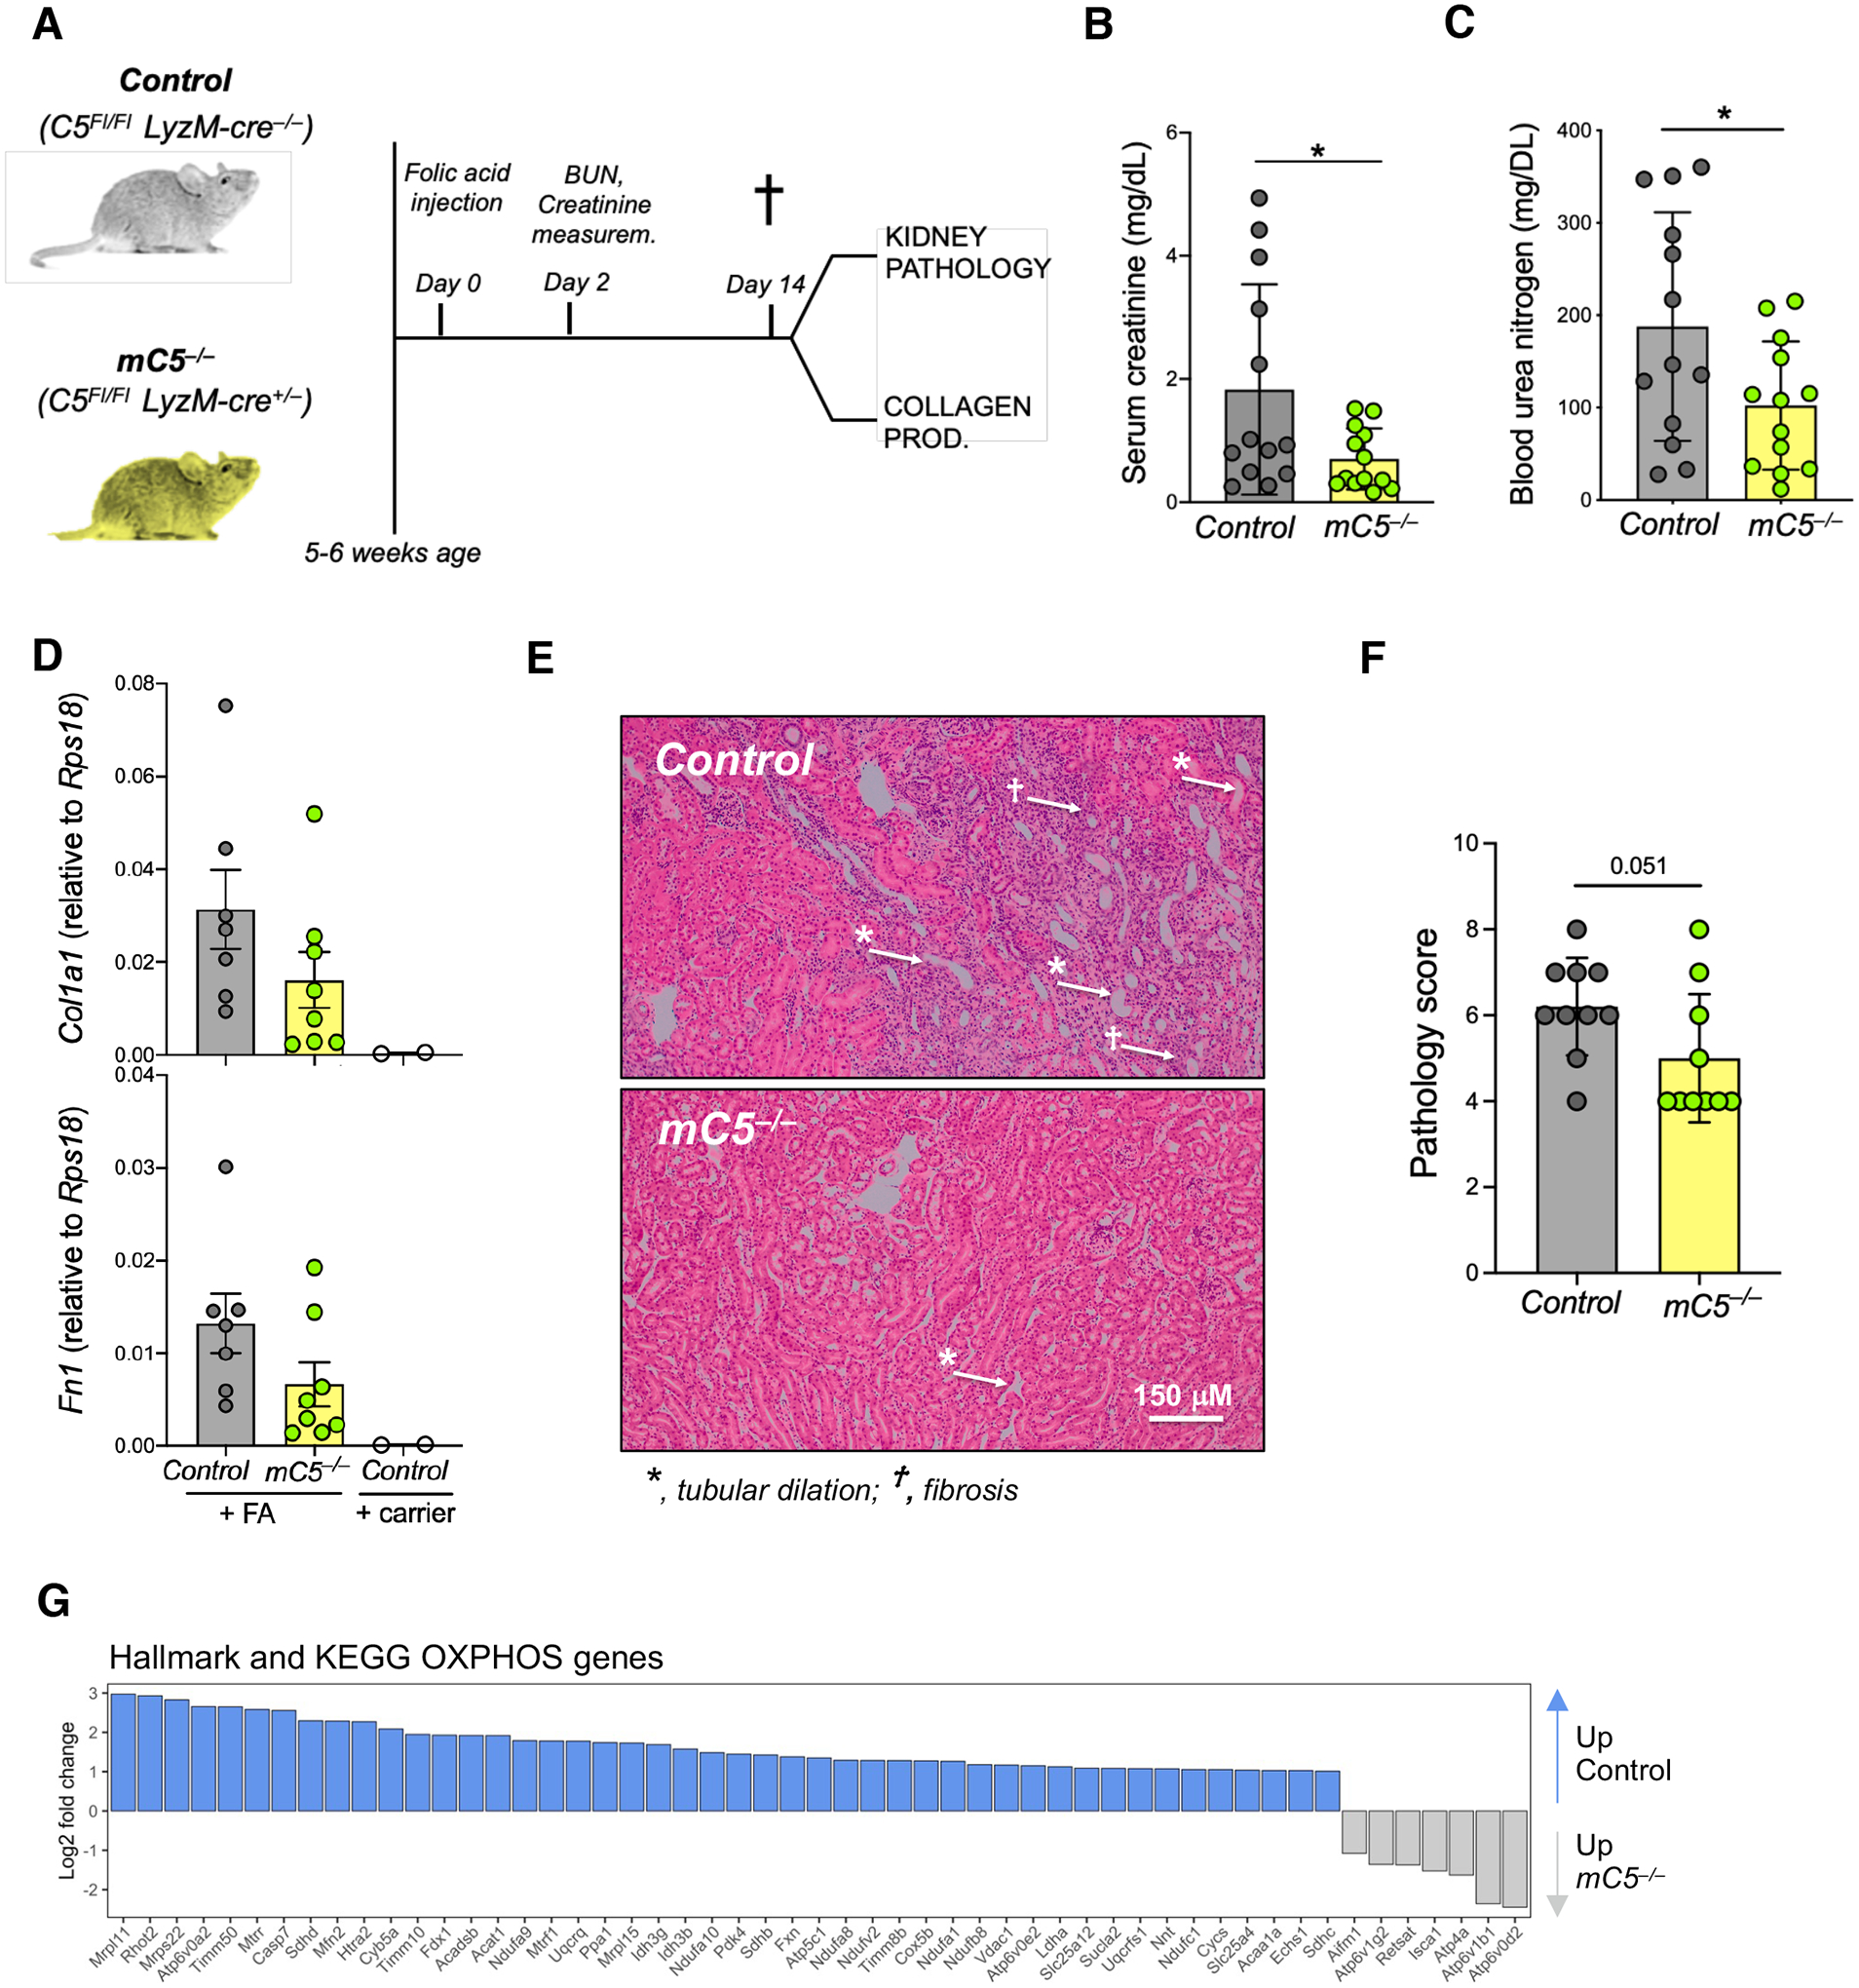
While serum-circulating complement destroys invading pathogens, intracellularly active complement, termed the “complosome,” functions as a vital orchestrator of cell-metabolic events underlying T cell effector responses. Whether intracellular complement is also nonredundant for the activity of myeloid immune cells is currently unknown. Here, we show that monocytes and macrophages constitutively express complement component (C) 5 and generate autocrine C5a via formation of an intracellular C5 convertase. Cholesterol crystal sensing by macrophages induced C5aR1 signaling on mitochondrial membranes, which shifted ATP production via reverse electron chain flux toward reactive oxygen species generation and anaerobic glycolysis to favor IL-1β production, both at the transcriptional level and processing of pro–IL-1β. Consequently, atherosclerosis-prone mice lacking macrophage-specific C5ar1 had ameliorated cardiovascular disease on a high-cholesterol diet. Conversely, inflammatory gene signatures and IL-1β produced by cells in unstable atherosclerotic plaques of patients were normalized by a specific cell-permeable C5aR1 antagonist. Deficiency of the macrophage cell-autonomous C5 system also protected mice from crystal nephropathy mediated by folic acid. These data demonstrate the unexpected intracellular formation of a C5 convertase and identify C5aR1 as a direct modulator of mitochondrial function and inflammatory output from myeloid cells. Together, these findings suggest that the complosome is a contributor to the biologic processes underlying sterile inflammation and indicate that targeting this system could be beneficial in macrophage-dependent diseases, such as atherosclerosis.


Conflict of interest statement

Competing interests: All other authors declare no competing interests.

Figures

Fig. 1.
Fig. 1.. Intracellular C5aR1 supports IL-1β production in crystal-sensing monocytes and macrophages.
(A) Assessment of resting human monocytes for intracellular C5 and C5a and C5aR1 and C5aR2 expression by flow cytometry (representative result of n=5). (B and C) C5 gene expression (B) and C5 protein presence in the Golgi apparatus (C) denote cell-intrinsic C5 generation (both representative of n=3 donors). (D to F) IL-1β production by human monocytes pretreated with extracellular C5aR2 agonist or C5aR1/C5aR2 antagonist (D), the NLRP3 inflammasome inhibitor MCC950 (E) or C5aR1 antagonist PMX53 (low cell-permeability) or C5aR1 antagonist JPE1375 (high cell-permeability) (F) prior to LPS priming (2 hrs) and CC exposure for 14 hrs (n=5–8). (G) C5a and C5aR1 colocalization in resting and LPS+CC-activated (6 hrs) monocytes assessed via confocal microscopy (detection of CC by light microscopy inserted) and Z-stack analysis (lower panels) (representative of n=5, original magnification 100 x). (H) Impact of extracellular (PMX53) or extra- and intracellular (JPE1375) C5aR1 inhibition on IL-1β secretion by LPS+CC-activated human macrophages (n=4–6). (I) Effect of C5aR1 silencing in human primed and/or crystal-activated macrophages on active caspase-8 generation (n=3). Cells were exposed to E. coli for 24 hrs as positive control. (J) Effect of C5aR1 (upper panels) or C5 (lower panels) knock-down via siRNA technique on IL-1β secretion by CC or MSU crystal-activated THP-1 cells (n=7–14). (K and L) Impact of C5aR1 (upper panel) or C5 (lower panel) knock-down on IL-1β pro- vs. mature protein levels (K) and IL1B gene transcription (L) by CC, MSU crystal or nigericin-activated THP-1 cells (n=3). Error bars in graphs represent mean ± SEM. (D–F), (J), two-way ANOVA with Bonferroni’s post-test; (H), (L), Wilcoxon matched-paired signed rank tests. *p <0.05, **p <0.01, ***p <0.005.
Fig. 2.
Fig. 2.. An intracellular C5 convertase drives C5a generation within CC-sensing monocytes.
(A) Effect of TLR4 priming on CFB (left panel) and CFD (right panel) gene expression in non-activated (NA) or CC-activated (4 hrs) human monocytes (n=4). (B) Detection of intracellular C3/C5 convertase generation (C3bBb, and/or C3bBbC3b) by confocal microscopy in non-activated or LPS+CC-timulated monocytes (representative of n=3). (C and D) Measurement of extra- vs. intracellular C3b (upper panel) and Bb (activated FB, lower panel) protein amounts in resting and activated monocytes 4 hrs post activation. Representative FACS plot (C) and combined data plotted (D) (n=4). (E and F) Assessment of activated and resting monocytes for active (Bb) and non-active FB (E) or for FD (F, data shown are representative of n=2). (G) Impact of CFB expression knock-down via siRNA (upper panel) on IL-1β production by primed and/or CC-exposed macrophages (lower panel) (n=4). (H and I) Impact of intra- or extracellular C3 convertase inhibition on monocyte cell-intrinsic C5a generation and IL-1β production. Human monocytes were left non-activated or were activated with LPS (100 ng/ml) after pre-incubation with or without a cell-permeable FB inhibitor (cpFBinh) or anti-FB antibody (Ab) or carrier or control (Ctrl.) Ab and intracellular C5a assessed by flow cytometry (H) and IL-1β (I) secretion measured at 4 hrs post activation (n=3). (J) Effects of exogenous C5 or C5a supplementation on IL-1β production by cpFBinh-treated monocytes in vitro. Monocytes were activated in the presence of cpFBinh w/wo C5 or C5a supplementation and IL-1β measured 8 hrs post activation (n=3). and Error bars in graphs represent mean ± SEM. (A), (J), one-way ANOVA; (G–I), two-way ANOVA with Bonferroni’s post-test. *p <0.05, **p <0.01.
Fig. 3.
Fig. 3.. Mitochondrial C5aR1 controls ETC flux and mitochondrial dynamics.
(A) Staining of monocytes for mitochondria and C5aR1, upper panel, and Pearson’s correlation coefficient for mitochondria-C5aR1 colocalization, lower panel (n=7, original magnification 100 x). (B) Confocal microscopy assessment of C5aR1 and TOM20 expression on mitochondria isolated from human monocytes. Data are presented as Z-stack analysis (n=4). (C and D) ROS production by isolated mitochondria after stimulation with different amounts of C5a (C, n=4) or with 10 ng/ ml C5a in the absence or presence of PMX53, JPE1375, or pertussis toxin (PTX) pre-incubation (D, n=4–6). (E) Impact of C5a on ERK1/2 and AMPK-α phosphorylation in isolated mitochondria assessed by Western blotting (control VDAC) (data representative of n=4–5 independent experiments). (F and G) Effect of C5a on purified mitochondrial ADP/ATP balance (F) and cAMP production (G) at indicated time points post C5a exposure (n=4–5). (H) Effect of intracellular C5aR1 inhibition on glycolysis (ECAR) versus ATP-coupled respiration in LPS+CC-activated human monocytes measured at 4 hrs post activation by Seahorse analysis (n=11). (I) Effect of extra- or intracellular C5aR1 inhibition on 2-DG uptake of monocytes after priming and/or CC-sensing (n=3). (J) Mitochondrial mass in resting and activated monocytes with or without PMX53 or JPE1375 pre-incubation (n=3). (L to N) Mitochondrial dynamics in CC-sensing THP-1 cells with or without JPE1375 treatment. Shown is a representative image of cells stained with TOM20 and Z-stacks analysis of each treatment condition (K) and analysis of mitochondrial footprint (L), intensity (M), and mean network size (N) (n=15–38). Error bars in graphs represent mean ± SEM. (C), unpaired t tests; (D), (H), (I), (J), (L–N), two-way ANOVA with Bonferroni’s post-test; (F), (G), one-way ANOVA. *p <0.05, **p <0.01, ***p <0.005, ****p <0.001.
Fig. 4.
Fig. 4.. High fat diet-induced atherosclerosis is driven by macrophage-expressed C5aR1.
(A) Mature IL-1β generation of BMDMs from wild type (WT) or global C5ar1−/− mice at 12 hrs post activation with LPS+CC (n=3). (B) Schematic of the high fat (cholesterol or Western) diet-induced atherosclerosis mouse model and animals (Ldlr- and myeloid C5ar1-deficient mice, LdlrmC5ar1−/−; Ldlr−/− C5ar1Fl/Fl LyzM-cre+/−) and control mice (Ldlr−/− C5ar1Fl/Fl LyzM-cre−/−) utilized. (C) Representative image of the entire aorta isolated from a male control or male Ldlr–mC5ar1−/− mouse with plaques visualized by Sudan IV staining (original magnification 0.5 x). (D and E) Quantification of aortic lesions of all mice (D, n=13) and of mice separated by sex (E, male=5; female=8). (F) Circulating LDL, VLDL, and HDL in control and LdlrmC5aR1−/− mice (mix of male and female animals, pooled plasma, n=7/group) before transfer to a HFD. (G) Total cholesterol levels in male control and LdlrmC5ar1−/− mice at 12 weeks on either a standard diet (SD) or high fat die (HFD) (n=5). (H) Heart aortic root plaque size in male control and LdlrmC5ar1−/− mice (left panel, representative image (n=5); original magnification, 50 x) and quantification of lesion area (right panel). (I) Necrotic area formation through the heart aortic root at indicated depths. (D), (E), unpaired t tests; (G–I), two-way ANOVA. Error bars in graphs represent mean ± SEM. *p <0.05, **p <0.01.
Figure 5.
Figure 5.. Cell-autonomous C5 drives metabolic adaption and IL-1β secretion upon crystal-sensing.
(A and B) IL-1β secretion (A) and mitochondrial ROS production (B) by BMDMs from male and female mC5ar1−/− (left panels) or mC5−/− (right panels) mice after priming with LPS (4 hrs) and subsequent exposure to CC (4 hrs) (n=6). (C) Effect of C5a supplementation into media on IL-1β production from mC5ar1−/− (left panels) or mC5−/− primed BMDMs upon crystal-sensing (n=3, activation performed as under ‘A’). (D and E) Impact of C5ar1 or C5 deficiency on glycolysis (ECAR) and OXPHOS (OCR) in BMDMs upon LPS priming and CC sensing. Representative seahorse profile (D) with summarized data (E, n=3–6). Error bars in graphs represent mean ± SEM. (A), (B), (E), two-way ANOVA with Bonferroni’s post-test; (C), unpaired t tests. *p <0.05, **p <0.01, ***p <0.001, ****p <0.0001.
Figure 6.
Figure 6.. Macrophage intracellular C5aR1 activity drives pathology in AKI.
(A) Depiction of the folic acid (FA)-induced acute kidney injury (AKI) model used. (B and C) Measurement of serum creatinine (B) and blood urea nitrogen (BUN) (C) in mice measured at day 2 post FA injection (n=12–13). (D) PCR analysis of collagen (Col1a1) and fibronectin (Fn1) mRNA in kidney tissue samples from mice scarified at day 14 post FA injection (n=7–9). (E and F) Histopathological analysis of kidney biopsies (day 14) with a representative H&E staining (E, original magnification 10 x) and summarized injury scores (n=7–10) (F). (G) Barplot showing log2 fold changes of genes involved in oxidative phosphorylation (OXPHOS) when comparing kidney-derived wild type control or C5−/− monocytes following FA-induced AKI. OXPHOS genes were taken from Hallmark and KEGG collections, and only genes with a log2 fold change > 1 are shown. Error bars in graphs represent mean ± SEM. (B), (C), (F), unpaired t tests. *p <0.05.
Fig. 7.
Fig. 7.. Intracellular C5aR1 inhibition attenuates the inflammatory milieu of carotid plaques.
(A) Ex vivo system for examining effects of extracellular (PMX53) or extra- and intracellular (JPE1375) C5aR1 inhibition on the carotid plaque inflammatory ‘state’. Human atherosclerotic carotid plaques were obtained by carotid endarterectomy (n=5), separated into macroscopically equal pieces and cultured with either PMX53, JPE1375 or a carrier solution (16 hrs). Cell supernatants were analyzed for cytokines and cells used for RNA-sequencing analysis. (B) Effect of C5aR1 inhibition on IL-1β, TNF and IL-10 production (n=5) and (C) on cell viability. (D) Macrophage and T cell composition of plaques as assessed from gene expression signatures (E) (n=4). (E) Assessment of genes in plaque-resident cells affected by JPE1375 treatment. (F) Hallmark immune pathways enriched in carrier-treated plaques (false discovery rate (FDR) < 0.05) by gene set enrichment analysis (GSEA) compared to JPE1375-treated plaques. Pathways are ranked by normalized enrichment score; highlighted are top 4 pathways in red. (G) Representative GSEA plots showing top ranked pathways from (E). (H and I) Hallmark and GO (H) and Kegg (I) pathways enriched in 453 genes downregulated in plaques after treatment with JPE1375. The select pathways are highlighted. Pathways are ranked by FDR. (J) Enrichment of marker genes from 79 known immune cell types within 453 genes downregulated in plaques after JPE1375 treatment. (K and L) C5AR1 mRNA expression in JPE1375-treated versus non-treated (NT) plaques (K) and stable versus unstable plaques (L) (n=4). (M and N) Hallmark pathways enriched in unstable plaques (FDR < 0.05) by GSEA compared to stable plaques (M) with specific assessment of the complement pathway (N). (O) Enrichment of marker genes from 79 known immune cell types within 1012 genes highly expressed in unstable plaques compared to stable plaques. (P) Kegg pathways enriched in 1012 genes highly expressed in unstable plaques compared to stable plaques. Select top metabolic pathways are highlighted. Error bars in graphs represent mean ± SEM. (B), one-way ANOVA; (K), (L), paired t tests. *p <0.05, **p <0.01
Figure 8.
Figure 8.. MtC5aR1 contributions to IL-1β production upon CC-sensing.
Monocytes and macrophages express the C5aR1 constitutively on mitochondria (mtC5aR1) and continuously generate intracellular C5a via an intracellular C5 convertase. TLR4 engagement by endogenous danger signals (for example, modified LDLs) triggers a priming Signal 1 (A) that induces (increased) transcription of the IL1B and CFB genes. Uptake of CC amplifies cell-intrinsic C5a production by augmented C5 convertase formation and triggers mtC5aR1 ligation (B). MtC5aR1 activation, in a G protein-coupled fashion (αi), reduces mitochondrial ERK1/2 phosphorylation, ATP and cAMP formation, and OXPHOS (C) and simultaneously increases ROS production and glycolysis (D) via reverse electron transport and also induces detachment of HKI from mitochondria. Together, these events further elevate IL1B gene transcription and also provide Signal 2 (B) for the assembly of the NLRP3 inflammasome and processing of immature pro-IL1β into mature IL-1β (E). (?), hypothetical provision of C5a to mtC5aR1 via CC-induced lysosomal rupture. ATP, adenosine triphosphate; cAMP, cyclic adenosine monophosphate; CC, cholesterol crystals; GLUT1, glucose transporter 1; HKI/II, hexokinase I (or II); OXPHOS, oxidative phosphorylation; ROS, reactive oxygen species.

Similar articles

Cited by

References

    1. Liszewski MK, Kolev M, Le Friec G, Leung M, Bertram PG, Fara AF, Subias M, Pickering MC, Drouet C, Meri S, Arstila TP, Pekkarinen PT, Ma M, Cope A, Reinheckel T, Rodriguez de Cordoba S, Afzali B, Atkinson JP, Kemper C, Intracellular complement activation sustains T cell homeostasis and mediates effector differentiation. Immunity 39, 1143–1157 (2013). - PMC - PubMed
    1. Arbore G, West EE, Rahman J, Le Friec G, Niyonzima N, Pirooznia M, Tunc I, Pavlidis P, Powell N, Li Y, Liu P, Servais A, Couzi L, Fremeaux-Bacchi V, Placais L, Ferraro A, Walsh PR, Kavanagh D, Afzali B, Lavender P, Lachmann HJ, Kemper C, Complement receptor CD46 co-stimulates optimal human CD8(+) T cell effector function via fatty acid metabolism. Nat.Commun 9, 4186 (2018). - PMC - PubMed
    1. Hess C, Kemper C, Complement-Mediated Regulation of Metabolism and Basic Cellular Processes. Immunity 45, 240–254 (2016). - PMC - PubMed
    1. Kolev M, Dimeloe S, Le Friec G, Navarini A, Arbore G, Povoleri GA, Fischer M, Belle R, Loeliger J, Develioglu L, Bantug GR, Watson J, Couzi L, Afzali B, Lavender P, Hess C, Kemper C, Complement Regulates Nutrient Influx and Metabolic Reprogramming during Th1 Cell Responses. Immunity 42, 1033–1047 (2015). - PMC - PubMed
    1. West EE, Kolev M, Kemper C, Complement and the Regulation of T Cell Responses. Annu. Rev. Immunol 36, 309–338 (2018). - PMC - PubMed

Publication types