. 2022 Jul;16(13):2496-2517.
doi: 10.1002/1878-0261.13166. Epub 2022 Jan 23.

FcγRIIIa receptor interacts with androgen receptor and PIP5K1α to promote growth and metastasis of prostate cancer

Affiliations

FcγRIIIa receptor interacts with androgen receptor and PIP5K1α to promote growth and metastasis of prostate cancer

Per Flodbring Larsson et al. Mol Oncol. 2022 Jul.

Abstract

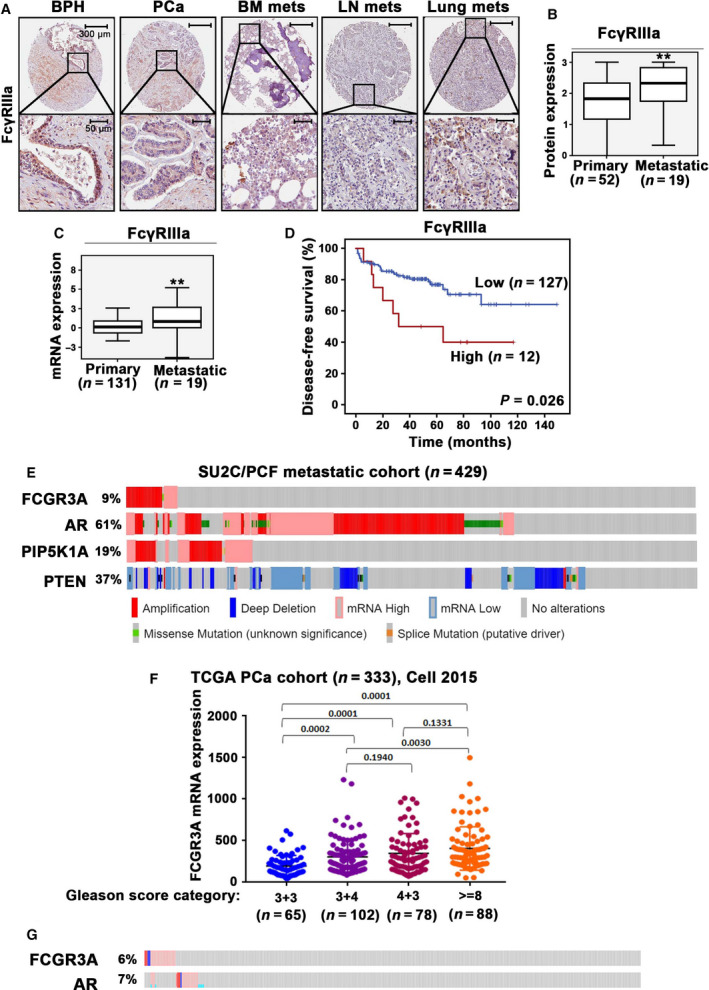
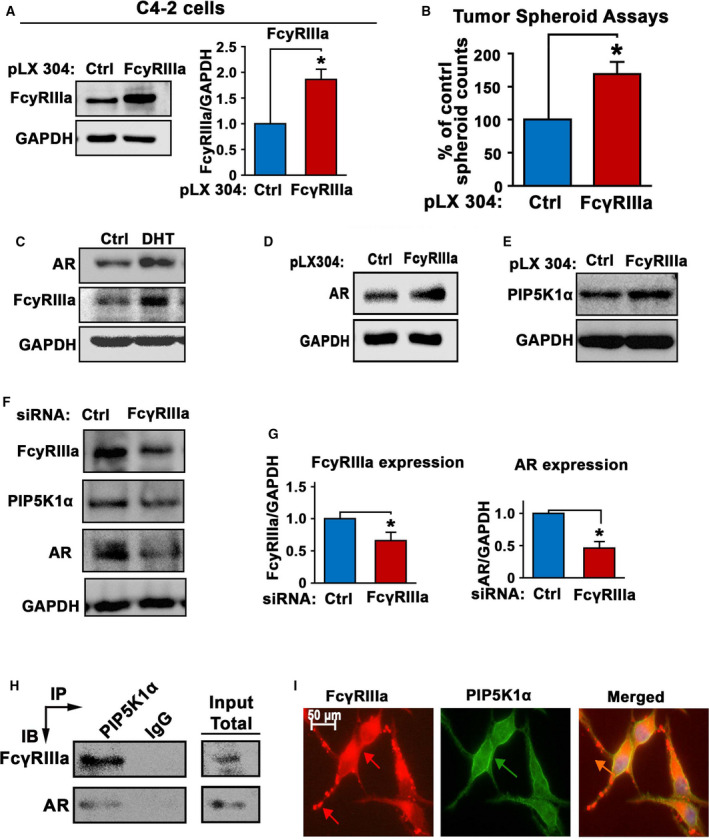
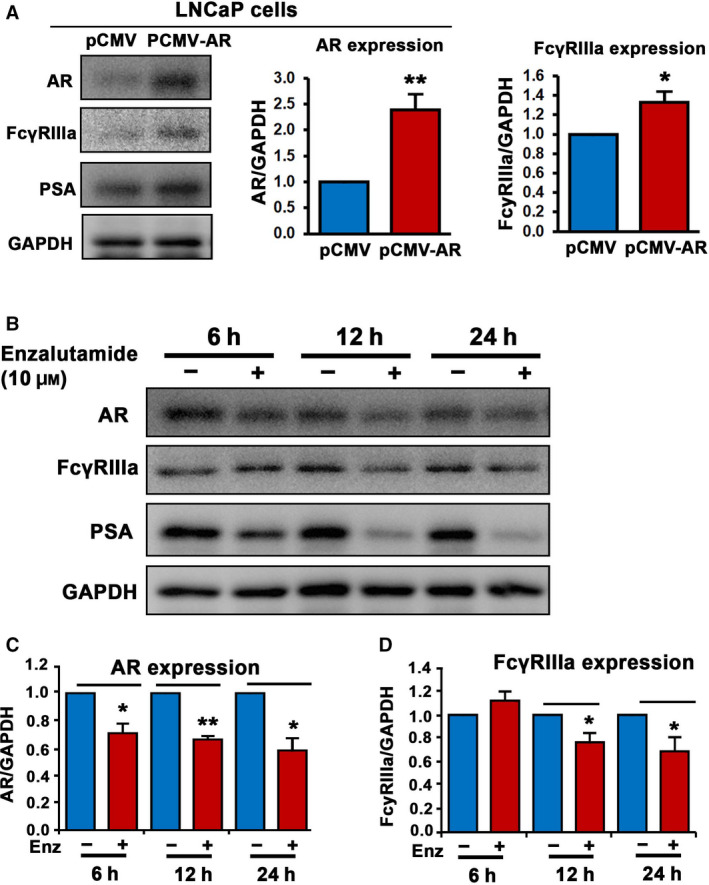
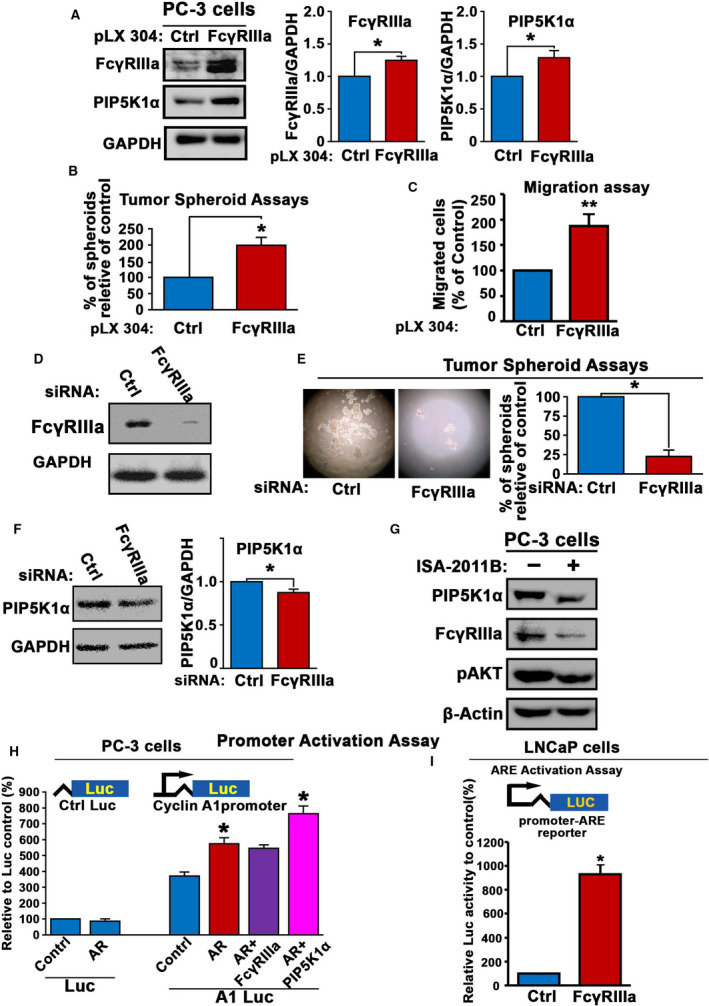
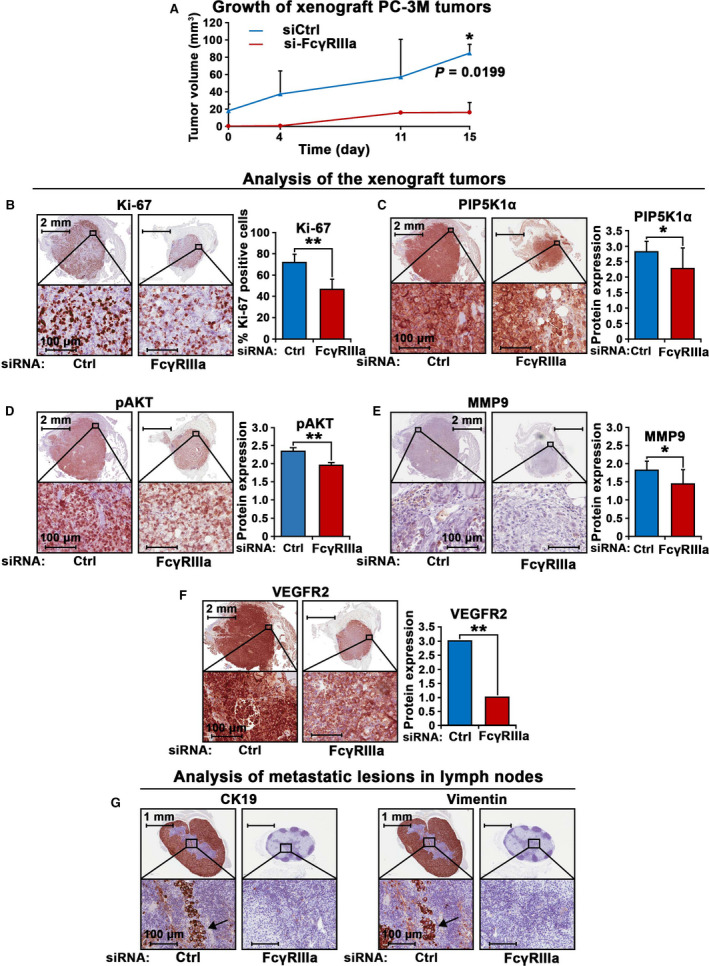
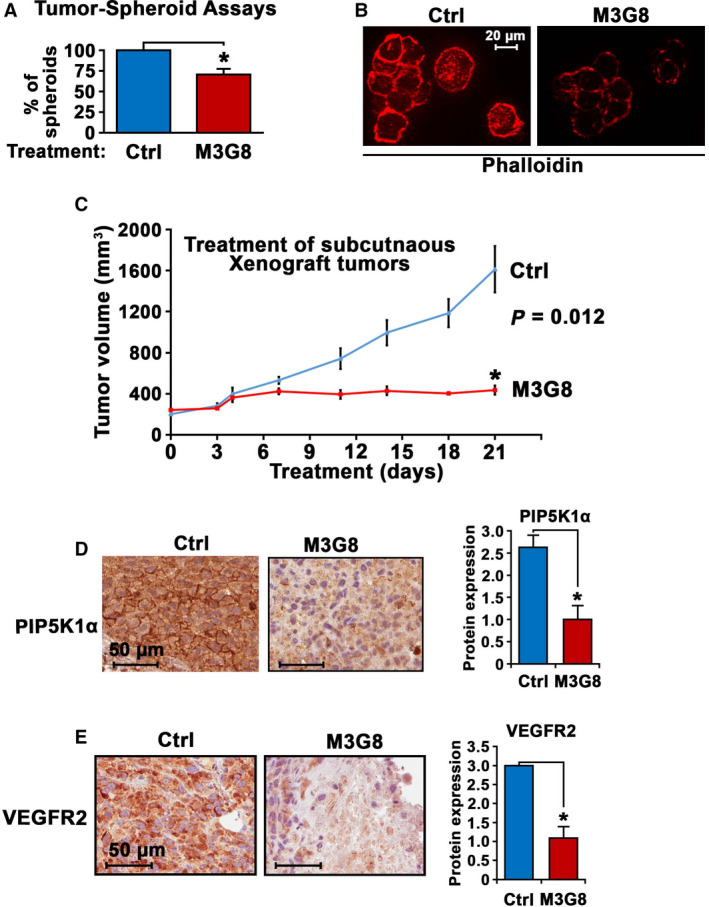
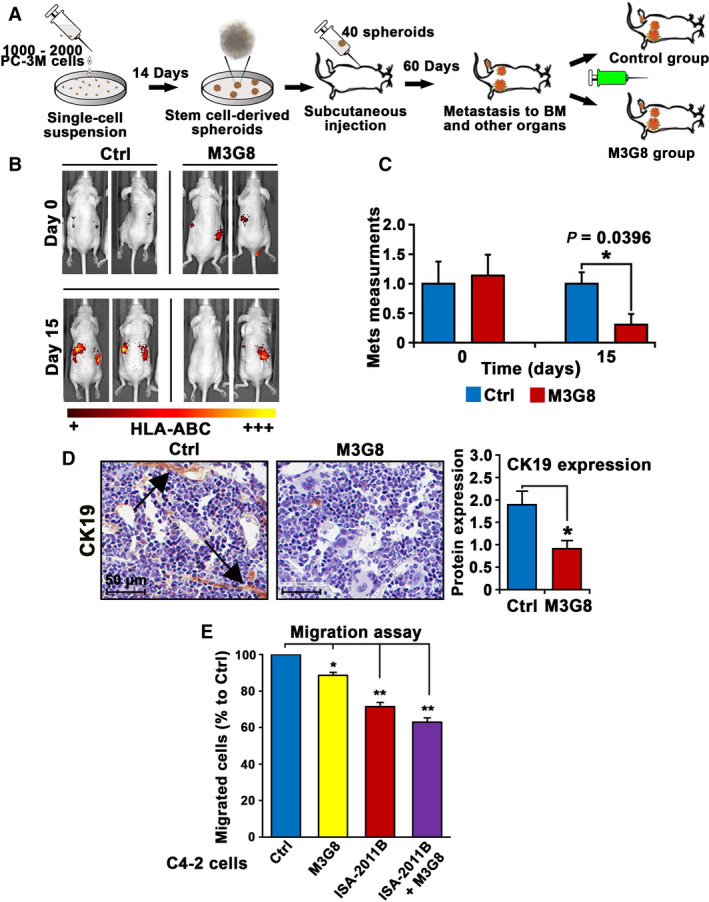
Low-affinity immunoglobulin gamma Fc region receptor III-A (FcγRIIIa) is a cell surface protein that belongs to a family of Fc receptors that facilitate the protective function of the immune system against pathogens. However, the role of FcγRIIIa in prostate cancer (PCa) progression remained unknown. In this study, we found that FcγRIIIa expression was present in PCa cells and its level was significantly higher in metastatic lesions than in primary tumors from the PCa cohort (P = 0.006). PCa patients with an elevated level of FcγRIIIa expression had poorer biochemical recurrence (BCR)-free survival compared with those with lower FcγRIIIa expression, suggesting that FcγRIIIa is of clinical importance in PCa. We demonstrated that overexpression of FcγRIIIa increased the proliferative ability of PCa cell line C4-2 cells, which was accompanied by the upregulation of androgen receptor (AR) and phosphatidylinositol-4-phosphate 5-kinase alpha (PIP5Kα), which are the key players in controlling PCa progression. Conversely, targeted inhibition of FcγRIIIa via siRNA-mediated knockdown or using its inhibitory antibody suppressed growth of xenograft PC-3 and PC-3M prostate tumors and reduced distant metastasis in xenograft mouse models. We further showed that elevated expression of AR enhanced FcγRIIIa expression, whereas inhibition of AR activity using enzalutamide led to a significant downregulation of FcγRIIIa protein expression. Similarly, inhibition of PIP5K1α decreased FcγRIIIa expression in PCa cells. FcγRIIIa physically interacted with PIP5K1α and AR via formation of protein-protein complexes, suggesting that FcγRIIIa is functionally associated with AR and PIP5K1α in PCa cells. Our study identified FcγRIIIa as an important factor in promoting PCa growth and invasion. Further, the elevated activation of FcγRIII and AR and PIP5K1α pathways may cooperatively promote PCa growth and invasion. Thus, FcγRIIIa may serve as a potential new target for improved treatment of metastatic and castration-resistant PCa.

Keywords: AR pathway and antibody-based therapy; FcγRIIIa receptor; PIP5K1α; prostate cancer metastasis; targeted therapy.


Conflict of interest statement

The authors declare no conflict of interest.

Figures

Fig. 1
Fig. 1
Evaluation of FcγRIIIa expression in primary tumors and metastatic lesions from PCa patients and the association between FcγRIIIa expression and patient outcome. (A) Representative microphotographs of benign prostate hyperplasia (BPH) (n = 48), PCa specimens (PCa) (n = 52) and metastatic lesions in bone marrow (BM mets), lymph node (LN mets), and lung (Lung mets) from PCa patients (n = 19), as assessed by immunohistochemical analysis of TMAs using antibody against FcγRIIIa. The scale bars: 300 µm and 50 µm are indicated and apply to all images in the panel. (B) Box‐plot quantitative comparison of FcγRIIIa protein expression between primary PCa, n = 52 and metastatic PCa, n = 19 (mean scores in primary and metastatic lesions were 1.73 and 2.17, difference = 0.74; 95% CI = 1.81–2.27, P = 0.006). **P < 0.01 is indicated. The error bars indicate SD. The student t‐test was used to determine the significance. (C) Box‐plot quantitative comparison of FCGR3A mRNA expression between primary (n = 131) and metastatic lesions (n = 19) (P < 0.01), **P < 0.01 is indicated. The error bars indicate SD. The student t‐test was used to determine the significance. (D). Kaplan–Meier survival analysis based on biochemical recurrence‐free (BCR‐free) survival shows the difference between patients with low and high expression of FCGR3A. Differences in BCR‐free survival between two groups and P‐values were calculated using the log‐rank test. P = 0.026 is indicated. (E). Alterations in genes and mRNA expression of FCGR3A, AR and PIP5K1A and PTEN in metastatic PCa cohort SU2C/PCF (n = 429) are shown in onco‐prints. Different types of alterations in genes and their respective mRNA expression are indicated. (F). Dot plot graph shows the FCGR3A mRNA expression in four subgroups of PCa that were categorized using Gleason scores (TCGA PCa cohort, n = 333). Subgroups with Gleason score 3 + 3 (n = 65), Gleason score 3 + 4 (n = 102), Gleason score 4 + 3 (n = 78), and Gleason score >=8 (n = 88). The expression of FCGR3A mRNA in comparison between group of Gleason score >=8 and Gleason score 3 + 4, P = 0.003; the expression of FCGR3A in comparison between group of Gleason score 4 + 3 and Gleason score 3 + 3, P < 0.001. The ANOVA test was used to determine the significance. (G). Alterations in genes and mRNA expression of FCGR3A and AR in the PCa cohort mentioned in (F) are shown in onco‐prints.
Fig. 2
Fig. 2
The role of FcγRIIIa in promoting tumorigenesis and its association with AR and PIP5K1α in C4‐2 cells. (A) Immunoblot analysis was performed to confirm the induced overexpression of FcγRIIIa in C4‐2 cells that were transfected with pLX304‐FCGR3A vector (FcγRIIIa) as compared with C4‐2 cells that were transfected with pLX304 control vector (Ctrl). The quantifications of the immunoblots are shown in the right panels. Data are presented as average of three independent experiments (n = 3), P < 0.05, as indicated by ‘*’. The error bars indicate SEM. The student t‐test was used to determine the significance. (B) The effect of FcγRIIIa overexpression on the tumorigenic ability of C4‐2 cells was assessed using tumor‐spheroid formation assays. Data are presented as average of three independent experiments (n = 3), P < 0.05, as indicated by ‘*’. The error bars indicate SEM. The student t‐test was used to determine the significance. (C) The effect of DHT treatment on FcγRIIIa and AR expression in C4‐2 cells was examined by using immunoblot analysis. C4‐2 cells treated with 0.1% DMSO as vehicle control (Ctrl) and C4‐2 cells treated with DHT at 5 nm (DHT) for 12 h are indicated. Data are representative of two independent experiments (n = 2) with each experiment performed in triplicates (n = 3). (D and E) The effect of FcγRIIIa overexpression on AR and PIP5K1α expression in C4‐2 cells was assessed using immunoblot analysis. The data are representative of three independent experiments (n = 3). (F) The effect of siRNA‐mediated knockdown of FcγRIIIa on AR and PIP5K1α expression in C4‐2 cells was assessed using immunoblot analysis. C4‐2 cells transfected with siRNA scramble control (ctrl) or siRNA to FcγRIIIa (FcγRIIIa) are indicated. Three independent experiments (n = 3) were performed. (G) The quantifications of the immunoblots of FcγRIIIa and AR are shown. Data are presented as average of three independent experiments (n = 3), P < 0.05, as indicated by ‘*’. The error bars indicate SEM. The student t‐test was used to determine the significance. (H) The formation of protein complexes among FcγRIIIa, PIP5K1α, and AR was assessed by using immunoprecipitation (IP) assay. C4‐2 cells were subjected to immunoprecipitation (IP) assay in which antibody against PIP5K1α was used to pull down the immuno‐complexes, and antibody to IgG was used as a negative control. Antibodies against FcγRIIIa and AR were used for immunoblot analysis (IB). The equal amount of total lysates was used as input control for immunoblot analysis of the immuno‐precipitated protein lysates. Data are representative of at least two independent experiments (n = 2). (I) Immunofluorescence analysis was performed to assess the subcellular localization and its colocalization with PIP5K1α. Representative images of the subcellular localizations of FcγRIIIa expression (red), PIP5K1α (green), and overlapped image (Merged) are shown. The scale bar: 20 µm is indicated. Data are representative of four independent experiments (n = 4).
Fig. 3
Fig. 3
The association between AR and FcγRIIIa in LNCaP cells. (A) The effect of elevated level of AR expression on FcγRIIIa and PSA protein expression in LNaCp cells was assessed using immunoblot analysis. The quantifications of the immunoblots for AR and FcγRIIIa are shown in the right panels. Expression of AR and FcγRIIIa was significantly higher in LNCaP cells transfected with PCMV‐AR vector than that of control pCMV vector, for AR, P = 0.003, for FcγRIIIa, P = 0.03. Data are presented as average of three independent experiments (n = 3), **P < 0.01 and *P < 0.05 are indicated. The error bars indicate SEM. The student t‐test was used to determine the significance. (B) The effect of inhibition of AR using enzalutamide on FcγRIIIa expression in LNCaP cells was assessed using immunoblot analysis. Data are representative of two independent experiments (n = 2) with each experiment performed in duplicates (n = 2). (C and D) The quantifications of the immunoblots for AR and FcγRIIIa are shown. Data are presented as average of two independent experiments (n = 2) with each experiment performed in duplicates (n = 2), P < 0.05, as indicated by ‘*’. P < 0.01 is indicated by ‘**’. Expression of AR and FcγRIIIa was significantly decreased in LNCaP cells treated with enzalutamide for 12 h and 24 h, respectively, as compared with that of vehicle control‐treated cells (for AR, enzalutamide treatment vs. control treatment for 6 h, P = 0.026; 12 h, P = 0.003; and 24 h, P = 0.021; for FcγRIIIa, enzalutamide treatment vs. control treatment for 6 h, P = 0.325; 12 h, P = 0.03; and 24 h, P = 0.034.). The error bars indicate SEM. The student t‐test was used to determine the significance.
Fig. 4
Fig. 4
The role of FcγRIIIa in promoting tumorigenesis and its association with AR and PIP5K1α in PC‐3 cells. (A) The effect of induced overexpression of FcγRIIIa on expression of PIP5K1α in PC‐3 was assessed by immunoblot analysis. The quantifications of the immunoblots are shown in the right panels. Expression of FcγRIIIa and PIP5K1α was significantly higher in PC‐3 cells transfected with FcγRIIIa than that of control vector, for PIP5K1α, P = 0.011. Data are representative of three independent experiments (n = 3), P < 0.05, as indicated by ‘*’. The error bars indicate SEM. The student t‐test was used to determine the significance. (B) The effect of FcγRIIIa overexpression on the tumorigenic ability of PC‐3 cells was assessed using tumor‐spheroid formation assays. Data shown are representative of two independent experiments (n = 2) with each experiment performed in triplicates (n = 3), P < 0.05, as indicated by ‘*’. The error bars indicate SEM. The student t‐test was used to determine the significance. (C) The effect of induced overexpression of FcγRIIIa on migratory ability of PC‐3 cells was assessed by using migration assay. Data shown are presented as average of three independent experiments (n = 3), P < 0.01, as indicated by ‘**’. The error bars indicate SEM. The student t‐test was used to determine the significance. (D) The depletion of FcγRIIIα in PC‐3 cells transfected with siFcγRIIIa RNA (FcγRIIIa) compared with PC‐3 cells transfected with siRNA scramble control (Ctrl) was assessed by using immunoblot analysis. Data are representative of two independent experiments (n = 2) with each experiment performed in duplicates (n = 2). (E) The effect of FcγRIIIa knockdown on tumorigenic ability of PC‐3 cells was determined using tumor‐spheroid formation assays. Representative images of tumor spheroids are shown. The spheroid counts are shown in the right panel. Mean tumor‐spheroid counts in si‐control and si‐FcγRIIIa PC‐3 cells were 56 and 14, difference = 42, 95% CI in si‐control = 43‐68 and si‐FcγRIIIa = 6‐21, P = 0.012. Data are representative of two independent experiments (n = 2), and each experiment was performed in triplicates (n = 3), P < 0.05, as indicated by ‘*’. The error bars indicate SEM. The student t‐test was used to determine the significance. (F) The effect of FcγRIIIa knockdown on PIP5K1α in PC‐3 cells was determined using immunoblot analysis. Data shown in the right panel are representative of three independent experiments (n = 3), P < 0.05, as indicated by ‘*’. The error bars indicate SEM. The student t‐test was used to determine the significance. (G) The effect of inhibition of PIP5K1α by its inhibitor ISA‐2011B on IP5K1α, FcγRIIIa, and pAKT in PC‐3 cells was determined using immunoblot analysis. Data are representative of at least three independent experiments (n = 3). (H) Effect of induced AR alone or together with induced FcγRIIIa or PIP5K1α expression on the activity of full‐length cyclin A1 promoter was assessed using luciferase assay. The vectors were induced together with luc‐reporter vector ‘Luc’ or cyclin A1 promoter‐luc‐reporter vector ‘A1‐Luc’ into PC‐3 cells (For AR alone, P = 0.003, for AR+PIP5K1α, P = 0.008). Data are representative of at least two independent experiments (n = 2), and each experiment was performed in triplicates (n = 3). The error bars indicate SEM. The student t‐test was used to determine the significance. (I) Effect of FcγRIIIa overexpression on androgen‐responsive (ARE) promoter activity in LNCaP cells was carried out using the dual‐luciferase assays. FcγRIIIa overexpression‐induced ARE reporter luciferase activity led to an increase by 100% relative to controls in LNCaP cells, P = 0.013. Data shown are presented as average of two independent experiments (n = 2), and each experiment was performed in triplicates, P < 0.05, as indicated by ‘*’. The error bars indicate SEM. The student t‐test was used to determine the significance.
Fig. 5
Fig. 5
The inhibitory effect of FcγRIIIa knockdown on growth of tumors in xenograft mouse model. (A) Growth curves of PC‐3 M tumors expressing si‐control RNA (siCtrl) or si‐ FcγRIIIa (FcγRIIIa) in xenograft mice are shown (n = 4 per group). Tumor volumes are indicated in Y‐axis, and the measurement days are indicated in x‐axis. Tumors from each group were collected at the end of the experiment. (B, C, D, E, F) Expression of the key proteins for proliferation and invasion in the xenograft tumors collected from the mice was assessed by using immunohistochemical analysis. Representative images of the siCtrl tumors and si‐FcγRIIIa tumors that were stained with antibodies against Ki‐67, PIP5K1α, pAKT, MMP9, and VEGFR2 are shown. Quantification of the staining intensity of the proteins is shown in the right panels. Mean Ki‐67‐positive cells in siCtrl and siFCGR3A tumors were 71.82% and 46.67%, difference = 25.15%; 95% CI = 38.40 to 54.93%, P < 0.001. Mean PIP5K1α expression in si‐control and si‐FcγRIIIa tumors was 2.82 and 2.20, difference = 0.54, 95% CI for si‐control = 2,78–2,85, si‐FcγRIIIa = 2.13‐2.43. P = 0.048; mean pAKT expression for si‐control and si‐FcγRIIIa were 2.34 and 1.96, difference = 0.39, 95% CI for si‐control = 2.3–2.38, and for si‐FcγRIIIa = 1.94–1.98, P = 0.0045. Mean MMP9 expression in si‐control and si‐FcγRIIIa was 1.82 and 1.44, difference=0.37, 95% CI in si‐control = 1.8‐1.84, and in si‐FcγRIIIa = 1.39‐1.5, P = 0.028. **P < 0.01 and *P < 0.05 are indicated. Tumors from the two groups (for si‐control group, n = 3; for si‐FcγRIIIa group, n = 2) were stained with the indicated antibodies and were evaluated. The error bars indicate SEM. The student t‐test was used to determine the significance. The scale bars: 2 mm and 100 µm in the images in B, C, D, E, and F are indicated. (G) Representative images of the lymph nodes containing metastatic lesions from the xenograft mice bearing si‐FcγRIIIa tumors as compared with that of si‐control RNA (siCtrl) are shown. Tumors were immune‐stained with the antibodies against CD19 and Vimentin that are markers for cancer cells. Tumor cells positive to the markers were indicated by the arrows. Tumors from the two groups (for si‐control group, n = 3; for si‐FcγRIIIa group, n = 2) were stained with the indicated antibodies and were evaluated. The scale bars: 1 mm and 100 µm are indicated.
Fig. 6
Fig. 6
The interlink between PIP5K1α and FcγRIIIa and inhibition of via monocloncal antibody M3G8 in PCa cells. (A) The effect of M3G8 on growth of tumor spheroids derived from PC‐3 cells cocultured with U‐937 cells. Tumor spheroids were treated with control or M3G8 antibodies. Mean tumor‐spheroid counts in control antibody‐treated and in M3G8‐treated groups = 38‐26, difference = 12, 95%CI = 22–31, P = 0.028. Data are representative of two independent experiments (n = 2), and each experiment was performed in triplicates, P < 0.05, as indicated by ‘*’. The error bars indicate SEM. The student t‐test was used to determine the significance. (B) Representative immunofluorescent images from (A) showing the tumor spheroids treated with M3G8 or control antibodies that are highlighted with phalloidin staining (red). The experiments were replicated (n = 2). The scale bar: 20 µm is indicated. (C) Growth of PC‐3 subcutaneous xenograft tumors that were treated with control IgG antibody (Ctrl) or M3G8 antibody. Treatment started on day 0 when the mean tumor volume reached to over 300 mm3 and ended on day 21 (n = 3‐4 mice per group). Y‐axis indicates tumor volumes, and x‐axis indicates days of treatment. P = 0.012. *P < 0.05 is indicated. (D and E) Immunohistochemical analysis of the xenograft tumors from mice treated with control antibody or M3G8 antibody. Representative microphotographs of images showing expression of PIP5K1α and VEGFR2 are shown in left panels and quantification of the staining intensity of the antibodies against these proteins in tumor cells are in shown in the right panels. Mean PIP5K1α expression in control‐treated and M3G8‐treated was 2.63 and 1.0, difference = 1.63, 95%Cl for control‐treated = 2.49‐2.76 and for M3G8‐treated = 0.72‐1.28, P = 0.01. Mean VEGFR2 expression in control‐treated and M3G8‐treated= 3.0 and 1.08, difference = 1.92, 95% Cl for M3G8‐treated = 0.77–1.4, P = 0.01). Tumors from the two groups (n = 3) were stained with the indicated antibodies and were evaluated. *P < 0.05 is indicated. The error bars indicate SEM. The student t‐test was used to determine the significance. The scale bars: 50 µm is indicated.
Fig. 7
Fig. 7
The effect of M3G8 on tumor growth and metastasis in xenograft mouse models. (A) Schematic illustration depicts the experimental procedures of establishment of distant metastasis including bone metastasis by using tumor spheroids derived from ALDHhigh PC‐3 M cells, and in vivo treatment regimens using M3G8 antibody. (B) Representative images to show the bioluminescent in vivo imaging on visualization of tumor metastasis in mice bearing metastasis and were treated with M3G8 or control antibodies. The signals were obtained by using fluorochrome‐conjugated HLA‐ABC antibody which was injected into the mice 6 h before applying mice on the IVIS imaging device. (C) Mean metastatic areas and intensity in pixels for Ctrl group (n = 4) and M3G8 group (n = 3) are shown. On day 0, P = 0.8257. On day 15 post‐treatment, mean value of metastatic areas plus signal intensity for control‐treated and M3G8‐treated groups was 250 and 76, difference = 174, 95% CI for control group = 185‐310, and for M3G8 group = 0–157, P = 0.039. The error bars indicate SEM. The student t‐test was used to determine the significance. (D) Representative microphotographs showing CK19‐positive cells in the bone marrow, indicating bone metastasis. Quantification of the staining intensity of CK19 in the bone marrow of the mice (n = 2–3) that were treated with Ctrl or M3G8 is shown in the right panel. The arrow heads point to the CK19‐positive tumor cells or tumor cell clusters. *P < 0.05 is indicated. The student t‐test was used to determine the significance. The scale bar: 50 µm is indicated. (E) The effect of M3G8 and ISA‐2011B alone or in combination on the migratory ability of C4‐2 cells was assessed by using the migration assays. After treatment with the agents, the equal amount of the cells from different groups was subjected to the Boyden chamber migration assay for 18 h. M3G8 treatment or ISA‐2011B treatment alone reduced migratory ability of C4‐2 cells as compared with that of controls (for M3G8, P = 0.016; for ISA‐2011B, P = 0.006). Combination of M3G8 and ISA‐2011B reduced the migratory ability of the cells as compared with that of controls (P = 0.003). Data are presented as average of two independent experiments (n = 2). **P < 0.01 and *P < 0.05 are indicated. The error bars indicate SEM. The student t‐test was used to determine the significance.

Similar articles

Cited by

References

    1. Nimmerjahn F, Ravetch JV. Fcγ receptors as regulators of immune responses. Nat Rev Immunol. 2008;8:34–47. - PubMed
    1. Bournazos S, Gupta A, Ravetch JV. The role of IgG Fc receptors in antibody‐dependent enhancement. Nat Rev Immunol. 2020;20:633–43. - PMC - PubMed
    1. Baniyash M. TCR zeta‐chain downregulation: curtailing an excessive inflammatory immune response. Nat Rev Immunol. 2004;4:675–87. - PubMed
    1. Baudino L, Nimmerjahn F, Azeredo da Silveira S, Martinez‐Soria E, Saito T, Carroll M, et al. Differential contribution of three activating IgG Fc receptors (FcgammaRI, FcgammaRIII, and FcgammaRIV) to IgG2a‐ and IgG2b‐induced autoimmune hemolytic anemia in mice. J Immunol. 2008;180:1948–53. - PubMed
    1. Abrahams VM, Cambridge G, Lydyard PM, Edwards JC. Induction of tumor necrosis factor alpha production by adhered human monocytes: a key role for Fcgamma receptor type IIIa in rheumatoid arthritis. Arthritis Rheum. 2000;43:608–16. - PubMed

Publication types

Substances