. 2022 Mar 2;110(5):795-808.e6.
doi: 10.1016/j.neuron.2021.11.031. Epub 2021 Dec 20.

Oxytocin normalizes altered circuit connectivity for social rescue of the Cntnap2 knockout mouse

Affiliations

Oxytocin normalizes altered circuit connectivity for social rescue of the Cntnap2 knockout mouse

Katrina Y Choe et al. Neuron. .

Abstract

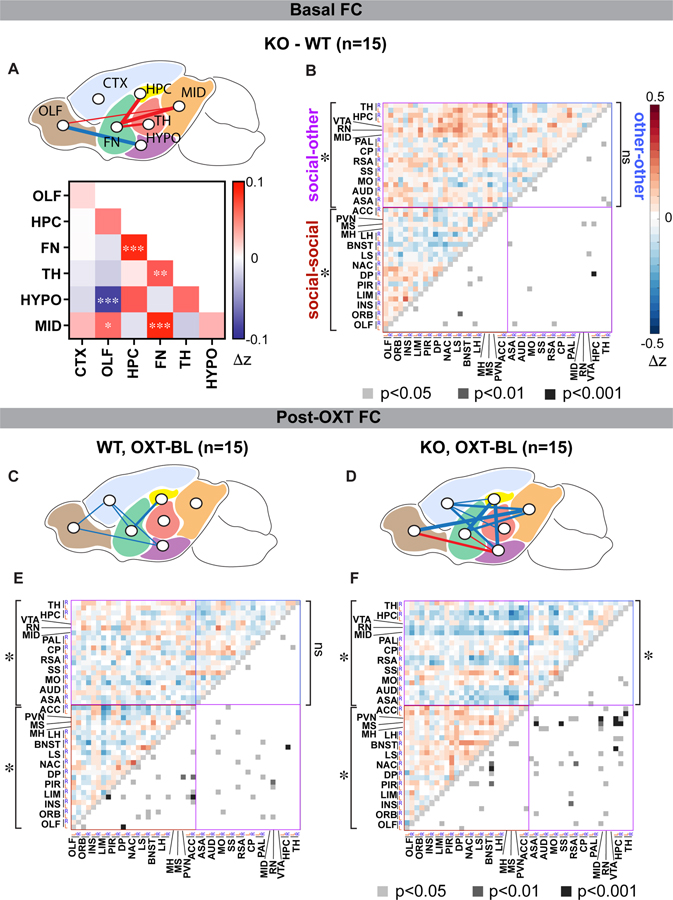
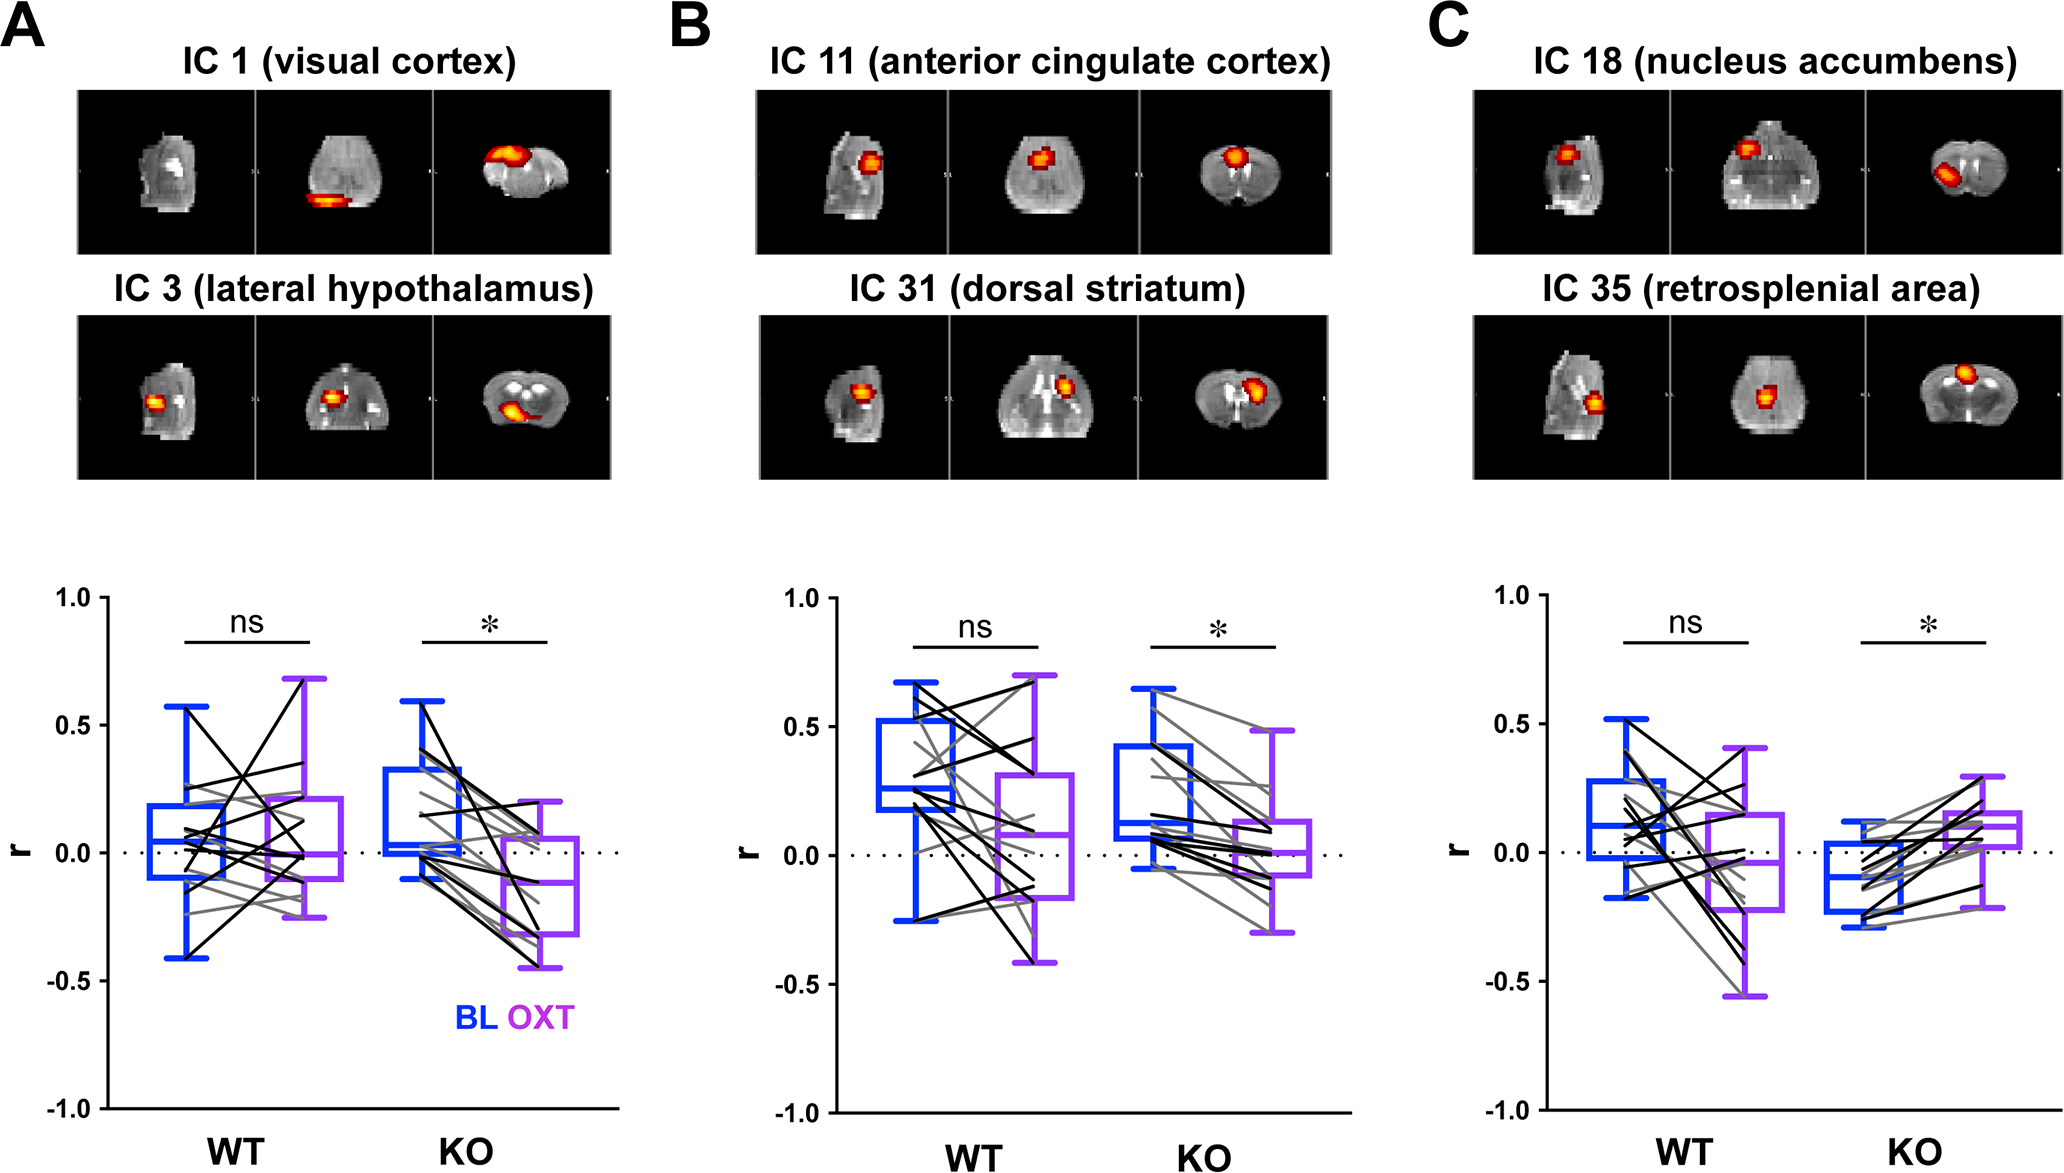
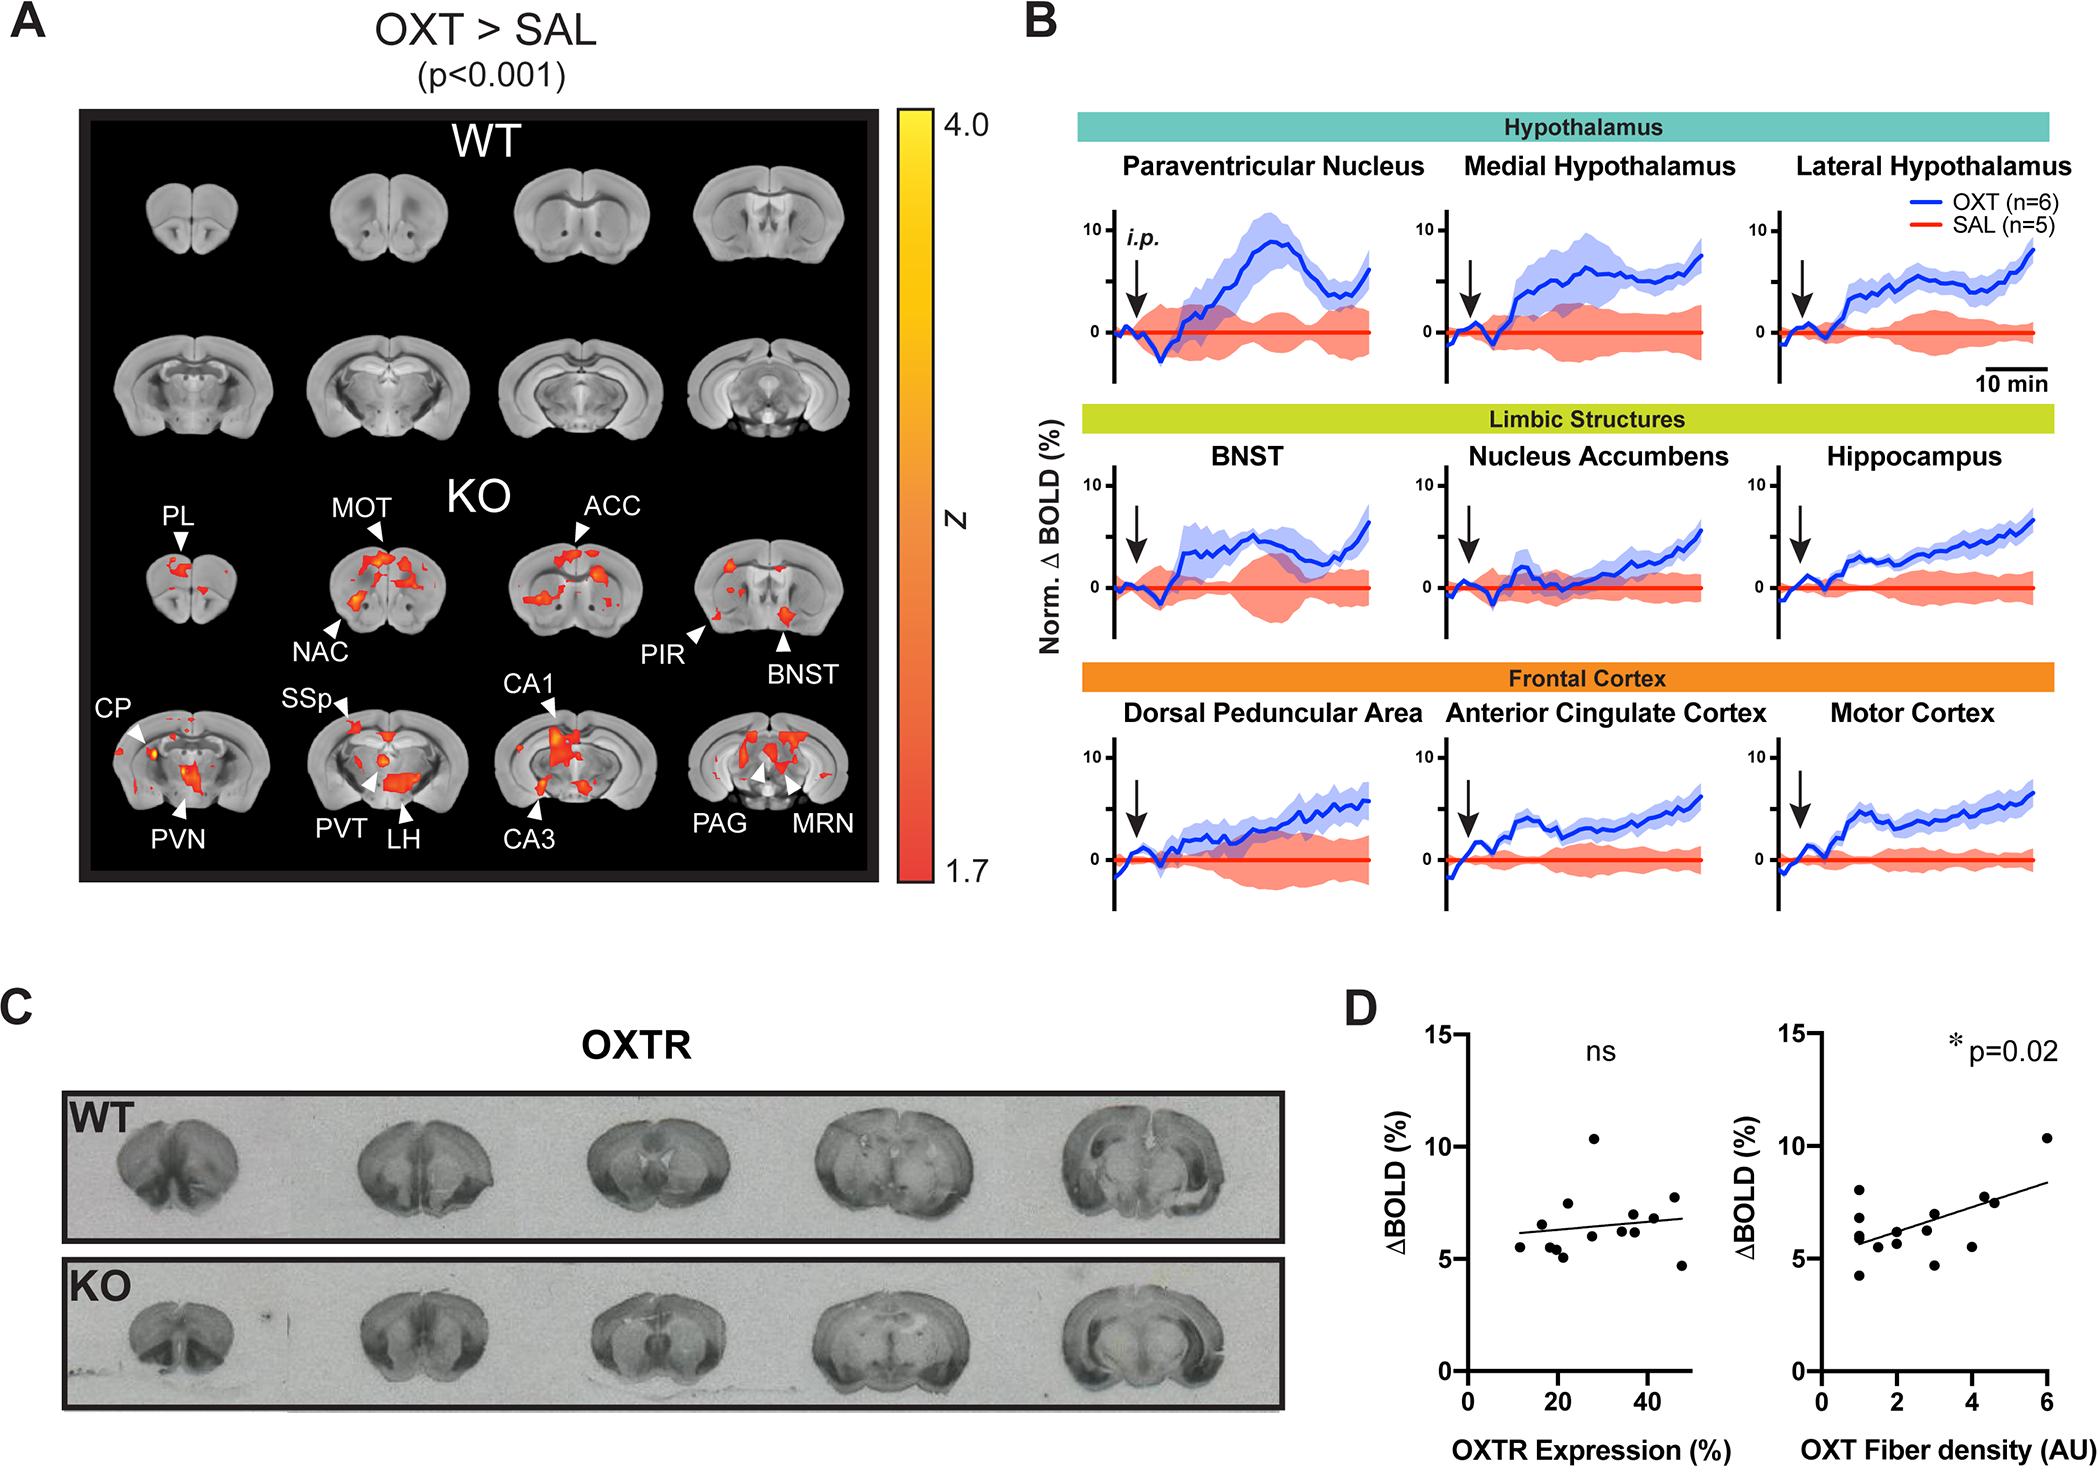
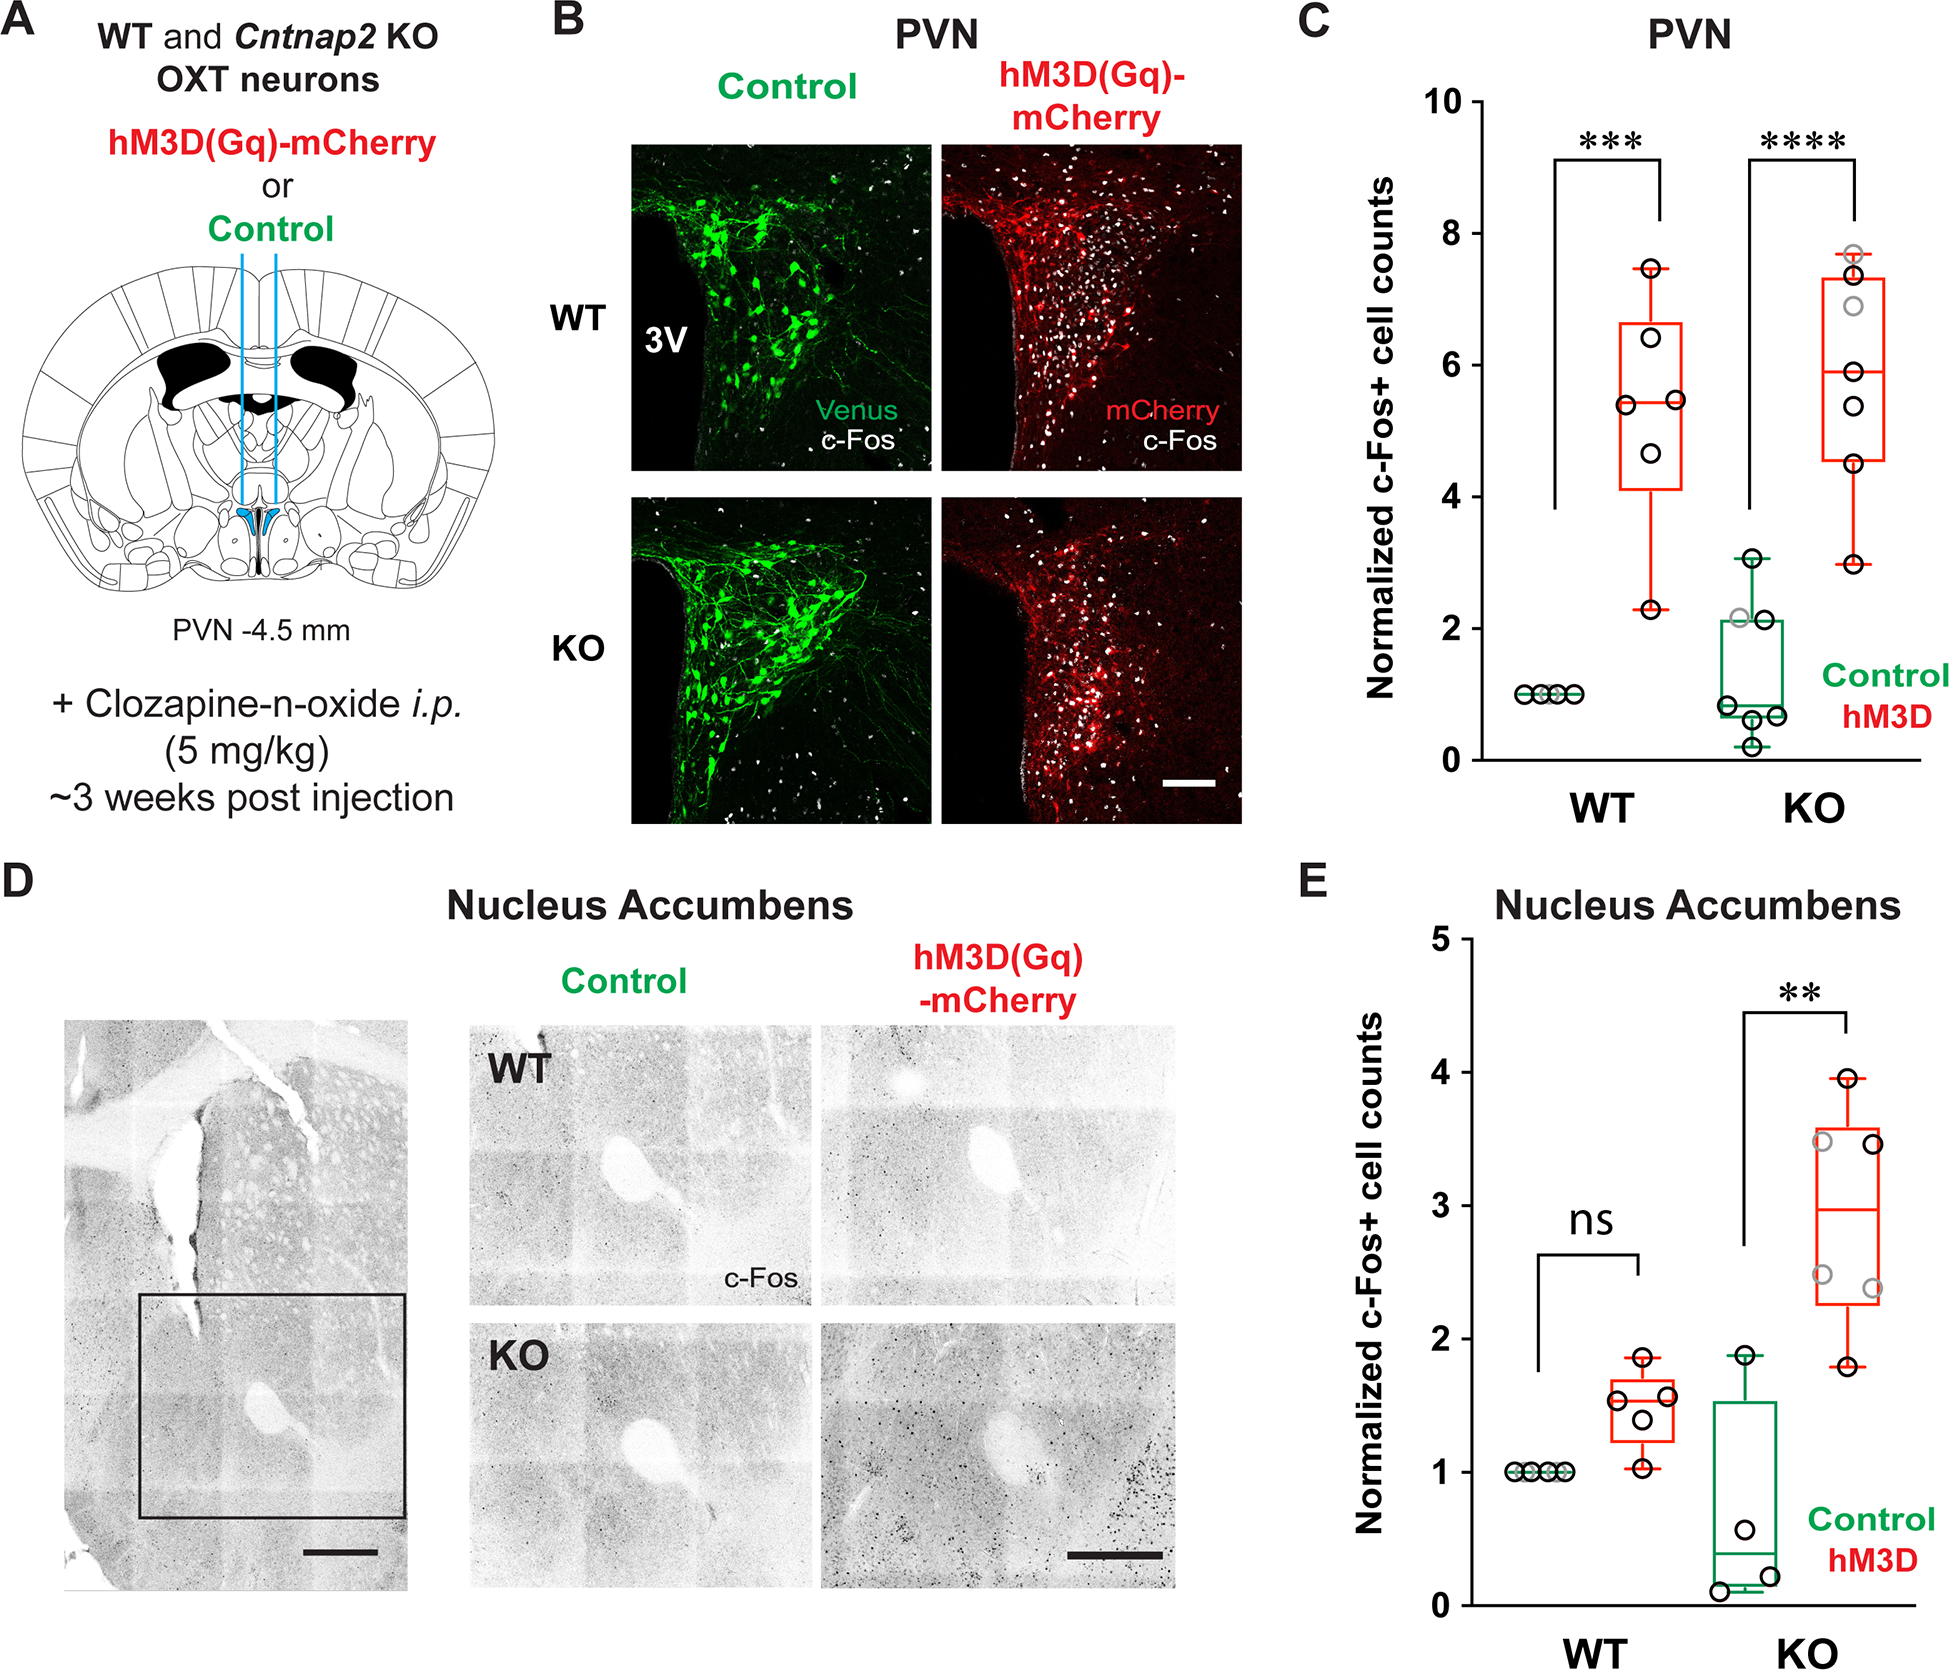
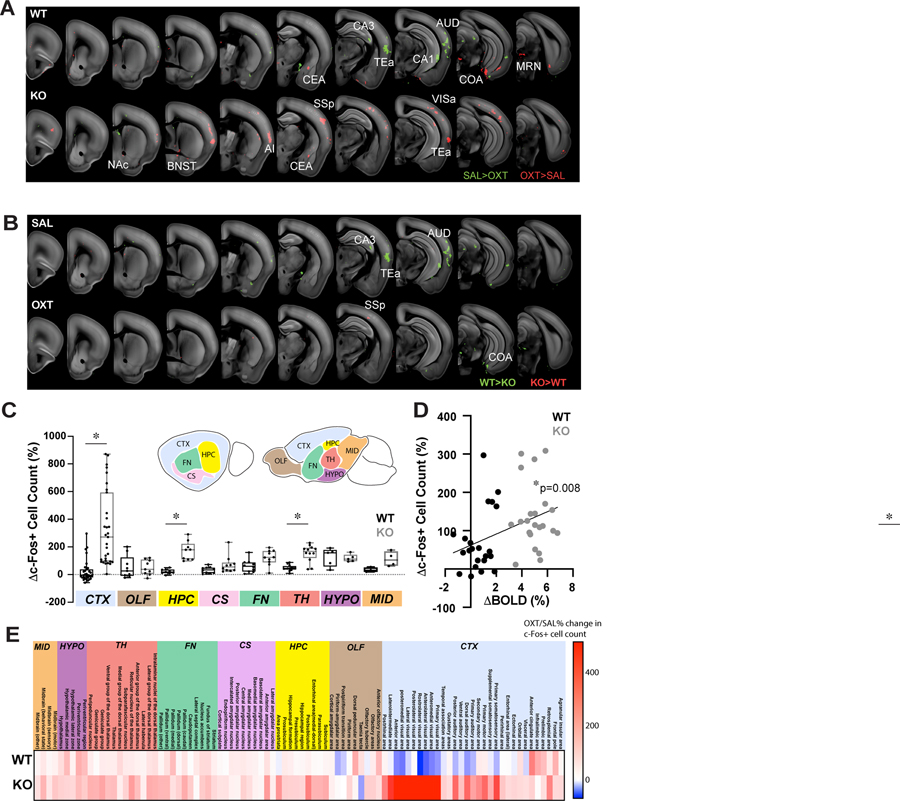
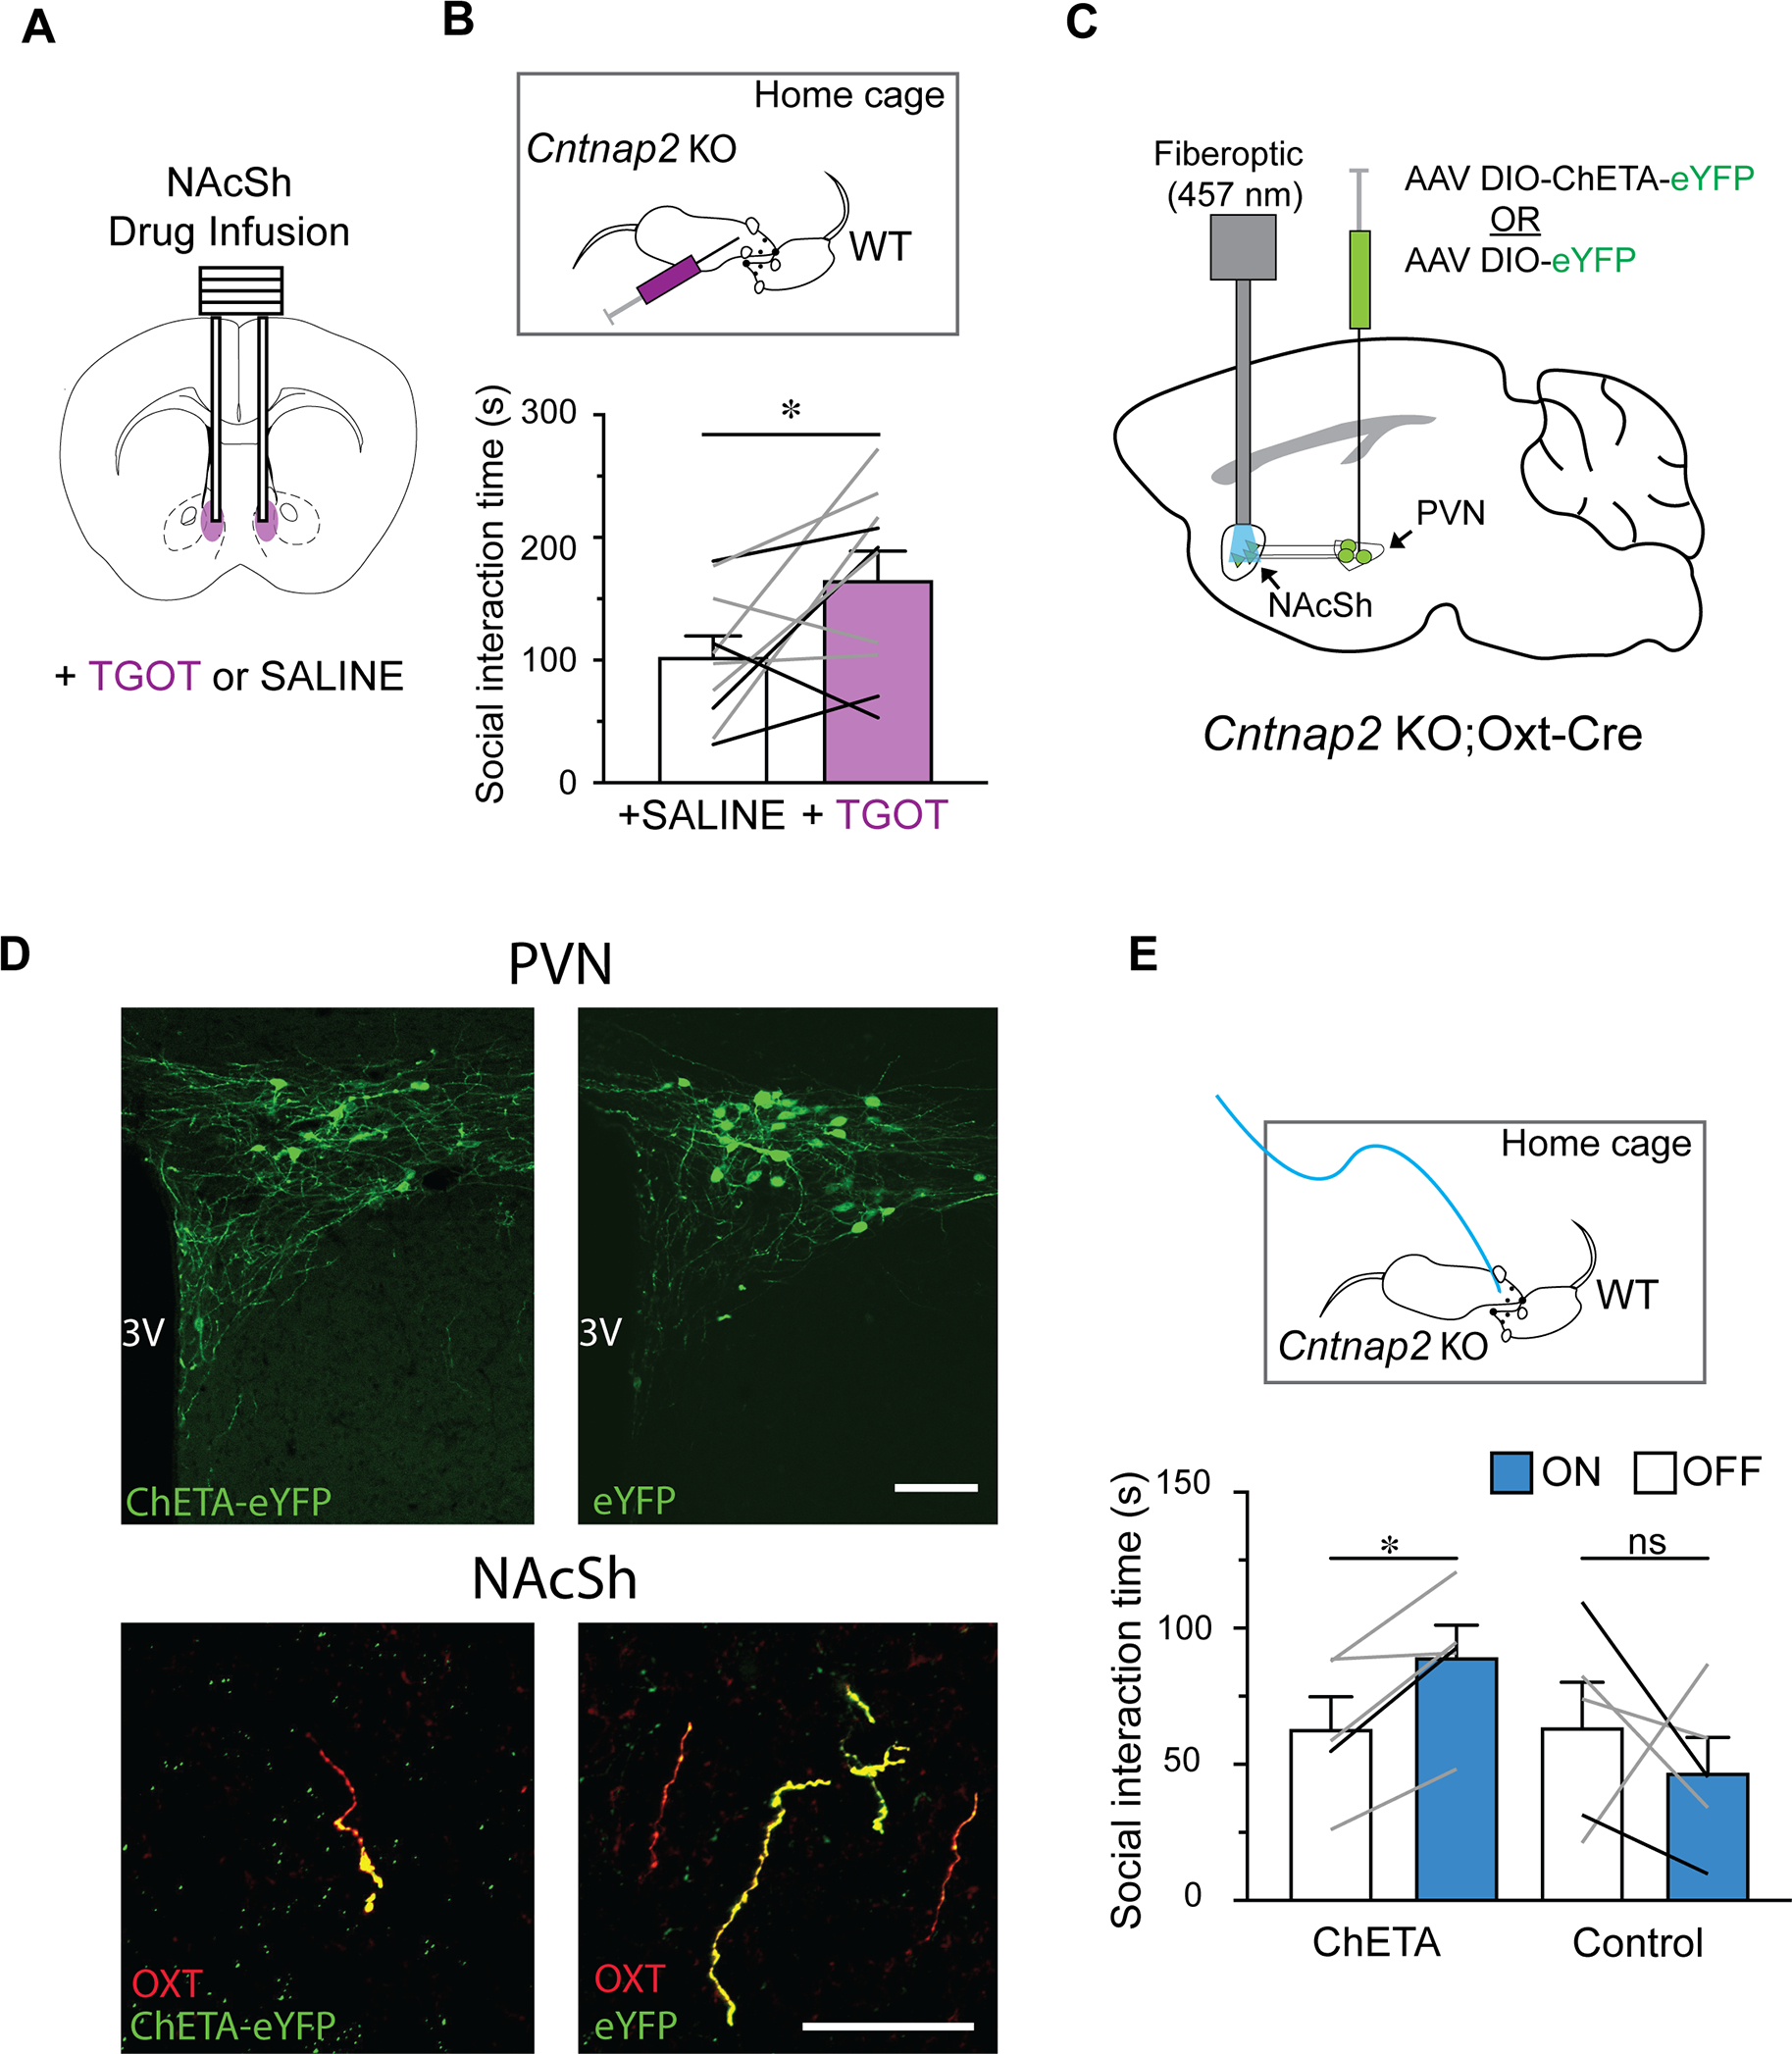
The neural basis of abnormal social behavior in autism spectrum disorders (ASDs) remains incompletely understood. Here we used two complementary but independent brain-wide mapping approaches, mouse resting-state fMRI and c-Fos-iDISCO+ imaging, to construct brain-wide activity and connectivity maps of the Cntnap2 knockout (KO) mouse model of ASD. At the macroscale level, we detected reduced functional coupling across social brain regions despite general patterns of hyperconnectivity across major brain structures. Oxytocin administration, which rescues social deficits in KO mice, strongly stimulated many brain areas and normalized connectivity patterns. Notably, chemogenetically triggered release of endogenous oxytocin strongly stimulated the nucleus accumbens (NAc), a forebrain nucleus implicated in social reward. Furthermore, NAc-targeted approaches to activate local oxytocin receptors sufficiently rescued their social deficits. Our findings establish circuit- and systems-level mechanisms of social deficits in Cntnap2 KO mice and reveal the NAc as a region that can be modulated by oxytocin to promote social interactions.

Keywords: autism; brain network; fMRI; functional connectivity; iDISCO; mouse model; nucleus accumbens; oxytocin; paraventricular nucleus; social behavior.


Conflict of interest statement

Declaration of interests The authors report no competing interests.

Figures

Fig. 1:
Fig. 1:. Structure- and function-based comparisons of functional connectivity between WT and KO mice before and after OXT.
(A) Top: macroscale comparison of basal rsFC between WT and KO mice (KO-WT) in pairs of seven major brain structures (OLF, olfactory cortex; CTX, isocortex; FN, forebrain nuclei; HPC, hippocampus; TH, thalamus; HYPO, hypothalamus; MID, midbrain). Lines indicate significant WT-KO rsFC differences (p < 0.01, Monte Carlo permutation test). Line thickness indicates higher statistical significance. Red, WT < KO; blue, KO < WT. *p < 0.01, **p < 0.005, ***p < 0.001. Bottom: heatmap represents rsFC differences (red-blue, Δz) for each pair. (B) Heatmaps representing basal WT-KO rsFC differences (upper triangle, red-blue) and p values (lower triangle, grayscale; unpaired t test, uncorrected values) for each pair. Colored boxes indicate pairwise rsFC of social-social (red), social-other (purple), and other-other (blue) regions (Monte Carlo permutation test). *p < 0.05; ns, not significant. (C and D) Macroscale rsFC shifts triggered by i.p. OXT injection compared to baseline (OXT-BL; t = 30 min) for WT (C) and KO (D) mice. (E and F) Heatmaps representing OXT-induced rsFC changes (upper triangle, red-blue) and p values (lower triangle, greyscale; paired t test, uncorrected values) for each ROI pair in WT (E) and KO (F) mice. *p < 0.05; ns, not significant.
Fig. 2:
Fig. 2:. Independent component analysis of functional connectivity between WT and KO mice, before and after OXT.
(A-C) Box-whisker plots represent a summary of r values (whisker: min-max values, box: 25–75th percentile, lines: individual before-after values, black for males and grey for females) of between-component connectivity for each genotype group, before and after OXT (t=30 min). Out of 40 identified independent components (ICs), OXT significantly modified rsFC between 3 KO pairs, and no WT pairs (paired t-test, * FDR<0.1).
Fig. 3:
Fig. 3:. Exogenous OXT induces a selective pattern of BOLD signal increases in the KO mouse.
(A) Red-orange blobs overlaid on a reference structural scan indicate significantly activated voxels (OXT>SAL). n=5–6/group. (B) Time plots compare % BOLD signal change induced by OXT or SAL in selected brain regions. (C) OXT receptor (OXTR) autoradiography images reveal a relatively preserved pattern of OXTR expression in KO. (D) Scatter plots and regression lines compare correlations between average % BOLD change by OXT and OXTR expression density (left) or OXT fiber density (right) in each examined ROI (circle). * p<0.05; ns, not significant.
Fig. 4:
Fig. 4:. Exogenous OXT induces an overlapping change in brain-wide c-Fos and BOLD activity.
(A-B) Within-genotype (A) and between-genotype (B) comparisons of regional activity levels between OXT and SAL injected mice using c-Fos-iDISCO+. Red (OXT>SAL or KO>WT) and green (SAL>OXT or WT<KO) blobs overlaid on the reference brain image indicate voxels with significantly different (p<0.005) c-Fos+ cell counts. (C) Bar-whisker plots (whisker: min-max values, box: 25–75th percentile, circles: individual ROI values) compare the average % change in c-Fos+ cell counts between WT (black) and KO (grey) mice. Kruskal-Wallis test. (D) Significant correlation between OXT-induced regional activity changes measured by phMRI (x-axis) and iDISCO+ (y-axis) indicated by a regression line. (E) Heatmap illustrating WT vs. KO regional % changes to c-Fos+ cell count after OXT. Circles, individual ROI average values. n=4–5/group. * p<0.05.
Fig. 5:
Fig. 5:. Chemogenetic activation of endogenous OXT release strongly activates the NAc.
(A) A schematic of the DREADD approach used to activate endogenous OXT release. (B) Confocal images displaying AAV-driven expression of fluorescent reporter proteins (Venus (control), green or hM3D(Gq)-mCherry, red) in PVN OXT neurons, overlaid with c-Fos immunostaining as a proxy for neuronal activation post CNO injection (white). 3V, 3rd ventricle. Scale bar = 100 μm. (C) Box-whisker plot (whiskers: min-max values, box: 25–75th percentile, circles: individual values, black for males and grey for females) compares the number of c-Fos+ cells in WT and KO PVN after hM3D or control virus injections. Circles represent individual datapoints (grey: females, black: male). (D) Confocal images showing immunostained c-Fos+ cells in the NAc. Scale bar = 500 μm. (E) DREADD-stimulation of PVN OXT neurons significantly increases c-Fos+ cell counts in KO NAc, not WT. Kruskal-Wallis test. ** p<0.01, *** p<0.005, **** p<0.001, ns, not significant.
Fig. 6:
Fig. 6:. OXT in NAc increases social behavior in KO mice.
(A) Schematic of in vivo NAcSh infusion. (B) Top, schematic of home-cage social interaction assay combined with NAcSh infusion. Bottom, average social interaction time of KO mice with novel WT mice significantly increases after TGOT infusion. Paired t-test. (C) Schematic illustrating in vivo optogenetic stimulation of NAcSh-targeted OXT release. (D) Confirmation of eYFP expression in the PVN and NAcSh of mice injected with AAVs packaging either ChETA-eYFP (left) or eYFP Control (right). Scale bars = 100 μm (top), 50 μm (bottom). (E) Top, schematic of optogenetic stimulation during home cage reciprocal social interaction. Bottom, optogenetic stimulation significantly increases the average social interaction time of ChETA-expressing, but not control, KO mice. Lines represent individual animals (grey: female, black: male). One-way RM ANOVA, *, p<0.05; ns, not significant. Data are represented as mean ± SEM.

References

    1. Adamczak JM, Farr TD, Seehafer JU, Kalthoff D, and Hoehn M (2010). High field BOLD response to forepaw stimulation in the mouse. Neuroimage 51, 704–712. - PubMed
    1. Ahrens ET, and Dubowitz DJ (2001). Peripheral somatosensory fMRI in mouse at 11.7 T. NMR Biomed 14, 318–324. - PubMed
    1. Anderson DJ (2016). Circuit modules linking internal states and social behaviour in flies and mice. Nat Rev Neurosci 17, 692–704. - PubMed
    1. Aragona BJ, Liu Y, Curtis JT, Stephan FK, and Wang Z (2003). A critical role for nucleus accumbens dopamine in partner-preference formation in male prairie voles. The Journal of neuroscience : the official journal of the Society for Neuroscience 23, 3483–3490. - PMC - PubMed
    1. Baio J, Wiggins L, Christensen DL, Maenner MJ, Daniels J, Warren Z, Kurzius-Spencer M, Zahorodny W, Robinson Rosenberg C, White T, et al. (2018). Prevalence of Autism Spectrum Disorder Among Children Aged 8 Years - Autism and Developmental Disabilities Monitoring Network, 11 Sites, United States, 2014. Morbidity and mortality weekly report Surveillance summaries (Washington, DC : 2002) 67, 1–23. - PMC - PubMed

Publication types