Meta-Analysis
. 2022 Jan:75:103758.
doi: 10.1016/j.ebiom.2021.103758. Epub 2021 Dec 18.

Targeting uPA-uPAR interaction to improve intestinal epithelial barrier integrity in inflammatory bowel disease

Affiliations
Meta-Analysis

Targeting uPA-uPAR interaction to improve intestinal epithelial barrier integrity in inflammatory bowel disease

Yang Cheng et al. EBioMedicine. 2022 Jan.

Abstract

Background: Loss of intestinal epithelial barrier integrity is a critical component of Inflammatory Bowel Disease (IBD) pathogenesis. Co-expression regulation of ligand-receptor pairs in IBD mucosa has not been systematically studied. Targeting ligand-receptor pairs which are induced in IBD mucosa and function in intestinal epithelial barrier integrity may provide novel therapeutics for IBD.

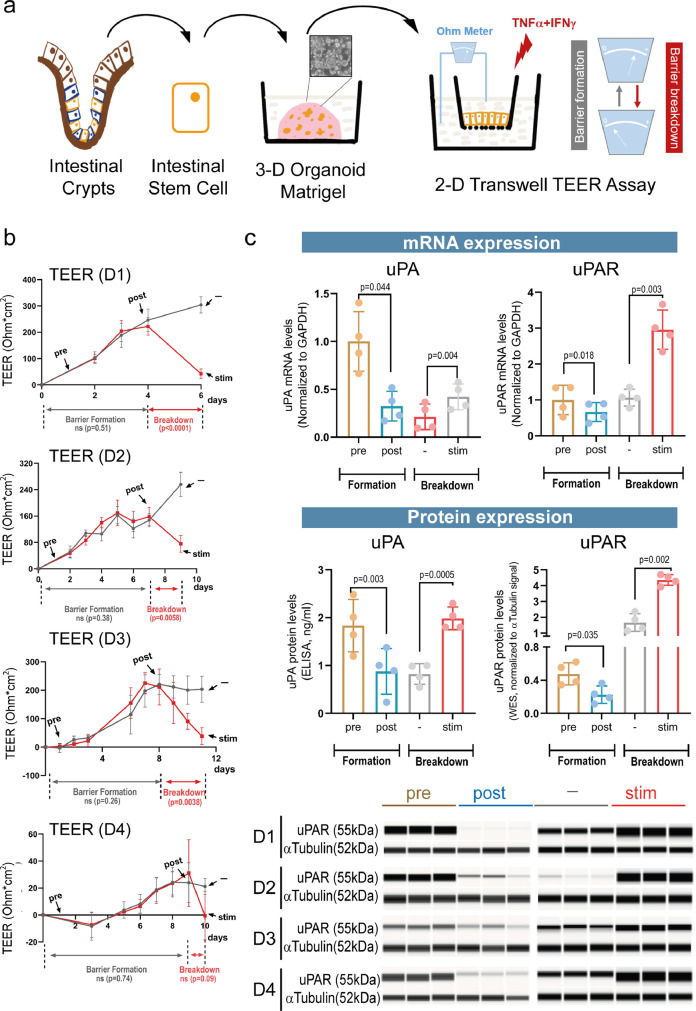
Methods: We performed transcriptomic meta-analysis on public IBD datasets combined with cell surface protein-protein-interaction (PPI) databases. We explored primary human/mouse intestinal organoids and Caco-2 cells for expression and function studies of uPA-uPAR (prime hits from the meta-analysis). Epithelial barrier integrity was measured by Trans-Epithelial Electrical Resistance (TEER), FITC-Dextran permeability and tight junction assessment. Genetic (CRISPR, siRNA and KO mice) and pharmacological (small molecules, neutralizing antibody and peptide inhibitors) approaches were applied. Mice deficient of uPAR were studied using the Dextran Sulfate Sodium (DSS)-induced colitis model.

Findings: The IBD ligand-receptor meta-analysis led to the discovery of a coordinated upregulation of uPA and uPAR in IBD mucosa. Both genes were significantly upregulated during epithelial barrier breakdown in primary intestinal organoids and decreased during barrier formation. Genetic inhibition of uPAR or uPA, or pharmacologically blocking uPA-uPAR interaction protects against cytokine-induced barrier breakdown. Deficiency of uPAR in epithelial cells leads to enhanced EGF/EGFR signalling, a known regulator of epithelial homeostasis and repair. Mice deficient of uPAR display improved intestinal barrier function in vitro and during DSS-induced colitis in vivo.

Interpretation: Our findings suggest that blocking uPA-uPAR interaction via pharmacological agents protects the epithelial barrier from inflammation-induced damage, indicating a potential therapeutic target for IBD.

Funding: The study was funded by Boehringer Ingelheim.

Keywords: IBD; Intestinal epithelial barrier; Organoid; uPA; uPAR.


Conflict of interest statement

Declaration of interests During the study, all the authors were Boehringer Ingelheim employees. No author has any further financial, professional, or personal disclosures.

Figures

Fig 1
Figure 1
The search of co-regulated ligand-receptor pairs in IBD mucosa. (a). Meta-analysis on 15 human IBD studies was performed and aggregated p value (after BH correction) for each gene was obtained by r-th ordered p value approach for UC and CD subtypes: specifically, 50 percentile p value was used to represent final p value of a given gene in either CD or UC group compared to normal. Significantly up-regulated genes were selected based on a cut-off final p value < 0.05 and median fold change > 1.5. Separately, an internal ligand-receptor pool (See Methods) was established based on surveying Protein-Protein-Interaction (PPI) databases. Ligand-receptor relationship was defined by intrinsic algorism of the databases. The overlap of CD and UC significant genes from meta-analysis was further intersected with the ligand-receptor pool. High-confidence IBD ligand-receptor pairs were selected with 4 or more supporting PPI databases. (b). Ligand receptor pairs identified from the workflow above. Average values of the pair (FC and adjusted p) were used in the plot. Note that chemokines and receptors were removed from the graph to highlight the other pairs. See a full list in Table S1. (c). Expression of uPAR and uPA in all the studies examined. Median fold change between IBD and normal samples was used to assess the induction. GSE16879 (highlighted with *) was displayed in Figure 1d (anti-TNF study). E-MTAB-5464 (highlighted with #) was displayed in Figure S1 (IBD epithelial cell study). (d). mRNA levels of uPAR and uPA in UC and CD responder/non-responder patients, before and after treatment of anti-TNF (infliximab), compared with non-IBD controls. (GSE16879).R., anti-TNF responders; nR., anti-TNF non-responders; Bef αTNF, before anti-TNF treatment; Aft αTNF, after anti-TNF treatment. All data are shown as mean ± SD and are analysed using 1-way ANOVA followed by Dunnett's multiple comparison test. ns, non-significant.
Fig 2
Figure 2
Both uPAR and uPA are upregulated during intestinal epithelial barrier breakdown. (a). Workflow of the monolayer assay derived from primary human intestinal organoids from small intestine (See Methods for details). Monolayer breakdown is triggered by simultaneous TNF-α and IFN-γ treatment. (b). TEER assay with four primary intestinal organoid donors (D1, D2, D3 and D4, n = 20/donor, 10 in control and 10 in stim group). For each donor, comparisons between the control and the stim groups during barrier formation and barrier breakdown are shown. Samples at four time points are used for the later studies: pre indicates pre-barrier formation; post indicates post-barrier formation; - indicates control treatment; and stim indicates TNF-α and IFN-γ treatment. (c). Relative expression levels of uPAR and uPA during barrier formation and breakdown in four donors (n = 3 per donor per condition, repeated 3 times). mRNA levels were assessed by Taqman assay and protein levels by ELISA (uPA) or western blot (uPAR). Protein expression of uPAR was quantified by digital peak intensity values generated by the ProteinSimple COMPASS software and was normalized to the corresponding α-Tubulin peak. All data are shown as mean ± SD and are analysed using 2-way ANOVA (b) or paired Student's t test (c).
Fig 3
Figure 3
Genetic deletion of uPAR or uPA protects epithelial barrier from cytokine-induced damage. (a). Protein levels of uPAR and uPA in parental and KO cells (n = 3/group, same below). Alternative genetic inhibition assay with siRNAs were presented in Figure S2. (b). Barrier function of uPAR KO cells and uPA KO cells comparing to parental cells assessed by TEER and FITC-Dextran permeability. Permeability (%) is achieved by normalizing to the level of parental cells after stimulation. (c). GBP1 mRNA expression (by Taqman assay) in parental and KO cells. (d). Barrier formation in uPAR and uPA KO cells (n = 6/group). TEER values during barrier formation are shown. (e-f). Localization of tight junction proteins ZO-1 (red) (e) and JAM-A (magenta) (f) in the parental and KO cells before (-) and after barrier damage (stim). Nuclei are visualized with DAPI (blue) Relative intensity is presented on the right (n = 5/group, normalized to parental controls). All data are shown as mean ± SD and are analysed using 2-way ANOVA followed by Šidák's multiple comparison test (a-c, e-f) or 1-way ANOVA followed by Dunnett's multiple comparison test (d).
Fig 4
Figure 4
Inhibition of uPA-uPAR interaction through small inhibitors or uPAR antibody protects barrier function in primary organoids and Caco-2 cells measured by TEER. (Equivalent Permeability results are shown in Figure S4) (a). Schematic display of uPA-uPAR inhibition by small molecule inhibitor IPR-1110 and WX-UK1, uPAR antibody ab5329 and small peptide AE234 and AE147. (b-d). Two organoid donors and Caco-2 cells were treated with IPR-1110 and WX-UK1 (b), uPAR antibody ab5329 (c) or small peptide inhibitor AE234 and AE147 (d) during barrier breakdown (n = 3/group). ELISA validation of ab5329 in blocking uPA-uPAR interaction is presented in (e). TEER values after damage are recorded. A corresponding amount of DMSO (0.1%) was used as control for small molecule treatment (b); Mouse IgG at the same concentration was used as control for antibody treatment. All data are shown as mean ± SD and are analysed using 1-way ANOVA followed by Dunnett's multiple comparison test. ns, non-significant. (e). ab5329 interferes with uPA-uPAR binding by ELISA assay.
Fig 5
Figure 5
uPAR interacts with EGFR to regulate barrier function. (a). Co-Immunoprecipitation (IP) of uPAR and integrin subunit α5, β1, β3 (ITGA5, ITGB1, ITGB3, respectively) and EGFR. uPAR IP, reciprocal IP and Input were displayed. Stim, TNF-α and IFN-γ treatment for 72 h. P, Parental Caco-2 cells; KO: uPAR KO Caco-2 cells. Both uPAR and the corresponding reciprocal IP were repeated at least 3 times and one representative graph is presented. (b). pEGFR (Y1068) levels in parental and uPAR KO cells after 30 min treatment of TNF-α and IFN-γ. Signal intensity is calculated by 3 replicative experiments (see supplemental file for the full blots of the 3 experiments). (c-d). Parental and uPAR KO cells are treated with EGF followed by barrier breakdown stimulation (n = 3/group). TEER values after breakdown (c) and breakdown-associated GBP1 expression (d) are presented. All data are shown as mean ± SD and are analysed using 2-way ANOVA followed by Šidák's multiple comparison test. ns, non-significant (b-d). (e). Kinase array from parental and KO cells before and after stimulation. Fold change (FC) of induced phosphorylation in parental and uPAR deficient cells. FC (Stim/Control) is calculated by the signal. Values were adjusted to reference dots. (f). A proposed model for uPA-uPAR in regulating intestinal epithelial barrier.
Fig 6
Figure 6
Mice deficient of uPAR display improved intestinal epi-barrier function. (a). Workflow of the monolayer assay derived from primary murine intestinal organoids from WT (Plaur +/+) and uPAR deficient (Plaur -/-) mice. Monolayer breakdown was triggered by simultaneous murine TNF-α and IFN-γ treatment (10 ng/ml each). 3 donors of each genotype were used in the monolayer assay. (b). Barrier function after TNF-α and IFN-γ induced damage in monolayers derived from WT or uPAR deficient murine intestinal organoids (n = 9/treatment group). TEER and FITC-Dextran permeability were assessed. Stim, murine TNF-α and IFN-γ treatment for 48 hours. (c). Barrier formation in WT and uPAR deficient monolayers was monitored (3 donors/genotype, D1, D2 and D3). (d). Localization of ZO-1 (red) and JAM-A (magenta) in the murine organoid-derived monolayers before (-) and after (stim) barrier damage. Nuclei are visualized with DAPI (blue) in the bottom panel. Bright field images of 3D organoids and 2D monolayers are presented on the top panel. Relative intensity is presented on the right (n = 5/group, normalized to WT controls). ZO-1 and JAM-A protein levels before and after barrier damage are presented in Figure S6e. (e). Workflow of the DSS-colitis study. (f). Histopathology assessment of naïve WT controls (n = 8), WT (n = 17) and uPAR deficient mice (n = 18) after DSS-induced colitis. 4 sections from each animal were scored in a double-blinded fashion and average scores are presented on the right. See Methods for more details. Representative images were presented with the corresponding scores. (g). Localization of ZO-1 (red) and JAM-A (magenta) in colonic sections from naïve controls, WT or uPAR KO mice after DSS treatment. Nuclei are visualized with DAPI (blue). Regions with disrupted tight junction are marked with white arrows. Relative intensity is presented below (naïve: n = 3, WT or KO DSS treated groups: n = 4). (h-i). Gene expression profiling (shown as Heatmap, h) of distal colon tissue from the DSS colitis study comparing WT and uPAR KO mice. Genes displayed are all DSS-induced genes in WT mice (FC >1.5, p < 0.05, total = 192 genes). Detailed expression levels of S100a8, S100a9, Spp1, Mmp13, Il6 and Il1b from the Nanostring analysis of individual animals is shown (i). All data are shown as mean ± SD and are analysed using 2-way ANOVA followed by Šidák's multiple comparison test (b, d) or 1-way ANOVA followed by Dunnett's multiple comparison test (c, f, g, i).

References

    1. Konig J, Wells J, Cani PD, Garcia-Rodenas CL, MacDonald T, Mercenier A, et al. Human intestinal barrier function in health and disease. Clin Transl Gastroenterol. 2016;7(10):e196. - PMC - PubMed
    1. McGuckin MA, Eri R, Simms LA, Florin TH, Radford-Smith G. Intestinal barrier dysfunction in inflammatory bowel diseases. Inflamm Bowel Dis. 2009;15(1):100–113. - PubMed
    1. Groschwitz KR, Hogan SP. Intestinal barrier function: molecular regulation and disease pathogenesis. J Allergy Clin Immunol. 2009;124(1):3–20. quiz 1-2. - PMC - PubMed
    1. Neurath MF, Travis SP. Mucosal healing in inflammatory bowel diseases: a systematic review. Gut. 2012;61(11):1619–1635. - PubMed
    1. Neurath MF. New targets for mucosal healing and therapy in inflammatory bowel diseases. Mucosal Immunol. 2014;7(1):6–19. - PubMed

Publication types

Substances