. 2022 Apr 26;6(8):2453-2465.
doi: 10.1182/bloodadvances.2021005692.

SIPA in 10 milliseconds: VWF tentacles agglomerate and capture platelets under high shear

Affiliations

SIPA in 10 milliseconds: VWF tentacles agglomerate and capture platelets under high shear

Zixiang Leonardo Liu et al. Blood Adv. .

Abstract

Shear-induced platelet aggregation (SIPA) occurs under elevated shear rates (10 000 s-1) found in stenotic coronary and carotid arteries. The pathologically high shear environment can lead to occlusive thrombosis by SIPA from the interaction of nonactivated platelets and von Willebrand factor (VWF) via glycoprotein Ib-A1 binding. This process under high shear rates is difficult to visualize experimentally with concurrent molecular- and cellular-resolutions. To understand this fast bonding, we employ a validated multiscale in silico model incorporating measured molecular kinetics and a thrombosis-on-a-chip device to delineate the flow-mediated biophysics of VWF and platelets assembly into mural microthrombi. We show that SIPA begins with VWF elongation, followed by agglomeration of platelets in the flow by soluble VWF entanglement before mural capture of the agglomerate by immobilized VWF. The entire SIPA process occurs on the order of 10 milliseconds with the agglomerate traveling a lag distance of a few hundred microns before capture, matching in vitro results. Increasing soluble VWF concentration by ∼20 times in silico leads to a ∼2 to 3 times increase in SIPA rates, matching the increase in occlusion rates found in vitro. The morphology of mural aggregates is primarily controlled by VWF molecular weight (length), where normal-length VWF leads to cluster or elongated aggregates and ultra-long VWF leads to loose aggregates seen by others' experiments. Finally, we present phase diagrams of SIPA, which provides biomechanistic rationales for a variety of thrombotic and hemostatic events in terms of platelet agglomeration and capture.


Figures

None
Graphical abstract
Figure 1.
Figure 1.
The biological basis, framework, and in vitro tool for the multiscale in silico model of SIPA. (A) Atherosclerosis creates a stenosis with wall shear rate to above 10 000 s−1, leading to an acute arterial thrombus if the plaque cap ruptures. (B) At the exposed collagen surface, SIPA stems from nonactivated platelets and VWF. We virtually construct SIPA in a computational model including immobilized VWF dimers as blue beads on the surface, soluble VWF depicted as yellow strings, and GPIb-A1 bonds as red beads. (C) Framework of the multiscale in silico method. VWFs and platelets are modeled in silico to match their biological counterparts based on in vitro measurements. The dynamics of VWF strands and platelets suspended in the blood subjected to high shear rates are resolved through the coupling among lattice-Boltzmann method, Langevin-dynamics, and rigid body dynamics with fluid-structure interactions (FSI). Platelet and VWF binding kinetics are incorporated to the model, where the kinetic rates can be measured through single-molecular measurements such as biomembrane force probe, optical tweezers, atomic force microscopy, etc. (D) A low-variability, high-throughput thrombosis-on-a-chip platform is used for the validation of the in silico results. Panels C and D partially adopt figures from previous publications with permission.
Figure 2.
Figure 2.
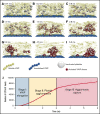
The time-lapse snapshots of SIPA divided into 3 stages. (A-C) Stage 1: VWF elongation. The activation of VWF requires its conformational change from a globular state to an elongated state. (D-F) Stage 2: agglomeration. Elongated soluble VWFs entangle platelets and form platelet agglomerates in flow. (G-I) Stage 3: capture. Suspended agglomerates contact the thrombotic surface (preadhered with immobilized VWF), roll, and eventually adhere to the surface and become a mural platelet aggregate. (J) The number of GPIb-A1 bonds over time. The number of GPIb-A1 bonds shows faster growth at stage 2 (agglomeration) compared with stage 1 and stage 3. The specific simulation here is performed at a shear rate of 10 000 s−1 with an sVWF concentration of 3 times normal plasma (NP)-VWF concentration and a VWF length of 1.6 μm. The 3 times VWF concentration is selected to ensure 1 complete SIPA process would occur.
Figure 3.
Figure 3.
Agglomeration and capture define a lag distance in SIPA with different dependences on sVWF and iVWF. (A) The computed rolling velocity of a single platelet on a VWF-A1–coated surface under 2 shear rates. (B) The averaged rolling velocity (n = 10) compares favorably with existing in vitro measurements. (C) The capture of platelet agglomerates occurs after a lag distance of around 150 μm in our thrombosis-on-a-chip device. The plot shows the API (n = 40) vs the distance from the entrance of the stenotic section, where the peak API denotes the location that most of the aggregates appear. The snapshots show representative occluded channels; the bright color denotes the captured platelet agglomerates. Flow is from left to right. (D) The lag distance of platelet agglomerates calculated from our in silico model compared against those observed in our and Ruggeri’s in vitro settings. The initial WSR of our in vitro setting is 6500 s−1, which would increase as the channel occludes. The WSR of the experiment setting by Ruggeri et al. is ∼20 000 s−1. Three WSRs, 6500, 10 000, and 20 000 s−1, were simulated, where the VWF/platelet conditions are the same as the experiment. Each in silico data (mean and SD) is based 6 runs with different VWF lengths (changing from 1.6 to 6.4 μm). The lag distance (mean and SD) from Ruggeri et al is estimated from the dispersed number of platelet aggregates shown in Figure 2A taken after 7 s of whole blood perfusion. API of 175 and above is used to quantify the thrombus location. (E) The agglomeration level plotted against time. Agglomeration depends on sVWF but is insensitive to the presence of iVWF. (F) The superficial velocity (normalized by volume-averaged fluid velocity of ∼1.2 cm/s) plotted against time. The capture of the agglomerate requires the presence of iVWF, although excessive iVWF level does not shorten the lag distance. For panels E and F, a 6× normal sVWF concentration was used to obtain a faster capture event.
Figure 4.
Figure 4.
Increasing soluble VWF concentration enhances SIPA rate and shortens time to occlusion. Agglomeration (A) and superficial velocity (C) over time for VWF concentrations ranging from 0.1 times to 18 times normal. Higher VWF concentrations cause faster agglomeration and decrease the traveling velocity. The corresponding agglomeration rate (B) and capture time (D) calculated based on (A) and (C), respectively. (E) Increasing the concentration of soluble VWF by 20-fold leads to 50% reduction of the OT. The API was inverted as 400-API. (F) The predicted enhancement of SIPA rates (in terms of agglomeration rate and 1/capture time) are elevated for high sVWF concentration that leads to an enhanced rate for arterial occlusion plotted as 1/OT from experiments. (***P < .0001). For each experimental OT, data from 12 stenosis channels using a single sample of human blood were used to calculate the mean and SD.
Figure 5.
Figure 5.
Captured agglomerates (ie, platelet aggregates) show 3 distinct morphologies primarily controlled by VWF length. (A) The platelet aggregate morphology depends on the VWF length and concentration. Three states, namely cluster state, elongated state, and loose state, are shown in the figure as a primary function of VWF length. (B) The top view of aggregate morphology observed in silico (noted in the colored boxes) for selective VWF conditions as denoted in panel A. Similar aggregate morphology observed in vitro is depicted side by side for comparison. For all 3 examples, the flow direction is from left to right. The platelet color in silico is rendered to match the in vitro counterparts. The in vitro images for panels B1 and B2 were adopted from Ruggeri et al. under elevated shear rates (10 000∼20 000 s−1) with human normal plasma VWF (whole blood). The in vitro counterpart of panel B3 was adopted from Chauhan et al with endothelial VWF (ultra-long) under venous shear rates. Both results were obtained without platelet activation.
Figure 6.
Figure 6.
Predicted phase diagrams for SIPA correlates with a variety of hemostasis and thrombosis complications. (A) The platelet agglomeration rate as a function of VWF length and VWF concentration. The filled symbols indicate an agglomeration rate that is above 0.1 ms1 with the size of the symbol scaling as the agglomeration rate. The empty symbols correspond to an agglomeration rate below 0.1 ms1, comparable to the level of agglomeration in the absence of sVWF. Plot is in log-log scale. (B) The agglomerate capture rate as a function of VWF length and VWF concentration. The regime with black symbols indicates the capture of an agglomerate. The cross symbols denote the regime showing marginal capture of agglomerate as a transitional SIPA behavior. The white symbols indicate the regime where agglomerates are not captured. (C) The in silico SIPA model should apply to both thrombosis and hemostasis. VWD type 1 or 3 features subnormal concentration or no presence of sVWF, which causes a severe bleeding disorder possibly due to lacking both agglomeration and capture. VWD type 2A/B and acquired VWF syndrome (aVWS), from excessively short VWF lengths, often leads to moderate bleeding possibly due to no capture of agglomerates. The model further predicts NP-VWF can lead to platelet adhesion with marginal capture of agglomerates, which may be required for normal hemostasis. Elevation in sVWF concentration and length leads to a substantial increase of the capture rate (1/capture time) and agglomeration rate, which may be relevant to arterial occlusive thrombosis leading to myocardial infarction (MI) and strokes. The excessive consumption of platelets and consequent bleeding disorders in thrombotic thrombocytopenic purpura (TTP) and thrombotic microangiopathy (TMA) induced by excessive ULVWF may form loose VWF-platelet nets to sequester platelets.
Figure 7.
Figure 7.
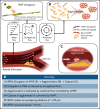
Schematics of the millisecond-scale SIPA process driving the arterial thrombus growth under pathologically high shear rates. (A) Under pathological high shear (∼10 000 s−1), VWF elongates under high shear due to the elongational effect of shear flow. (B) Elongated soluble VWFs entangle many nonactivated platelets and form agglomerates in the flow, facilitated by the rotational flow. (C) The immobilized VWF at the wall captures agglomerates in milliseconds after an agglomerate traveling lag distance of >100 μm. (D) Summary of the steps and features of SIPA described in current study.

References

    1. Virani SS, Alonso A, Benjamin EJ, et al. ; American Heart Association Council on Epidemiology and Prevention Statistics Committee and Stroke Statistics Subcommittee . Heart disease and stroke statistics—2020 update: a report from the American Heart Association. Circulation. 2020;141(9):e139-e596. - PubMed
    1. Nesbitt WS, Westein E, Tovar-Lopez FJ, et al. . A shear gradient-dependent platelet aggregation mechanism drives thrombus formation. Nat Med. 2009;15(6):665-673. - PubMed
    1. Bark DL Jr, Ku DN. Wall shear over high degree stenoses pertinent to atherothrombosis. J Biomech. 2010;43(15):2970-2977. - PubMed
    1. Le Behot A, Gauberti M, Martinez De Lizarrondo S, et al. . GpIbα-VWF blockade restores vessel patency by dissolving platelet aggregates formed under very high shear rate in mice. Blood. 2014;123(21):3354-3363. - PubMed
    1. Casa LD, Deaton DH, Ku DN. Role of high shear rate in thrombosis. J Vasc Surg. 2015;61(4):1068-1080. - PubMed

Substances