. 2022 Apr 1;12(4):984-1001.
doi: 10.1158/2159-8290.CD-21-0888.

Early Tumor-Immune Microenvironmental Remodeling and Response to First-Line Fluoropyrimidine and Platinum Chemotherapy in Advanced Gastric Cancer

Affiliations

Early Tumor-Immune Microenvironmental Remodeling and Response to First-Line Fluoropyrimidine and Platinum Chemotherapy in Advanced Gastric Cancer

Ryul Kim et al. Cancer Discov. .

Abstract

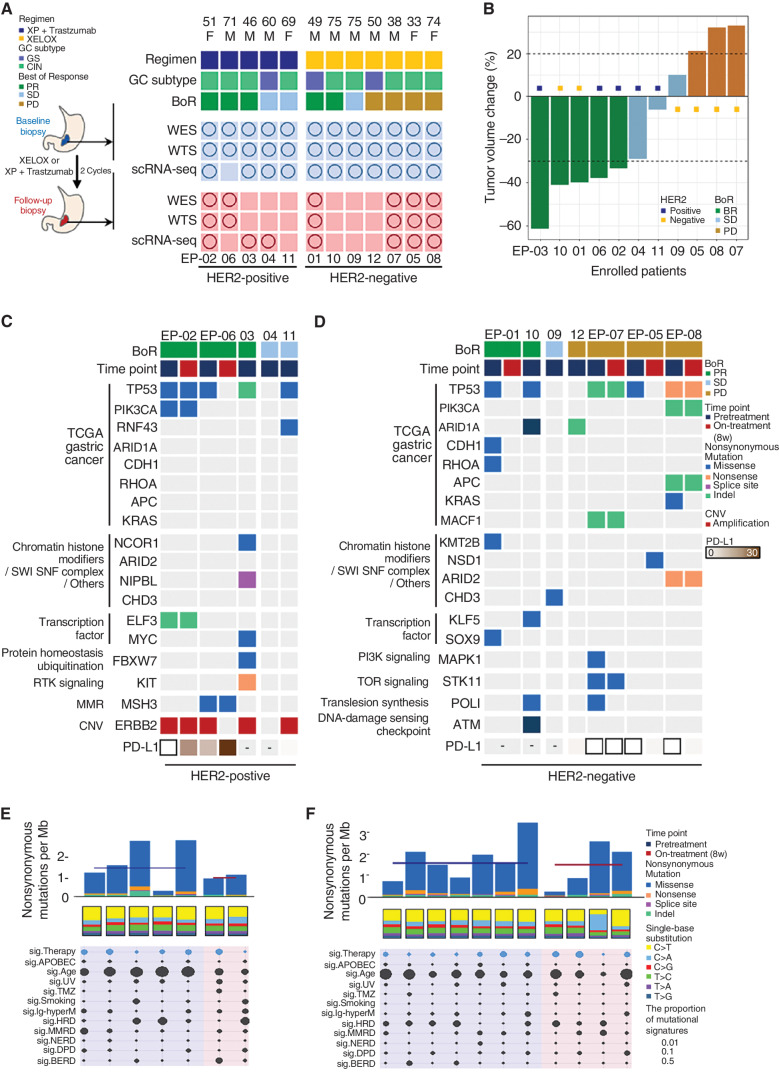
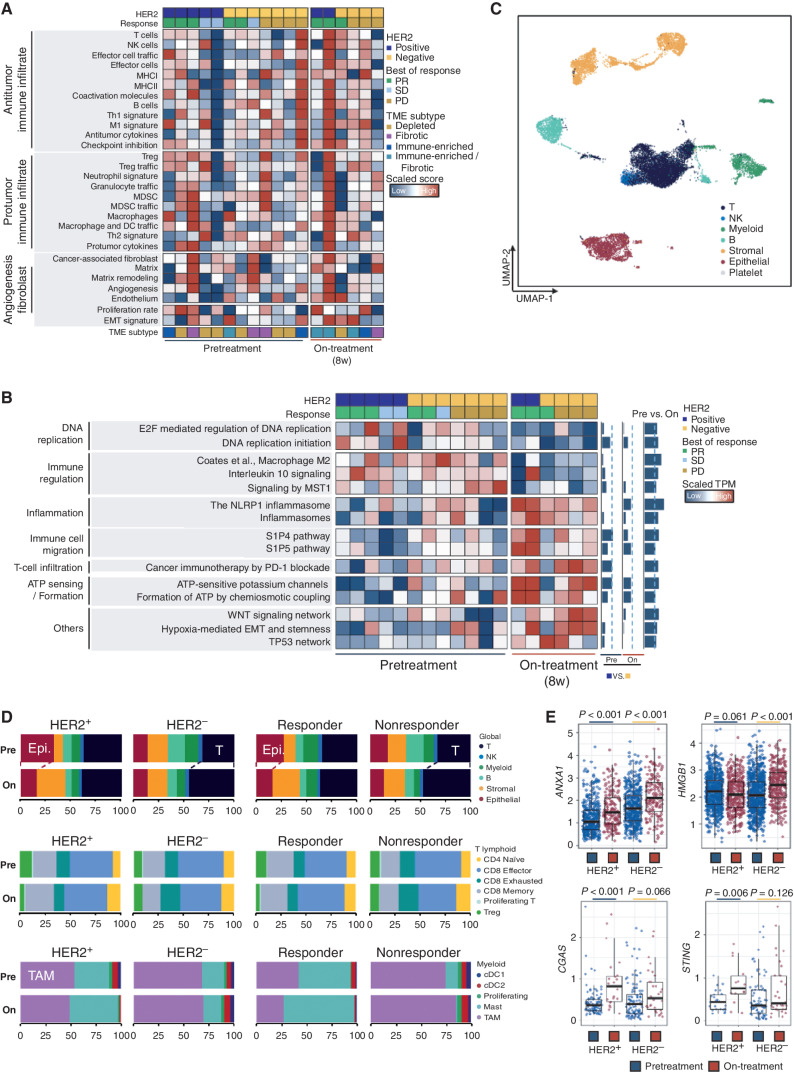
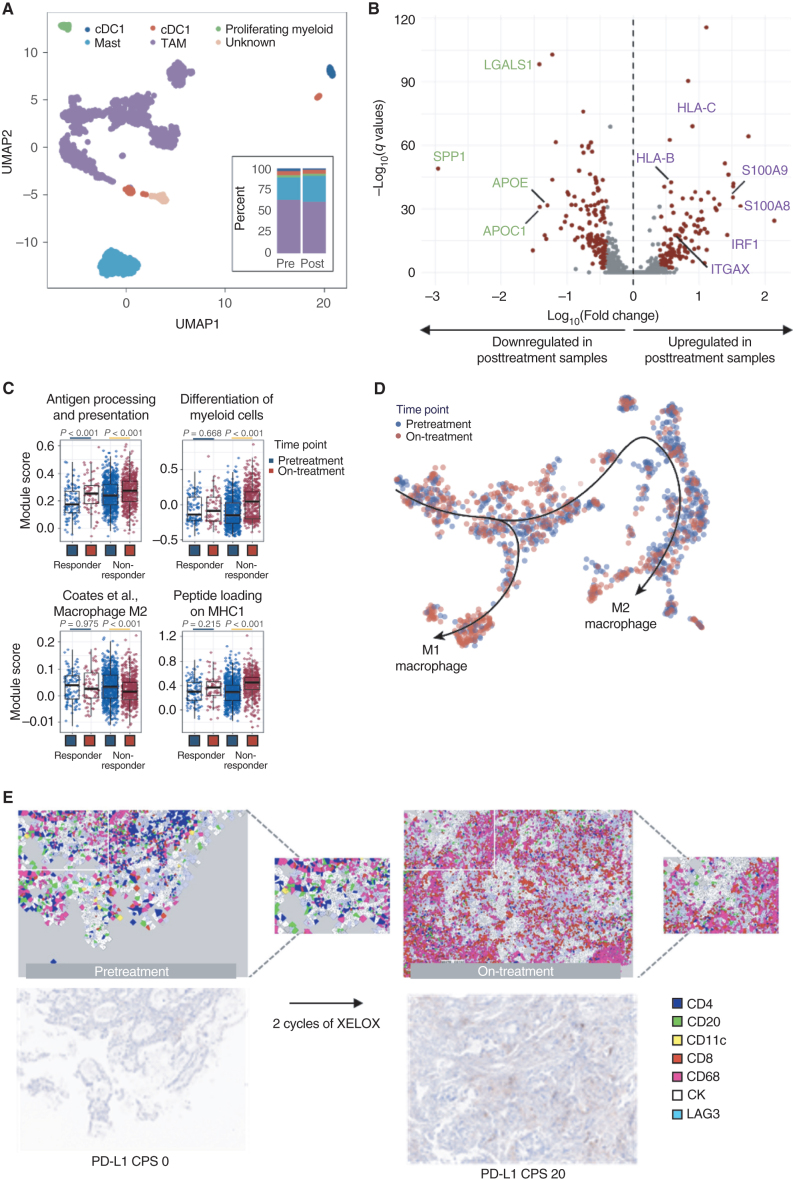
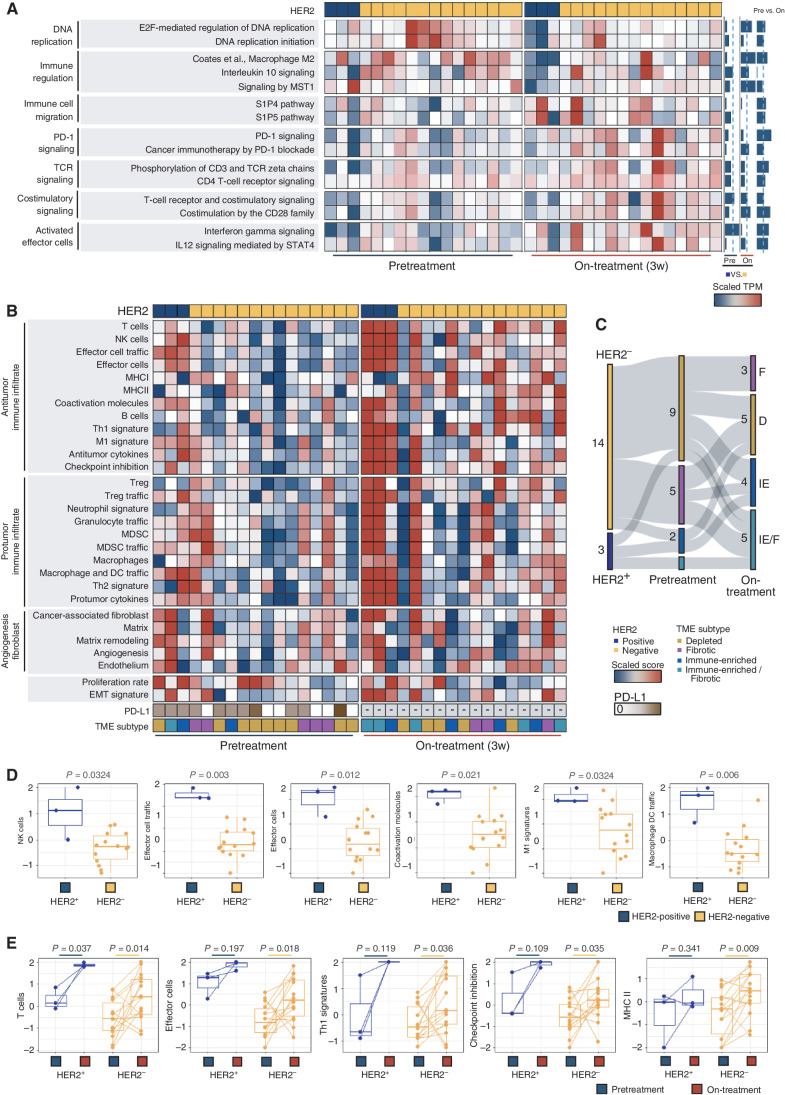
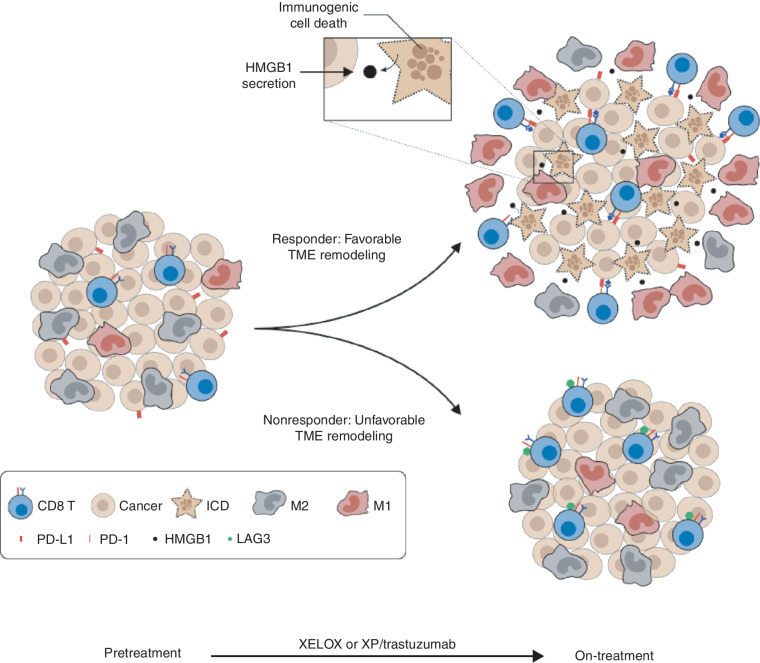
Chemotherapy is ubiquitous in first-line treatment of advanced gastric cancer, yet responses are heterogeneous, and little is known about mediators of chemotherapy response. To move forward, an understanding of the effects of standard chemotherapy on the tumor-immune microenvironment (TME) is needed. Coupling whole-exome sequencing, bulk RNA and single-cell transcriptomics from paired pretreatment and on-treatment samples in treatment-naïve patients with HER2-positive and HER2-negative gastric cancer, we define features associated with response to platinum-based chemotherapy. Response was associated with on-treatment TME remodeling including natural killer (NK) cell recruitment, decreased tumor-associated macrophages, M1-macrophage repolarization, and increased effector T-cell infiltration. Among chemotherapy nonresponders, we observed low/absent PD-L1 expression or modulation, on-treatment increases in Wnt signaling, B-cell infiltration, and LAG3-expressing T cells coupled to an exodus of dendritic cells. We did not observe significant genomic changes in early on-treatment sampling. We provide a map of on-treatment TME modulation with standard chemotherapy and nominate candidate future approaches.

Significance: Using paired pretreatment and on-treatment samples during standard first-line chemotherapy, we identify chemotherapy-induced NK-cell infiltration, macrophage repolarization, and increased antigen presentation among responders. Increased LAG3 expression and decreased dendritic cell abundance were seen in nonresponders, emphasizing remodeling of the TME during chemotherapy response and resistance. This article is highlighted in the In This Issue feature, p. 873.


Figures

Figure 1. Study overview and genomic landscape of enrolled patients. A, Experimental design. We obtained fresh tumor tissues from patients with AGC before and after two cycles of first-line chemotherapy. Response to the chemotherapy was performed using RECIST1.1 criterion (B). Patient EP12 was known to have progressed but was lost to follow-up and was not considered evaluable. The mutational landscape was analyzed in patients with HER2-positive AGC (C) and HER2-negative AGC (D). The negative sign in C and D indicates unavailable PD-L1 expression status, and hollow rectangle represents negative for PD-L1 expression. We summarized somatic mutations in selected canonical oncogenes and tumor-suppressor genes in AGC. Whole exome–derived tumor mutational burden and mutational signatures of somatic mutations in HER2-positive AGC (E) and HER2-negative AGC (F). The signature of exonic somatic SBSs was delineated by COSMIC signatures, which were represented by the following terms: age (SBS1 and SBS5), APOBEC (apolipoprotein B mRNA editing enzyme; SBS2 and SBS13), UV (ultraviolet; SBS7a, SBS7b, SBS7c, and SBS7d), TMZ (temozolomide, SBS11), smoking (SBS4), immunoglobulin gene hypermutation (SBS9), HRD (homologous recombination deficiency; SBS3), MMRD (mismatch repair deficiency; SBS6, SBS15, SBS20, and SBS26), NERD (nucleotide excision repair deficiency; SBS8), DPD (DNA proofreading deficiency; SBS10a and SBS10b), BERD (base excision repair deficiency; SBS18), chemotherapy (SBS25), and platinum treatment (SBS31, SBS35). The size of the circles reflecting the mutational signatures corresponds to the proportion of the signature in the sample. BoR, best of response; CIN, chromosomal instability; GC, gastric cancer; PD, progressive disease; SD, stable disease; PR, partial response.
Figure 1.
Study overview and genomic landscape of enrolled patients. A, Experimental design. We obtained fresh tumor tissues from patients with AGC before and after two cycles of first-line chemotherapy. Response to the chemotherapy was performed using RECIST1.1 criterion (B). Patient EP12 was known to have progressed but was lost to follow-up and was not considered evaluable. The mutational landscape was analyzed in patients with HER2-positive AGC (C) and HER2-negative AGC (D). The negative sign in C and D indicates unavailable PD-L1 expression status, and hollow rectangle represents negative for PD-L1 expression. We summarized somatic mutations in selected canonical oncogenes and tumor-suppressor genes in AGC. Whole exome–derived tumor mutational burden and mutational signatures of somatic mutations in HER2-positive AGC (E) and HER2-negative AGC (F). The signature of exonic somatic SBSs was delineated by COSMIC signatures, which were represented by the following terms: age (SBS1 and SBS5), APOBEC (apolipoprotein B mRNA editing enzyme; SBS2 and SBS13), UV (ultraviolet; SBS7a, SBS7b, SBS7c, and SBS7d), TMZ (temozolomide, SBS11), smoking (SBS4), immunoglobulin gene hypermutation (SBS9), HRD (homologous recombination deficiency; SBS3), MMRD (mismatch repair deficiency; SBS6, SBS15, SBS20, and SBS26), NERD (nucleotide excision repair deficiency; SBS8), DPD (DNA proofreading deficiency; SBS10a and SBS10b), BERD (base excision repair deficiency; SBS18), chemotherapy (SBS25), and platinum treatment (SBS31, SBS35). The size of the circles reflecting the mutational signatures corresponds to the proportion of the signature in the sample. BoR, best of response; CIN, chromosomal instability; GC, gastric cancer; PD, progressive disease; SD, stable disease; PR, partial response.
Figure 2. 5-FU and platinum remodel the TME in AGC. A, Immune score of pretreatment and on-treatment samples from patients with HER2-positive and HER2-negative AGC (left), and responders and nonresponders (right). Heat map of GSVA scores of representative pathways across pretreatment (n = 12) and on-treatment (n = 6) samples (B). We performed the Wilcoxon signed-rank test to assess the differences in G-scores between pretreatment and posttreatment samples, between HER2-positive and HER2-negative pretreatment samples, and between HER2-positive and HER2-negative posttreatment samples. The P values are illustrated on right side of the heat map using bar plots. EMT, epithelial–mesenchymal transition. C, Uniform manifold approximation and projection (UMAP) embedding of 18,911 cells (10,651 cells from pretreatment samples and 8,260 cells from posttreatment samples). Multiple clusters represent various cell types in the TME of AGC. D, Relative proportion of cell subtypes of pretreatment and on-treatment samples from patients with HER2-positive and HER2-negative AGC (left), and responders and nonresponders (right). Global cell types, T-cell, and myeloid subpopulations are illustrated in top, middle, and bottom plots, respectively. E, The RNA expression of genes involved in innate immune response and immunogenic cell death: ANXA1, HMGB1, CGAS, and STING. We estimated the expression using scRNA-seq of pretreatment and posttreatment samples from patients with HER2-positive and HER2-negative AGC. The box plots describe the median and interquartile range of the expression. The P values were estimated by the Wilcoxon signed-rank test.
Figure 2.
5-FU and platinum remodel the TME in AGC. A, Immune score of pretreatment and on-treatment samples from patients with HER2-positive and HER2-negative AGC (left), and responders and nonresponders (right). Heat map of GSVA scores of representative pathways across pretreatment (n = 12) and on-treatment (n = 6) samples (B). We performed the Wilcoxon signed-rank test to assess the differences in G-scores between pretreatment and posttreatment samples, between HER2-positive and HER2-negative pretreatment samples, and between HER2-positive and HER2-negative posttreatment samples. The P values are illustrated on right side of the heat map using bar plots. EMT, epithelial–mesenchymal transition. C, Uniform manifold approximation and projection (UMAP) embedding of 18,911 cells (10,651 cells from pretreatment samples and 8,260 cells from posttreatment samples). Multiple clusters represent various cell types in the TME of AGC. D, Relative proportion of cell subtypes of pretreatment and on-treatment samples from patients with HER2-positive and HER2-negative AGC (left), and responders and nonresponders (right). Global cell types, T-cell, and myeloid subpopulations are illustrated in top, middle, and bottom plots, respectively. E, The RNA expression of genes involved in innate immune response and immunogenic cell death: ANXA1, HMGB1, CGAS, and STING. We estimated the expression using scRNA-seq of pretreatment and posttreatment samples from patients with HER2-positive and HER2-negative AGC. The box plots describe the median and interquartile range of the expression. The P values were estimated by the Wilcoxon signed-rank test.
Figure 3. Transcriptional reprogramming of TAMs during first-line chemotherapy. A, UMAP embedding 1,902 myeloid cell population of scRNA-seq data. Multiple clusters represent various subtypes of myeloid cells in the TME of AGC. Bar plots demonstrating relative proportions of myeloid subtypes in pretreatment and posttreatment AGC samples (plot A inset). B, A volcano plot showing differentially expressed genes in scRNA-seq data between pretreatment and on-treatment samples. Genes marked in green and purple are related to M2 and M1 macrophage states, respectively. C, Differentially enriched pathways in macrophages between pretreatment and on-treatment samples from responder and nonresponder patients with AGC. Module scores were estimated using an algorithm embedded in Seurat package. Box plots describe the median and interquartile range of the expression. Significance of differences was estimated by the Wilcoxon signed-rank test. D, Pseudotime trajectories of macrophages demonstrating different developmental trajectory in pretreatment and on-treatment samples. We used the Slingshot algorithm to reconstruct the trajectories. Each dot represents a macrophage in pretreatment (blue) and posttreatment (red) samples. E, mIF images characterizing the TME of AGC before and during first-line chemotherapy in a representative case (EP-02) who showed PD-L1 upregulation and response to chemotherapy.
Figure 3.
Transcriptional reprogramming of TAMs during first-line chemotherapy. A, UMAP embedding 1,902 myeloid cell population of scRNA-seq data. Multiple clusters represent various subtypes of myeloid cells in the TME of AGC. Bar plots demonstrating relative proportions of myeloid subtypes in pretreatment and posttreatment AGC samples (plot A inset). B, A volcano plot showing differentially expressed genes in scRNA-seq data between pretreatment and on-treatment samples. Genes marked in green and purple are related to M2 and M1 macrophage states, respectively. C, Differentially enriched pathways in macrophages between pretreatment and on-treatment samples from responder and nonresponder patients with AGC. Module scores were estimated using an algorithm embedded in Seurat package. Box plots describe the median and interquartile range of the expression. Significance of differences was estimated by the Wilcoxon signed-rank test. D, Pseudotime trajectories of macrophages demonstrating different developmental trajectory in pretreatment and on-treatment samples. We used the Slingshot algorithm to reconstruct the trajectories. Each dot represents a macrophage in pretreatment (blue) and posttreatment (red) samples. E, mIF images characterizing the TME of AGC before and during first-line chemotherapy in a representative case (EP-02) who showed PD-L1 upregulation and response to chemotherapy.
Figure 4. Independent validation of TME remodeling during 5-FU/platinum chemotherapy. A, Heat map of GSVA scores of representative pathways across pretreatment and on-treatment samples. B, Heat map demonstrating changes in relative TME composition, including changes in TME subtype signatures. The negative sign indicates unavailable PD-L1 expression status. C, Sankey plot demonstrating a dynamic change of TME subtype between pretreatment and posttreatment samples. D and E, Activity of selected molecular functional portraits (D) in pretreatment TME of HER2-positive (n = 3) and HER2-negative (n = 14) tumors, and (E) in on-treatment compared with pretreatment samples. Th1, T helper 1 cell; Th2, T helper 2 cell; TCR, T-cell receptor; EMT, epithelial–mesenchymal transition; PR, partial response; SD, stable disease; PD, progressive disease.
Figure 4.
Independent validation of TME remodeling during 5-FU/platinum chemotherapy. A, Heat map of GSVA scores of representative pathways across pretreatment and on-treatment samples. B, Heat map demonstrating changes in relative TME composition, including changes in TME subtype signatures. The negative sign indicates unavailable PD-L1 expression status. C, Sankey plot demonstrating a dynamic change of TME subtype between pretreatment and posttreatment samples. D and E, Activity of selected molecular functional portraits (D) in pretreatment TME of HER2-positive (n = 3) and HER2-negative (n = 14) tumors, and (E) in on-treatment compared with pretreatment samples. Th1, T helper 1 cell; Th2, T helper 2 cell; TCR, T-cell receptor; EMT, epithelial–mesenchymal transition; PR, partial response; SD, stable disease; PD, progressive disease.
Figure 5. Profiling the TME of nonresponders identifies an increase in LAG3+ T cells. A, UMAP embedding T-cell subpopulations. Multiple clusters represent various subtypes of T cells in the TME of AGC. Bar plots demonstrating relative proportions of T-cell subtypes in pretreatment and posttreatment AGC samples (plot A inset). B, The bottom plot illustrates relative proportion of exhausted CD8 subpopulations in pretreatment and on-treatment samples from patients with MET-amplified AGC (left) and patients with AGC with wild-type MET (right). Top plot shows feature plots visualizing the presence of tumoral MET amplification (left) and the expression of TIGIT (right) in T-cell populations. C, A representative case of a patient with MET-amplified AGC (EP-07). The tumor did not radiographically respond to two cycles of XELOX in combination with pembrolizumab. Pie charts show proportion of exhausted CD8 T-cell subtypes in pretreatment and on-treatment samples. D and E, mIF images characterizing the TME of AGC before and during first-line chemotherapy in two representative nonresponders: EP-07 (D) and EP-08 (E). F, The expression profile of LAG3 in T-cell populations increases in nonresponders. LAG3 gene expression of T cells from scRNA-seq (top). Proportion of T cells expressing LAG3 in mIF (pie charts). LAG3 protein expression in mIF (bottom). The tumor volume of the on-treatment sample from EP-05 (annotated by asterisk) was relatively low to estimate LAG3 expression in mIF. WT, wild type; M, male; PD, progressive disease; PR, partial response.
Figure 5.
Profiling the TME of nonresponders identifies an increase in LAG3+ T cells. A, UMAP embedding T-cell subpopulations. Multiple clusters represent various subtypes of T cells in the TME of AGC. Bar plots demonstrating relative proportions of T-cell subtypes in pretreatment and posttreatment AGC samples (plot A inset). B, The bottom plot illustrates relative proportion of exhausted CD8 subpopulations in pretreatment and on-treatment samples from patients with MET-amplified AGC (left) and patients with AGC with wild-type MET (right). Top plot shows feature plots visualizing the presence of tumoral MET amplification (left) and the expression of TIGIT (right) in T-cell populations. C, A representative case of a patient with MET-amplified AGC (EP-07). The tumor did not radiographically respond to two cycles of XELOX in combination with pembrolizumab. Pie charts show proportion of exhausted CD8 T-cell subtypes in pretreatment and on-treatment samples. D and E, mIF images characterizing the TME of AGC before and during first-line chemotherapy in two representative nonresponders: EP-07 (D) and EP-08 (E). F, The expression profile of LAG3 in T-cell populations increases in nonresponders. LAG3 gene expression of T cells from scRNA-seq (top). Proportion of T cells expressing LAG3 in mIF (pie charts). LAG3 protein expression in mIF (bottom). The tumor volume of the on-treatment sample from EP-05 (annotated by asterisk) was relatively low to estimate LAG3 expression in mIF. WT, wild type; M, male; PD, progressive disease; PR, partial response.
Figure 6. Putative model underlying chemotherapy response in AGC. Patients with favorable TME remodeling may be primed for synergistic interactions between immune checkpoint inhibitor and chemotherapy. Response to first-line treatment was associated with chemotherapy-induced cell death of tumor cells and on-treatment remodeling of TME, including M1-macrophage repolarization and increased effector T-cell infiltration. In contrast, inability to repolarize M2 macrophages and upregulate PD-L1 expression, coupled with infiltration of LAG3-expressing T cells, may modulate resistance to chemotherapy. ICD, immunologic cell death.
Figure 6.
Putative model underlying chemotherapy response in AGC. Patients with favorable TME remodeling may be primed for synergistic interactions between immune checkpoint inhibitor and chemotherapy. Response to first-line treatment was associated with chemotherapy-induced cell death of tumor cells and on-treatment remodeling of TME, including M1-macrophage repolarization and increased effector T-cell infiltration. In contrast, inability to repolarize M2 macrophages and upregulate PD-L1 expression, coupled with infiltration of LAG3-expressing T cells, may modulate resistance to chemotherapy. ICD, immunologic cell death.

Comment in

  • Cancer Discov. 12:873.
  • Cancer Discov. 12:873.

References

    1. Bray F, Ferlay J, Soerjomataram I, Siegel RL, Torre LA, Jemal A. Global cancer statistics 2018: GLOBOCAN estimates of incidence and mortality worldwide for 36 cancers in 185 countries. CA Cancer J Clin 2018;68:394–424. - PubMed
    1. Ferlay J, Soerjomataram I, Dikshit R, Eser S, Mathers C, Rebelo Met al. . Cancer incidence and mortality worldwide: Sources, methods and major patterns in GLOBOCAN 2012. Int J Cancer 2015;136:E359–86. - PubMed
    1. Bang YJ, Van Cutsem E, Feyereislova A, Chung HC, Shen L, Sawaki Aet al. . Trastuzumab in combination with chemotherapy versus chemotherapy alone for treatment of HER2-positive advanced gastric or gastro-oesophageal junction cancer (ToGA): A phase 3, open-label, randomised controlled trial. Lancet 2010;376:687–97. - PubMed
    1. Cunningham D, Starling N, Rao S, Iveson T, Nicolson M, Coxon Fet al. . Capecitabine and oxaliplatin for advanced esophagogastric cancer. N Engl J Med 2008;358:36–46. - PubMed
    1. Koizumi W, Narahara H, Hara T, Takagane A, Akiya T, Takagi Met al. . S-1 plus cisplatin versus S-1 alone for first-line treatment of advanced gastric cancer (SPIRITS trial): A phase III trial. Lancet Oncol 2008;9:215–21. - PubMed

Publication types

MeSH terms