. 2021 Dec 28;118(52):e2113694118.
doi: 10.1073/pnas.2113694118.

Lipidome profiling with Raman microspectroscopy identifies macrophage response to surface topographies of implant materials

Affiliations

Lipidome profiling with Raman microspectroscopy identifies macrophage response to surface topographies of implant materials

Nora Feuerer et al. Proc Natl Acad Sci U S A. .

Abstract

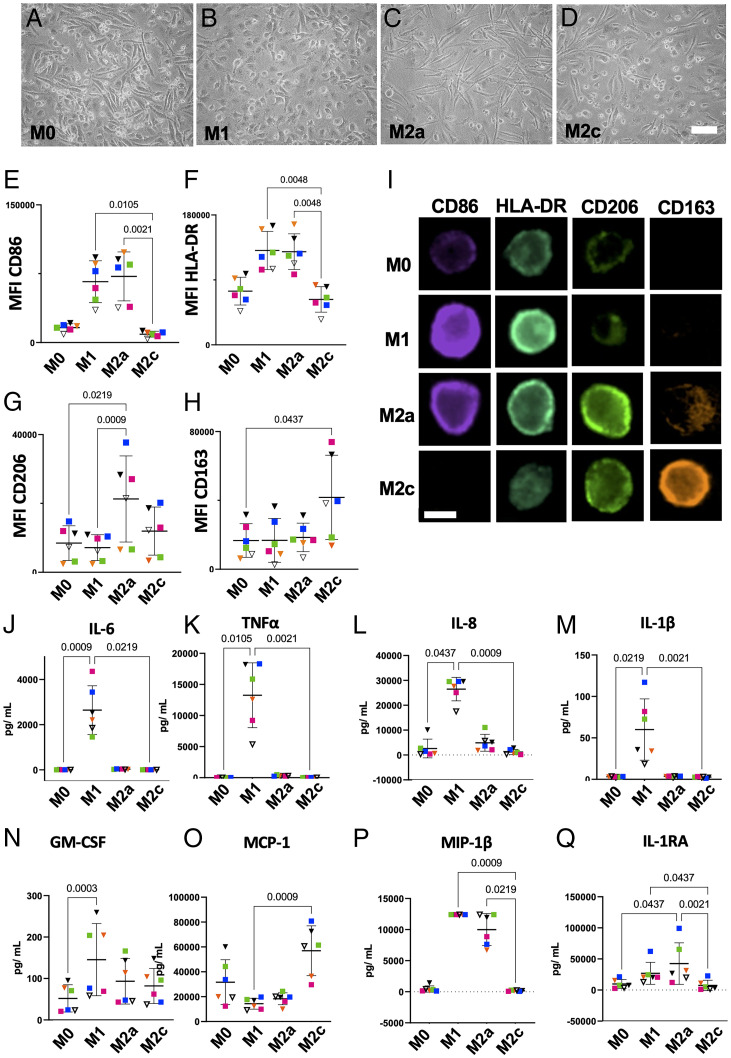
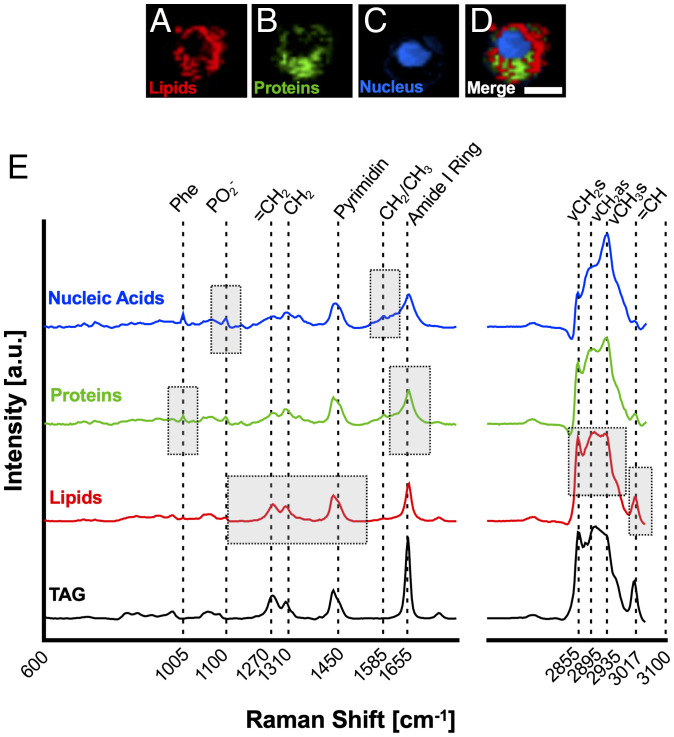
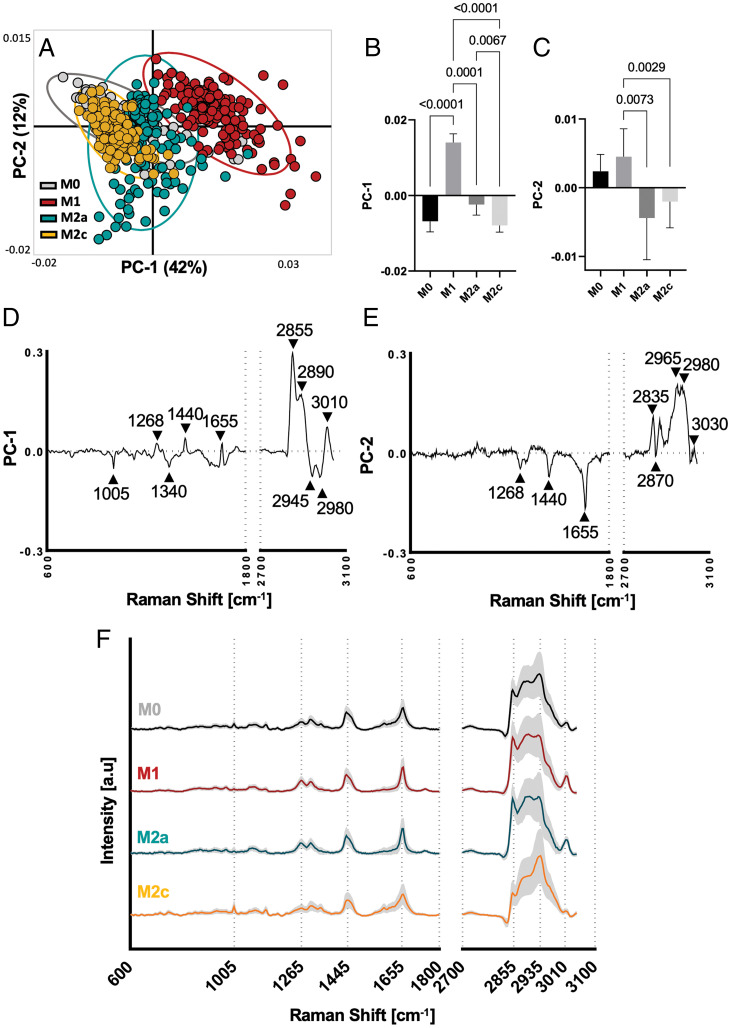
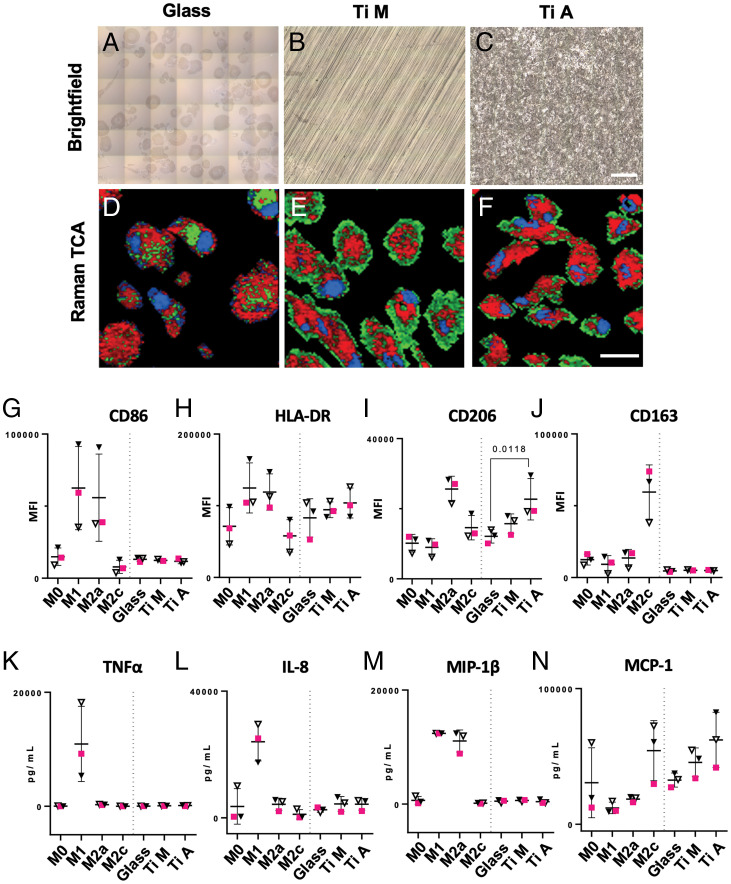
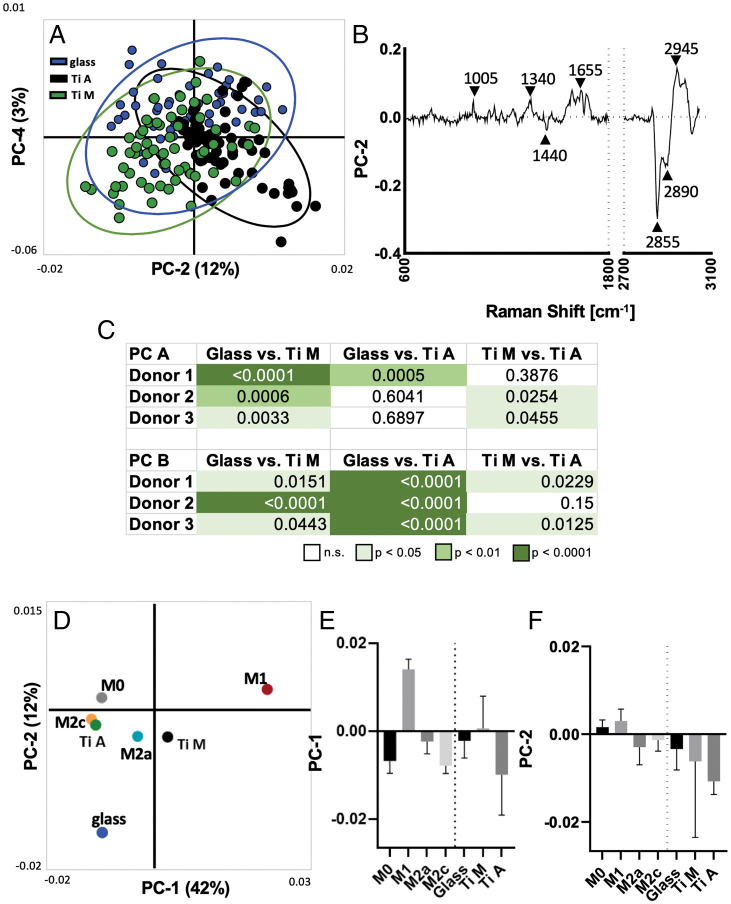
Biomaterial characteristics such as surface topographies have been shown to modulate macrophage phenotypes. The standard methodologies to measure macrophage response to biomaterials are marker-based and invasive. Raman microspectroscopy (RM) is a marker-independent, noninvasive technology that allows the analysis of living cells without the need for staining or processing. In the present study, we analyzed human monocyte-derived macrophages (MDMs) using RM, revealing that macrophage activation by lipopolysaccharides (LPS), interferons (IFN), or cytokines can be identified by lipid composition, which significantly differs in M0 (resting), M1 (IFN-γ/LPS), M2a (IL-4/IL-13), and M2c (IL-10) MDMs. To identify the impact of a biomaterial on MDM phenotype and polarization, we cultured macrophages on titanium disks with varying surface topographies and analyzed the adherent MDMs with RM. We detected surface topography-induced changes in MDM biochemistry and lipid composition that were not shown by less sensitive standard methods such as cytokine expression or surface antigen analysis. Our data suggest that RM may enable a more precise classification of macrophage activation and biomaterial-macrophage interaction.

Keywords: Raman imaging; Raman spectroscopy; biomaterials; innate immunity; macrophage polarization.


Conflict of interest statement

The authors declare no competing interest.

Figures

Fig. 1.
Fig. 1.
Polarized MDMs display distinct morphological and physiological characteristics. (AD) Brightfield images (10× magnification) show the morphology of polarized, human MDMs. (Scale bar, 50 µm.) (E–H) MFIs of polarization-associated surface antigens as measured by FC: CD86 (M1), HLA-DR (M1), CD206 (M2a), and CD163 (M2c). Data are presented as MFI ± SD. (I) ImageStream analyses provide representative immunofluorescence images of M0, M1, M2a, and M2c MDMs in suspension, stained for surface antigens CD86, HLA-DR, CD206, and CD163. (Scale bar, 20 µm.) (JQ) Expression of common immunity-mediating cytokines measured by multiplex bead sandwich assay (Luminex). Data are presented as mean ± SD. Statistical significance was assessed using the Friedman test and Dunn’s post hoc test (n = 6). Each donor has been assigned a unique color—male donors are indicated by squares and female donors by triangles.
Fig. 2.
Fig. 2.
Raman imaging resolves subcellular structures in MDMs. Identification of major cell component Raman signatures present in MDMs. (AD) False color heat maps of (A) lipids (red), (B) proteins (green), (C) nucleic acids (blue), and (D) merged as identified by TCA. (Scale bar, 10 µm.) (E) Spectral fingerprints of MDM components. Boxes represent spectral areas typically associated with the biochemical fingerprint of the respective cell component. Phe = Phenylalanin, ν = stretching, s = symmetric, as = asymmetric. A typical, in house–measured TAG spectrum is shown for comparison.
Fig. 3.
Fig. 3.
PCA of Raman lipid spectra identifies significant differences between polarized MDMs. (A) Scatter plot of PC-1 (42%) and PC-2 (12%) visualizes spatial clustering of MDM polarization (confidence ellipse = 95%; each dot represents a single cell). (B and C) Statistical analyses of scores from PC-1 and PC-2 reveal significant differences between all four subtypes; one way ANOVA and Tukey’s post hoc test, n = 6. (D and E) Loading plots describing major Raman peaks contribute to PCA separation. Peak assignments are listed in SI Appendix, Table 1. (F) Average lipid component Raman spectra of polarized MDMs with subtypes shown in black (M0), red (M1), blue (M2a), and yellow (M2c).
Fig. 4.
Fig. 4.
RM allows real-time in situ analysis of MDMs on biomaterial surfaces. Raman analysis of MDMs cultured on biomaterial surfaces: (AC) stitched brightfield images of glass, Ti M, and Ti A with MDMs adherent to the respective surface. (Scale bar, 100 µm.) (DF) Spectral components of RM measurements identified by TCA with lipids color coded in red, proteins in green, and nuclei in blue. (Scale bar, 20 µm.) Images were acquired at 63× magnification. (GJ) MFIs of MDM surface markers analyzed by FC. MFIs of surface markers from MDMs cultured on biomaterials were plotted in the same graph as data obtained by polarization experiments (M0 through M2c). (KN) Expression levels of four representative cytokines expressed by MDMs. The results were plotted in the same graph as data obtained by polarization experiments (M0 through M2c). Statistical analysis in graphs GN was performed by Friedman’s test and Dunn’s post hoc test, and only results for substrate-adherent MDMs are shown. Data are shown as mean ± SD. Male donors are indicated by squares and female donors by triangles.
Fig. 5.
Fig. 5.
RM lipid spectra can be used to distinguish substrate-adherent MDMs, and projected scores indicate proximity to polarization status. (A) Scatter plot of PC-2 (12%) and PC-4 (3%) visualizes spatial clustering of substrate-adherent MDMs (confidence ellipse = 95%; each dot represents a single cell). (B) Loading plot of PC-2 describes major Raman peaks contributing to PCA separation, comparable to those observed in polarized MDMs. (C) Statistical analysis of relevant components (PC A and PC B) reveal significant differences within single donors between substrates. (D) Projection of average substrate-adherent MDM scores into the PCA scores plot of the polarized MDMs. (E and F) Statistical comparison of mean score values ± SD. Only the projected scores were analyzed for significance using the Kruskal–Wallis and Dunn’s post hoc tests.

References

    1. Eming S. A., Wynn T. A., Martin P., Inflammation and metabolism in tissue repair and regeneration. Science 356, 1026–1030 (2017). - PubMed
    1. Ferrante C. J., Leibovich S. J., Regulation of macrophage polarization and wound healing. Adv. Wound Care (New Rochelle) 1, 10–16 (2012). - PMC - PubMed
    1. Lech M., Anders H.-J., Macrophages and fibrosis: How resident and infiltrating mononuclear phagocytes orchestrate all phases of tissue injury and repair. Biochim. Biophys. Acta 1832, 989–997 (2013). - PubMed
    1. Godwin J. W., Rosenthal N., Scar-free wound healing and regeneration in amphibians: Immunological influences on regenerative success. Differentiation 87, 66–75 (2014). - PubMed
    1. Godwin J. W., Pinto A. R., Rosenthal N. A., Macrophages are required for adult salamander limb regeneration. Proc. Natl. Acad. Sci. U.S.A. 110, 9415–9420 (2013). - PMC - PubMed

Publication types

LinkOut - more resources