. 2021 Dec 21;11(1):24373.
doi: 10.1038/s41598-021-03779-7.

Differential analysis of the bacterial community in colostrum samples from women with gestational diabetes mellitus and obesity

Affiliations

Differential analysis of the bacterial community in colostrum samples from women with gestational diabetes mellitus and obesity

J S Gámez-Valdez et al. Sci Rep. .

Abstract

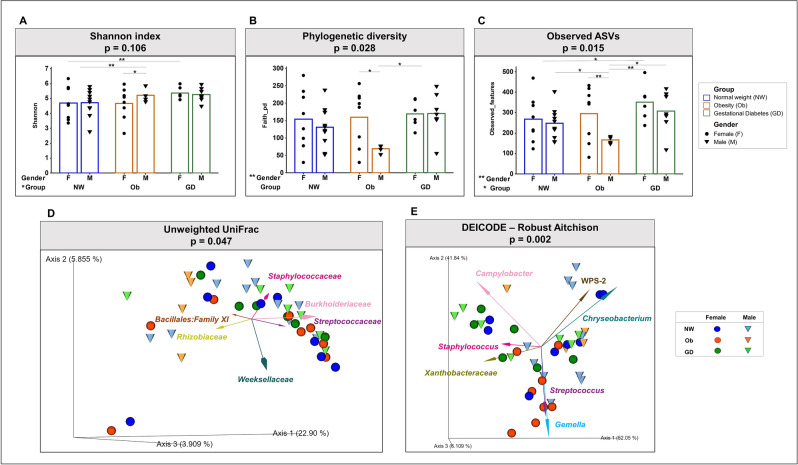
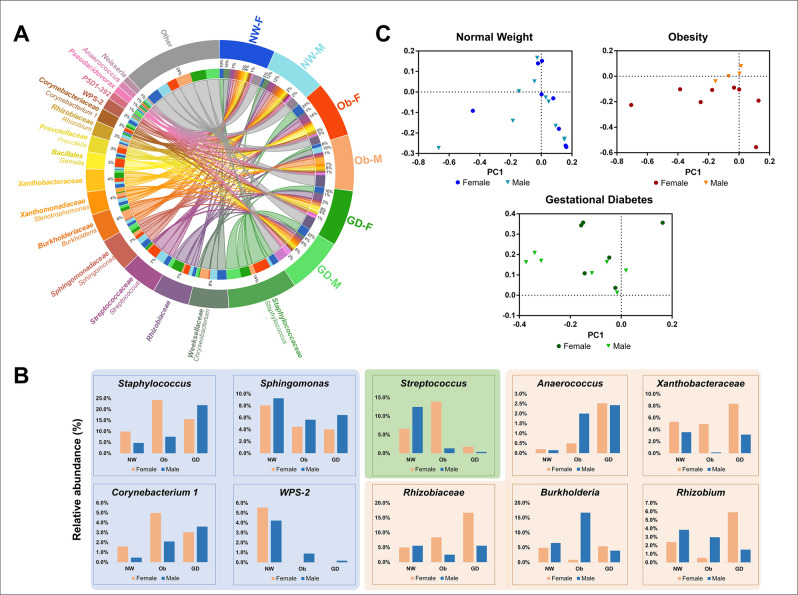
Gestational Diabetes Mellitus (GDM) and obesity affect the functioning of multiple maternal systems and influence colonization of the newborn gastrointestinal through the breastmilk microbiota (BMM). It is currently unclear how GDM and obesity affect the human BMM composition. Here, we applied 16S-rRNA high-throughput sequencing to human colostrum milk to characterize BMM taxonomic changes in a cohort of 43 individuals classified in six subgroups according to mothers patho-physiological conditions (healthy control (n = 18), GDM (n = 13), or obesity (n = 12)) and newborn gender. Using various diversity indicators, including Shannon/Faith phylogenetic index and UniFrac/robust Aitchison distances, we evidenced that BMM composition was influenced by the infant gender in the obesity subgroup. In addition, the GDM group presented higher microbial diversity compared to the control group. Staphylococcus, Corynebacterium 1, Anaerococcus and Prevotella were overrepresented in colostrum from women with either obesity or GDM, compared to control samples. Finally, Rhodobacteraceae was distinct for GDM and 5 families (Bdellovibrionaceae, Halomonadaceae, Shewanellaceae, Saccharimonadales and Vibrionaceae) were distinct for obesity subgroups with an absolute effect size greater than 1 and a q-value ≤ 0.05. This study represents the first effort to describe the impact of maternal GDM and obesity on BMM.


Conflict of interest statement

The authors declare no competing interests.

Figures

Figure 1
Figure 1
Bacterial diversity of colostrum samples. (A) Taxonomic profile at family level divided by study subgroups (maternal health condition and sex of the newborn). (B) Rarefaction curves from subgroups of colostrum samples relating the sequencing depth and the estimated number of bacteria. ASVs amplicon sequence variants, NW-F healthy normal weight-female (n = 8), NW-M healthy normal weight-male (n = 10), Ob-F obesity positive GDM negative-female (n = 8), Ob-M obesity positive GDM negative-male (n = 4), GD-F GDM positive obesity negative-female baby (n = 6), GD-M GDM positive obesity negative-male baby (n = 7).
Figure 2
Figure 2
Alpha and beta diversity indexes of colostrum (AC) Alpha diversity. (D, E) Beta diversity. (A) Shannon index. (B) Number of observed ASVs. (C) Phylogenetic diversity. All of the Alpha indexes showed significant differences after a general linear model (glm) with a confidence level of 95% (p ≤ 0.05). The Fisher test was implemented for comparisons. Graphs were plotted using GraphPad Prism version 6.0.0, GraphPad Software, San Diego, California USA (www.graphpad.com). (D) Unweighted principal coordinate analysis (PCoA) biplot of UniFrac distances with vectors at family level. (E) Robust principal component analysis (RPCA) biplot using DEICODE (robust Aitchison). Beta diversity distance matrices were generated and analyzed in the QIIME2 platform. Beta indexes showed significant differences after being assessed by permutational ANOVA (999 permutations). *p ≤ 0.10; **p ≤ 0.05. Plots were visualized using the QIIME2 plugin Emperor.
Figure 3
Figure 3
Colostrum taxonomic profile at genera level. (A) CIRCOS representation of the most abundant genera amongst healthy, obesity and GDM subgroups. “Other” represents all the taxa with less than 1% of total abundance. Circos plot was created with Circa (http://omgenomics.com/circa). (B) Relative abundance of the genera that differ by group. (C) Principal Component Analysis (PCA) of the difference in taxa by newborn’s sex in each experimental group. In all cases the first two components (contribution ≥ 80% of variance) were plotted using GraphPad Prism version 6.0.0, GraphPad Software, San Diego, California USA (www.graphpad.com). NW-F healthy normal weight-female, NW-M healthy normal weight-male, Ob-F obesity positive GDM negative-female, Ob-M obesity positive GDM negative-male, GD-F GDM positive obesity negative-female baby, GD-M GDM positive obesity negative-male baby.
Figure 4
Figure 4
Differential bacteria at family level between subgroups. Each panel shows a plot illustrating differentially abundant taxon for each comparison and their median difference of centered log-ratio (clr) transformation, which indicates the dimension of the difference in abundance. Taxa with bold letters represent members of the core microbiota. Dots in the plot represent the median difference of significant features after a Welch’s t test (adjusted p-value ≤ 0.10) and effect size ≥ 1. Dots are colored according to the subgroup that contains the greater fraction. (A) Comparison of GDM-female versus healthy-female. (B) Comparison of healthy-male versus obesity-male. (C) Comparison of obesity-female versus obese-male. *q ≤ 0.10; **q ≤ 0.05.
Figure 5
Figure 5
LEfSe analysis of the colostrum’s functional profiling prediction between subgroups. A significance p-value ≤ 0.05 and an effect size threshold of 3.5 were used for all Metacyc pathways evaluated. Graphic was generated in MicrobiomeAnalyst web-based platform. NW-F healthy normal weight-female, NW-M healthy normal weight-male, Ob-F obesity positive GDM negative-female, Ob-M obesity positive GDM negative-male, GD-F GDM positive obesity negative-female baby, GD-M GDM positive obesity negative-male.

References

    1. van den Elsen LWJ, Garssen J, Burcelin R, Verhasselt V. Shaping the gut microbiota by breastfeeding: The gateway to allergy prevention? Front. Pediatr. 2019;7:47. - PMC - PubMed
    1. Zheng D, Liwinski T, Elinav E. Interaction between microbiota and immunity in health and disease. Cell Res. 2020;30:492–506. - PMC - PubMed
    1. Zhuang L, et al. Intestinal microbiota in early life and its implications on childhood health. Genom. Proteom. Bioinform. 2019;17:13–25. - PMC - PubMed
    1. Lisboa PC, Miranda RA, Souza LL, Moura EG. Can breastfeeding affect the rest of our life? Neuropharmacology. 2021 doi: 10.1016/j.neuropharm.2021.108821. - DOI - PubMed
    1. Moossavi S, et al. Composition and variation of the human milk microbiota are influenced by maternal and early-life factors. Cell Host Microbe. 2019;25:324–335.e4. - PubMed

Publication types