. 2022 Jan;18(1):64-69.
doi: 10.1038/s41589-021-00922-3. Epub 2021 Dec 21.

Mandipropamid as a chemical inducer of proximity for in vivo applications

Affiliations

Mandipropamid as a chemical inducer of proximity for in vivo applications

Michael J Ziegler et al. Nat Chem Biol. 2022 Jan.

Abstract

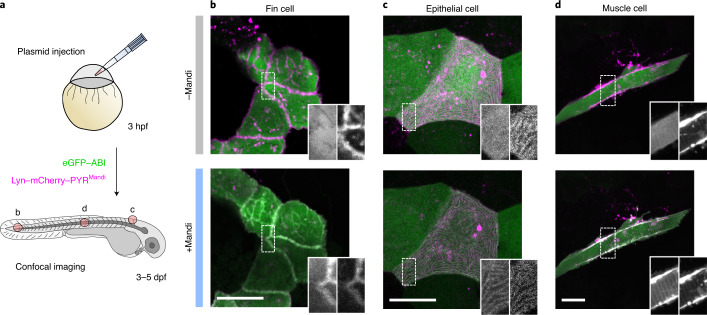
Direct control of protein interactions by chemically induced protein proximity holds great potential for both cell and synthetic biology as well as therapeutic applications. Low toxicity, orthogonality and excellent cell permeability are important criteria for chemical inducers of proximity (CIPs), in particular for in vivo applications. Here, we present the use of the agrochemical mandipropamid (Mandi) as a highly efficient CIP in cell culture systems and living organisms. Mandi specifically induces complex formation between a sixfold mutant of the plant hormone receptor pyrabactin resistance 1 (PYR1) and abscisic acid insensitive (ABI). It is orthogonal to other plant hormone-based CIPs and rapamycin-based CIP systems. We demonstrate the applicability of the Mandi system for rapid and efficient protein translocation in mammalian cells and zebrafish embryos, protein network shuttling and manipulation of endogenous proteins.


Conflict of interest statement

The authors declare no competing interests.

Figures

Fig. 1
Fig. 1. Mandi, a new CIP.
a, Chemically induced protein proximity to control interactions between proteins of interest A and B. b, Chemical structure of Mandi. c, Live-cell confocal microscopy of COS-7 cells cotransfected with pLYN-mCherry-PYRMandi and enhanced green fluorescent protein peGFP-ABI before and 2 min after Mandi addition (100 nM); data are representative of seven cells. d, Live-cell confocal microscopy of COS-7 cells transfected with pvimentin-mNeonGreen-PYRMandi-IRES-Halo-ABI and labeled with HaloTag ligand-SiR (HTL-SiR). Images were acquired before and 5 min after Mandi addition (50 nM); data are representative of 20 cells. The scale bars in c and d represent 10 µm. See Extended Data Fig. 2 for single-channel images.
Fig. 2
Fig. 2. Quantitative comparison of the new Mandi system with existing CIP systems.
a, Chemical structure of different CIP systems and their respective receptor and receiver domains. b, Single-cell translocation kinetics of the cytosolic receiver domain to the receptor domain localized on mitochondria. Trajectories were normalized to ratios before CIP addition and after translocation was completed. Data represent mean (line) ± s.d. (shaded region). See Supplementary Table 2 for number of cells and experiments. CIPs were injected at a 5 µM final concentration at t = 0 s. The translocation time, t0.75, is indicated by the dashed line. See Supplementary Fig. 4 for single-cell translocation trajectories and Supplementary Fig. 5 for averaged trajectories from experiments with reduced Mandi concentrations. c,d, Translocation times for different CIPs and CIP concentrations. Small symbols represent individual cells, and large symbols represent means from experiments. See Supplementary Table 2 for the number of cells and experiments for each condition. The means ± s.d. across experiments are indicated by error bars. e, Dose–response (median ± s.d.) of ABA- or Mandi-induced luciferase expression in COS-7 cells after 24 h of incubation. Four (7) samples from three (4) independent experiments for Mandi (ABA-AM). f, Binding efficiencies from RSICS experiments before and after CIP addition at a 500 nM final concentration. Lines indicate mean ± s.d., and symbols are as described in c. Conditions were compared using a two-sided unpaired t-test with Welch’s correction. Source data
Fig. 3
Fig. 3. Protein translocation in living zebrafish embryos.
a, Schematic illustration of workflow for in vivo application in zebrafish embryos. Fertilized eggs were injected with vectors for LYN–mCherry–PYRMandi or TOM20–mCherry–PYRMandi and eGFP–ABI expression, resulting in mosaic expression of target proteins at 3–5 dpf. bd, Confocal microscopy images of different cell types (fin cells (b), epithelial cells (c) and muscle cells (d)) in living zebrafish embryos expressing receiver and plasma membrane-localized receptor domains before and 10–20 min after addition of 500 nM Mandi are shown. Data are representative of ≥three independent experiments for each cell type; scale bar, 40 µm.
Fig. 4
Fig. 4. Reversible and dynamic protein shuttling in living cells.
a, Schematic illustration of the four-step procedure to shuttle cytosolic protein between different intracellular targets. b, Confocal fluorescence microscopy images of the shuttling process between vimentin and mitochondria in a living cell. COS-7 cells were cotransfected with vimentin-mNeonGreen-PYRMandi-IRES-Halo-ABI and TOM20-SNAPf-PYL. Halo–ABI and SNAPf–PYL were labeled with HTL-SiR and tetramethylrhodamine (TMR)-Star, respectively. The top row shows dynamic receiver localization, and the middle row shows receptor localizations as references. Split images depict vimentin and mitochondrial localization in two different channels. The bottom row shows respective merges. Images were acquired at the indicated times before and after the addition of ABA-AM (200 nM), after the addition of revABA (20 μM) and after the addition of Mandi (200 nM); scale bar 20 µm. Data are representative of 22 cells from two independent experiments. c, Pearson correlation coefficients (PCC; mean ± s.d.) between receiver and respective receptor channel images at the indicated time points for four-step shuttling between cytosol, mitochondria and vimentin as shown in b. Small symbols represent individual cells at the indicated time points. In the inset, conditions were compared with a two-sided paired t-test. Source data
Extended Data Fig. 1
Extended Data Fig. 1. Crystal structures of CIP-bound receptor-receiver complexes for abscisic acid and mandipropamid.
PYR1-HAB1 complex bound by ABA. b, Molecular structure of (+)-abscisic acid. c, PYR1(K59R/V81I/F108A/F159L)-HAB1 complex bound by mandipropamid. No crystal structure for hextuple mutant PYRMandi is available to date. d, Molecular structure of mandipropamid (Mandi). Crystal structures obtained from pdb entries 3JRQ and 4WVO and based on previous reports in the literature,.
Extended Data Fig. 2
Extended Data Fig. 2. Mandi-induced protein translocation to different subcellular targets.
Live-cell fluorescence microscopy of COS-7 cells transiently transfected with receiver domains targeted to subcellular targets and cytosolic receiver domain. Images were acquired by epi- (a) or confocal (b-d) fluorescence microscopy before and 2 min (c) or 5 min (a,b,d) after addition of Mandi at indicated final concentrations. Transfection with pTOM20-mCherry-PYRMandi-IRES-EGFP-ABI (a), pKeratin-mNeonGreen-PYRMandi-IRES-Halo-ABI (b), pLYN-mCherry-PYRMandi and peGFP-ABI (c), Vimentin-mNeonGreen-PYRMandi-IRES-Halo-ABI (d). Halo-ABI was labeled with HTL-SiR. Scale bars 20 µm. Representative data for 6–20 cells in 1–2 independent experiments.
Extended Data Fig. 3
Extended Data Fig. 3. Quantitative characterization of Mandi via control of transcriptional activation and RICS.
a, Schematic illustration of CIP-induced luciferase expression related to Fig. 2e. b, Representative cross-correlation functions of YFP and mCherry signal in COS-7 cells transiently transfected with indicated constructs. Left: negative (YFP + mCherry) and positive (YFP-mCherry fusion) controls. Right: mCherry-ABI vs. YFP-PYRMandi before (top) and after (bottom) addition of 500 nM Mandi. Binding efficiency for shown mCherry-ABI vs. YFP-PYRMandi after Mandi addition cross-correlation: 73%.
Extended Data Fig. 4
Extended Data Fig. 4. Chemically induced reconstitution of split proteases.
a, Schematic illustration of CIP induced reconstitution of TEV protease followed by proteolytic activation of cyclic Luciferase. b, Normalized enhancement of cLuc activity induced by proteolytic activation at different Mandi concentrations. Box extends from 25th to 75th percentiles, whiskers from min to max, bar represents median. Conditions were compared using two-sided unpaired t-test with Welch’s correction. Representative data from one experiment of two independent experiments. Source data
Extended Data Fig. 5
Extended Data Fig. 5. Confocal fluorescence microscopy images of protein colocalization on different cell types in living zebrafish embryos.
Cytosolic receiver and mitochondria localized receptor domains expressed in zebrafish embryos. a, epithelial cell b, muscle cell. Images acquired before and 10–20 min after addition of Mandi. Scale bar 40 µm. Data representative for 3 independent experiments.
Extended Data Fig. 6
Extended Data Fig. 6. Nanobody assisted targeting of chemically induced protein proximity.
a, Schematic illustration (a) of nanobody assisted targeting of chemically induced protein proximity. b, HeLa cells stably expressing LifeAct-GFP were transfected with antiGFP-nanobody-PYRMandi and mCherry-ABI fusions. Confocal images acquired before and 5 min after addition of Mandi. Pearson’s correlation coefficients indicated in images. Representative data for 30 cells in 2 independent experiments. Scale bar: 20 µm. c, Line profiles of GFP and mCherry signal intensity in ROI (yellow box) before and after addition of Mandi. Source data
Extended Data Fig. 7
Extended Data Fig. 7. RSICS measurements of Mandi CIP system.
a, Schematic of RSICS in the ARICS framework. A 256×256 pixel image stack of 300–400 frames acquired in 23 spectral channels is decomposed into three three-dimensional image stacks for GFP (G), YFP (Y) and mCherry (Ch), using a spectral filtering algorithm. An arbitrary ROI delimiting a homogeneous region in the cytoplasm is selected and RSICS analysis is applied to each frame of each image stack. b,c CCFs in the three cross-correlation channels obtained from three-color RSICS measurement on COS-7 cells co-expressing EGFP-PYL, YFP-PYRMandi and mCherry-ABI performed 15 min after incubation with 5 µM ABA-AM (b) or 5 µM Mandi (c). d, Binding efficiencies for the Mandi/ABA CIP systems in the presence of 5 µM ABA-AM or 5 µM Mandi. For comparison, the binding efficiencies obtained in the negative (neg.) and positive (pos.) cross-correlation control samples are shown. Small symbols: individual data points corresponding to RSICS measurement in a single cell. Large symbols: means from experiments. Mean±SD across experiments indicated by horizontal lines. Data pooled from two independent experiments with 13 (neg.), 18 (ABA-AM), 19 (Mandi) and 16 (pos.) cells. e, Binding efficiency of PYRMandi vs. mCherry-ABI in the presence of 200 nM ABA-AM measured by two-color RSICS. For comparison, the binding efficiencies obtained in the negative (neg.) and positive (pos.) cross-correlation control samples measured under identical conditions are shown. Mean±SD across experiments indicated by horizontal lines. Data pooled from 2 (neg, pos) or 3 (ABA-AM) independent experiments with 28 (AB-AM), 10 (neg) and 20 (pos) cells.
Extended Data Fig. 8
Extended Data Fig. 8. Reversible and dynamic protein shuttling between mitochondria and keratin in living cells.
COS-7 cells were co-transfected with Keratin-mNeonGreen-PYRMandi-IRES-Halo-ABI and TOM20-SNAPf-PYL. Halo- and SNAP-tag domains were stained with HTL-SiR and TMR-Star 2 h prior to imaging. a, Representative confocal fluorescence microscopy images of four-step shuttling between cytosol, mitochondria and keratin over time. Upper row shows dynamic receiver localization, middle row receptor localizations as references, lower row respective merges. Images acquired at t0, 10 min after addition of ABA-AM (200 nM), 25 min after addition of revABA (20 μM), 10 min after addition of Mandi (200 nM). Scale bar 20 µm. b, Pearson correlation coefficients (PCC) between images receiver and respective receptor channel images at indicated time points for four-step shuttling between cytosol, mitochondria and keratin as shown in (a). 4 cells from 1 experiment. Mean±SD across all cells indicated by dark circles and error bars. Source data

References

    1. Stanton BZ, Chory EJ, Crabtree GR. Chemically induced proximity in biology and medicine. Science. 2018;359:eaao5902. - PMC - PubMed
    1. Spencer D, Wandless T, Schreiber S, Crabtree G. Controlling signal transduction with synthetic ligands. Science. 1993;262:1019–1024. - PubMed
    1. Holsinger LJ, Spencer DM, Austin DJ, Schreiber SL, Crabtree GR. Signal transduction in T lymphocytes using a conditional allele of Sos. Proc. Natl Acad. Sci. USA. 1995;92:9810–9814. - PMC - PubMed
    1. Pruschy MN, et al. Mechanistic studies of a signaling pathway activated by the organic dimerizer FK1012. Chem. Biol. 1994;1:163–172. - PubMed
    1. Klemm JD, Beals CR, Crabtree GR. Rapid targeting of nuclear proteins to the cytoplasm. Curr. Biol. 1997;7:638–644. - PubMed

Publication types