. 2021 Dec 16;8(1):e1271.
doi: 10.1097/TXD.0000000000001271. eCollection 2022 Jan.

Development and Application of a Semi quantitative Scoring Method for Ultrastructural Assessment of Acute Stress in Pancreatic Islets

Affiliations

Development and Application of a Semi quantitative Scoring Method for Ultrastructural Assessment of Acute Stress in Pancreatic Islets

Nicola J Dyson et al. Transplant Direct. .

Abstract

Background: Pancreas and islet transplantation outcomes are negatively impacted by injury to the endocrine cells from acute stress during donor death, organ procurement, processing, and transplant procedures. Here, we report a novel electron microscopy scoring system, the Newcastle Pancreas Endocrine Stress Score (NPESS).

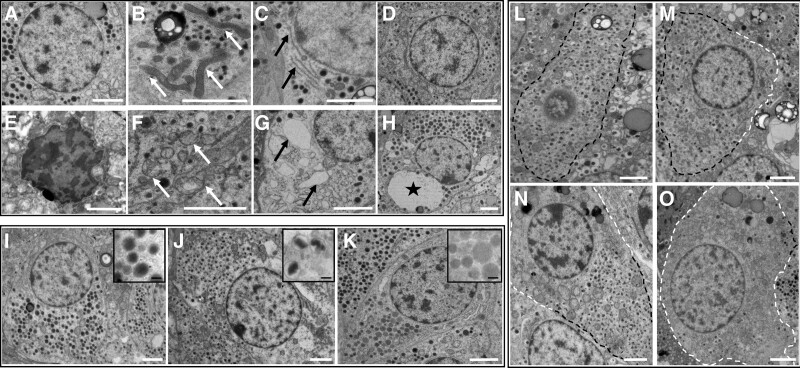
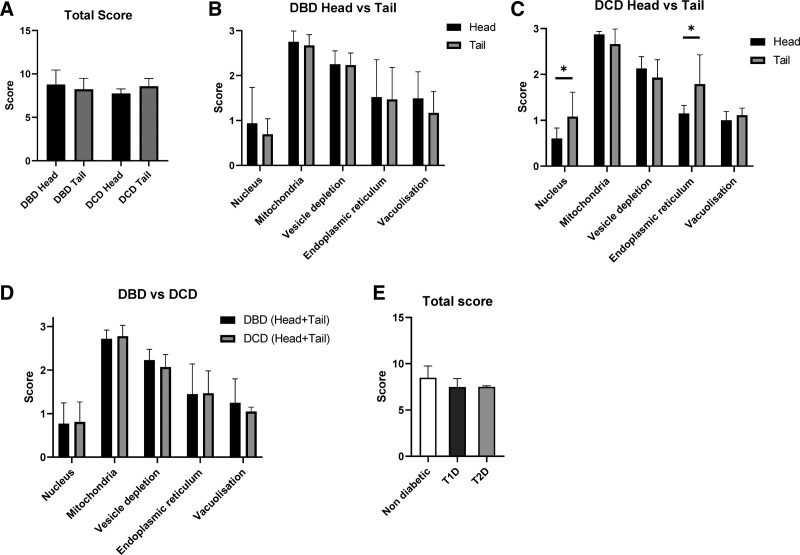
Methods: NPESS was adapted and expanded from our previously validated method for scoring pancreatic exocrine acinar cells, yielding a 4-point scale (0-3) classifying ultrastructural pathology in endocrine cell nuclei, mitochondria, endoplasmic reticulum, cytoplasmic vacuolization, and secretory granule depletion, with a maximum additive score of 15. We applied NPESS in a cohort of deceased organ donors after brainstem (DBD) and circulatory (DCD) death with a wide range of cold ischemic times (3.6-35.9 h) including 3 donors with type 1 and 3 with type 2 diabetes to assess islets in situ (n = 30) in addition to pancreata (n = 3) pre- and postislet isolation.

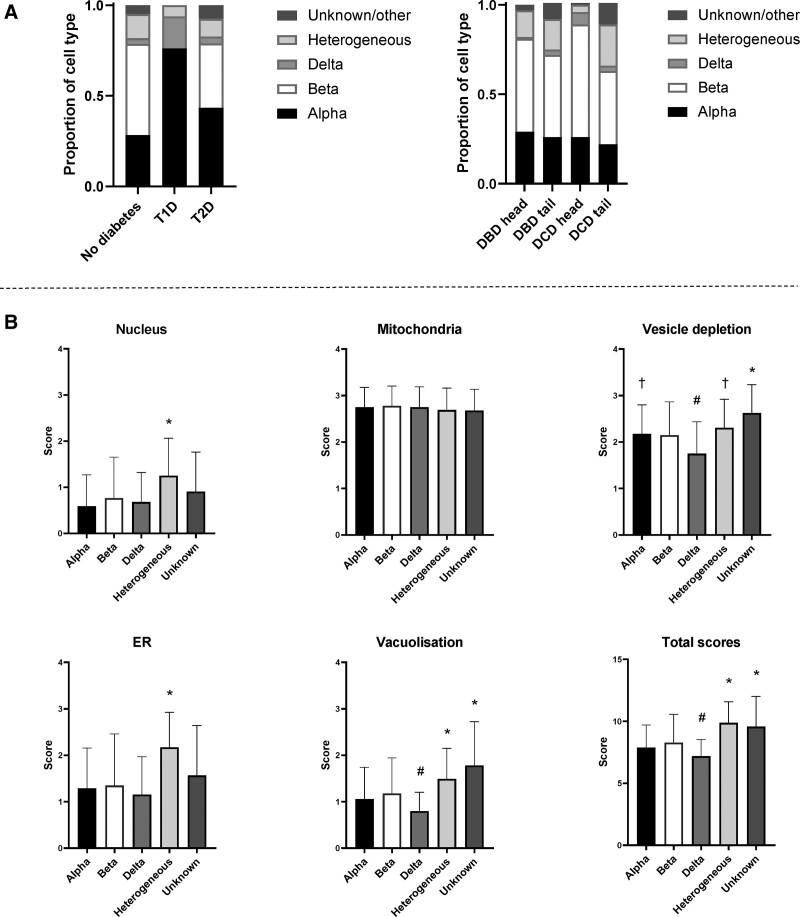
Results: In DBD pancreata, NPESS correlated with cold ischemic time (head: r = 0.55; P = 0.02) and mirrored exocrine score (r = 0.48; P = 0.01). When stratified by endocrine phenotype, cells with granules of heterogeneous morphology had higher scores than α, β, and δ cells (P < 0.0001). Cells of mixed endocrine-exocrine morphology were observed in association with increased NPESS (P = 0.02). Islet isolation was associated with improved NPESS (in situ: 8.39 ± 0.77 [Mean ± SD]; postisolation: 5.44 ± 0.31; P = 0.04).

Conclusions: NPESS provides a robust method for semiquantitative scoring of subcellular ultrastructural changes in human pancreatic endocrine cells in situ and following islet isolation with utility for unbiased evaluation of acute stress in organ transplantation research.


Figures

FIGURE 1.
FIGURE 1.
Representative TEM images of endocrine cells. A–D, These images show normal morphology of cells and organelles. E–H, These show example images of acute stress. Nucleus (A, E), mitochondria (B, F, white arrows), endoplasmic reticulum (C, G, black arrows), vacuolization (D, cell with no vacuolization present) (H, black star indicates large vacuole). Cells in A, C, G, and H are α cells; cells in B, D, E, and F are β cells. I–K, Representative images of endocrine cell types: I, α cell; J, β cell; K, δ cell. Inset boxes show the morphology of the respective endocrine granules. Vesicle depletion is scored according to the loss of endocrine granules at cell membranes: L, score 0; M, score 1; N, score 2; O, score 3. Black dashed line indicates area with vesicles; white dashed line indicates depleted area. All cells in L through O are β cells. White scale bars: 2 µm. Black scale bars: 200 nm. TEM, transmission electron microscopy.
FIGURE 2.
FIGURE 2.
Comparison of NPESS between head and tail of pancreas in DBD and DCD donors and by diabetes status. A, Total NPESS in DBD head/tail and DCD head/tail. B, NPESS subscores in head (n = 10) and tail (n = 17) of pancreas in DBD donors. C, NPESS subscores in head (n = 8) and tail (n = 6) of pancreas in DCD donors. D, Total (head + tail) NPESS in DBD (n = 21) versus DCD (n = 9) donors. E, Total score in donors without established diabetes (n = 21), T1D (n = 3), and T2D (n = 3). Bars represent mean ± SD (*P < 0.05). DBD, donors after brainstem death; DCD, donors after circulatory death; NPESS, Newcastle Pancreas Endocrine Stress Score.
FIGURE 3.
FIGURE 3.
Comparison between NPESS and cold ischemia time. Scores in DBD donors (black circles) and DCD donors (white circles) are plotted against CIT in pancreas head (A) and pancreas tail (B). Donors with T1D and T2D are represented by squares and triangles, respectively. CIT, cold ischemia time; DBD, donors after brainstem death; DCD, donors after circulatory death; NPESS, Newcastle Pancreas Endocrine Stress Score.
FIGURE 4.
FIGURE 4.
Correlations of NPESS (endocrine) scores with NPASS (exocrine) scores. NPASS is plotted against NPESS for each specimen analyzed, with pancreas head and pancreas tail denoted by black and white symbols, respectively. Correlation plots are shown for individual organelle and total scores in DBD (A) and DCD donors (B). Donors with T1D and T2D are represented by squares and triangles, respectively. DBD, donors after brainstem death; DCD, donors after circulatory death; NPASS, Newcastle Pancreatic Acinar Stress Score.; NPESS, Newcastle Pancreas Endocrine Stress Score.
FIGURE 5.
FIGURE 5.
Analysis of individual endocrine phenotypes. A, Overall proportions of individual cell types in the cohort, stratified by diabetes status, donor type, and pancreas region. B, NPESS scores for individual cells stratified by cell type. Bars represent mean ± SD. *P < 0.05 versus α-, β-, and δ cells. #P < 0.05 versus β cells. †P < 0.05 versus δ cells. n = 316 (α), n = 369 (β), n = 44 (δ), n = 124 (heterogeneous), and n = 32 (other/unknown). ER, endoplasmic reticulum; NPESS, Newcastle Pancreas Endocrine Stress Score.
FIGURE 6.
FIGURE 6.
Isolated islets have a reduced stress phenotype when compared with matched preisolation islets in situ. Scores for individual organelles and total scores of preisolation tissue and islets at day 0 and day 1 in culture from 3 donor organs are shown. D0 islets were sampled 1 to 2 h after being placed in culture; D1 islets were sampled 12 to 18 h after being placed in culture. *P < 0.05, **P < 0.01. ER, endoplasmic reticulum.

References

    1. Atkinson MA, Eisenbarth GS, Michels AW. Type 1 diabetes. Lancet. 2014;383:69–82. - PMC - PubMed
    1. Hudson A, Bradbury L, Johnson R, et al. . The UK pancreas allocation scheme for whole organ and islet transplantation. Am J Transplant. 2015;15:2443–2455. - PubMed
    1. Vantyghem MC, de Koning EJP, Pattou F, et al. . Advances in β-cell replacement therapy for the treatment of type 1 diabetes. Lancet. 2019;394:1274–1285. - PMC - PubMed
    1. White SA, Shaw JA, Sutherland DE. Pancreas transplantation. Lancet. 2009;373:1808–1817. - PubMed
    1. Shapiro AM, Ricordi C, Hering BJ, et al. . International trial of the Edmonton protocol for islet transplantation. N Engl J Med. 2006;355:1318–1330. - PubMed