

An Evaluation of Antimicrobial Prescribing and Risk-adjusted Mortality
- PMID: 34934871
- PMCID: PMC8678007
- DOI: 10.1097/pq9.0000000000000481
An Evaluation of Antimicrobial Prescribing and Risk-adjusted Mortality
Abstract
The Centers for Disease Control and Prevention recommends tracking risk-adjusted antimicrobial prescribing. Prior studies have used prescribing variation to drive quality improvement initiatives without adjusting for severity of illness. The present study aimed to determine the relationship between antimicrobial prescribing and risk-adjusted ICU mortality in the Pediatric Health Information Systems (PHIS) database, assessed by IBM-Watson risk of mortality. A nested analysis sought to assess an alternative risk model incorporating laboratory data from federated electronic health records.
Methods: Retrospective cohort study of pediatric ICU patients in PHIS between 1/1/2010 and 12/31/2019, excluding patients admitted to a neonatal ICU, and a nested study of PHIS+ from 1/1/2010 to 12/31/2012. Hospital antimicrobial prescription volumes were assessed for association with risk-adjusted mortality.
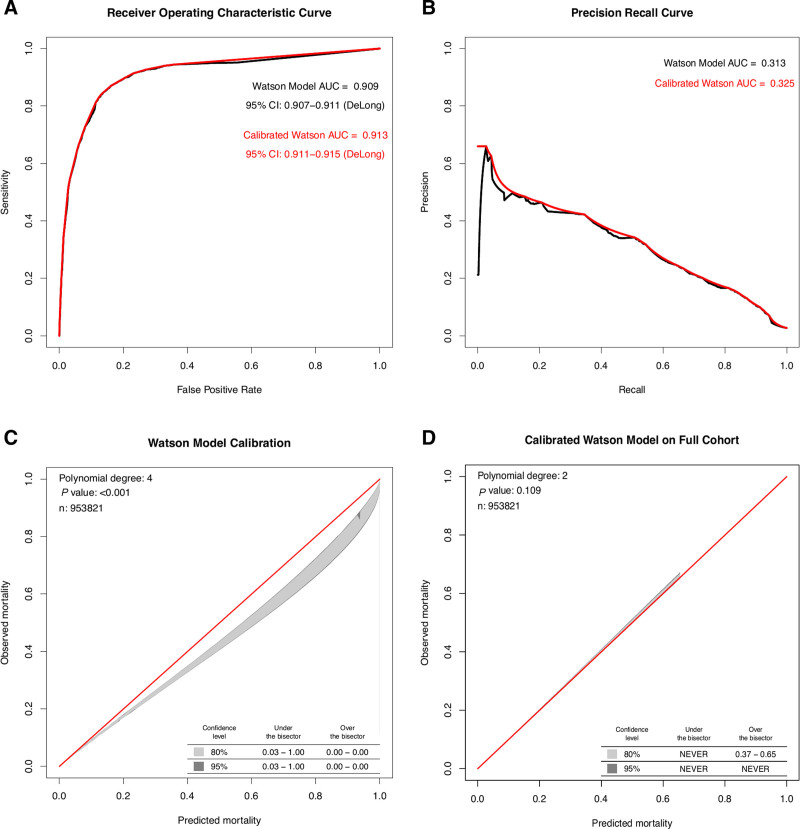
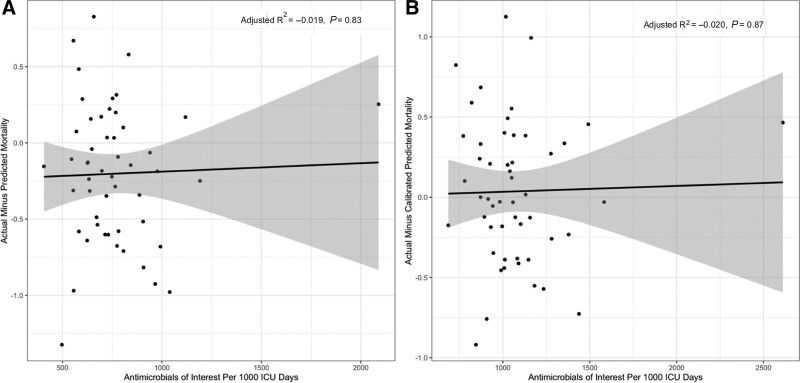
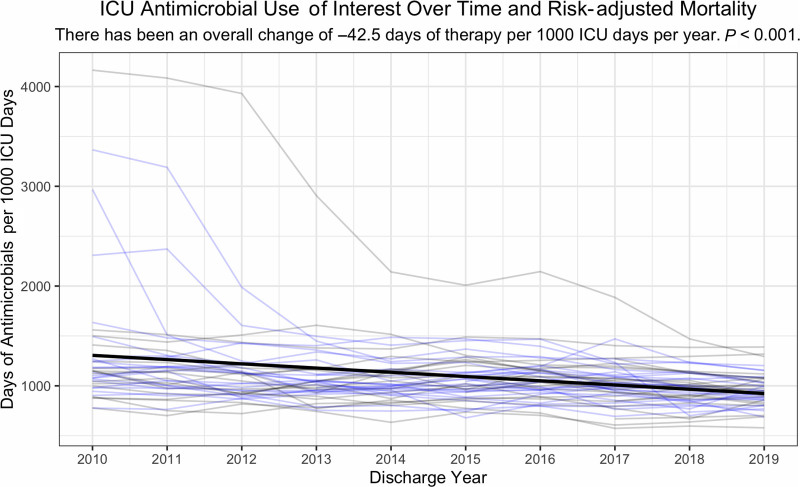
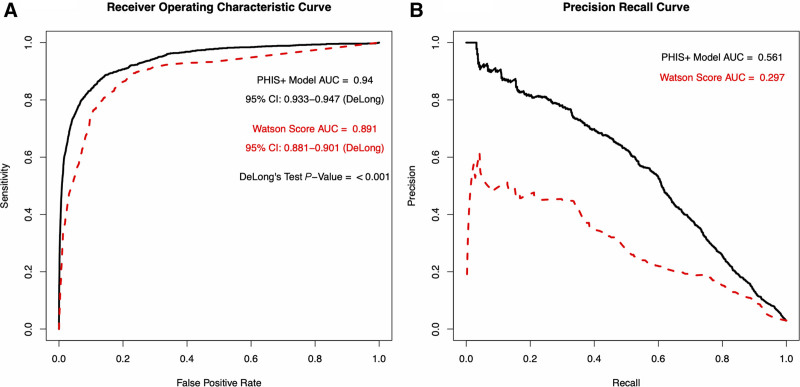
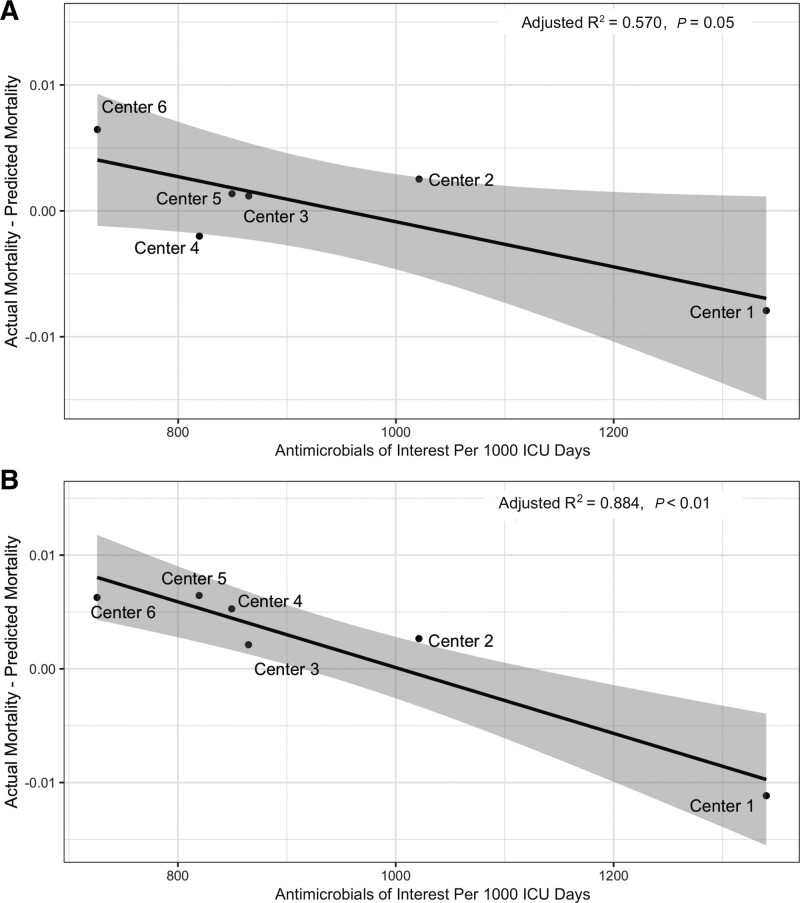
Results: The cohort included 953,821 ICU encounters (23,851 [2.7%] nonsurvivors). There was 4-fold center-level variability in antimicrobial use. ICU antimicrobial use was not correlated with risk-adjusted mortality assessed using IBM-Watson. A risk model incorporating laboratory data available in PHIS+ significantly outperformed IBM-Watson (c-statistic 0.940 [95% confidence interval 0.933-0.947] versus 0.891 [0.881-0.901]; P < 0.001, area under the precision recall curve 0.561 versus 0.297). Risk-adjusted mortality was inversely associated with antimicrobial prescribing in this smaller cohort using both the PHIS+ and Watson models (P = 0.05 and P < 0.01, respectively).
Conclusions: Antimicrobial prescribing among pediatric ICUs in the PHIS database is variable and not associated with risk-adjusted mortality as assessed by IBM-Watson. Expanding existing administrative databases to include laboratory data can achieve more meaningful insights when assessing multicenter antibiotic prescribing practices.
Copyright © 2021 the Author(s). Published by Wolters Kluwer Health, Inc.
Figures
Similar articles
-
Variation in Adjusted Mortality for Medical Admissions to Pediatric Cardiac ICUs.Pediatr Crit Care Med. 2019 Feb;20(2):143-148. doi: 10.1097/PCC.0000000000001751. Pediatr Crit Care Med. 2019. PMID: 30371635 Free PMC article.
-
Inadequate antimicrobial treatment of infections: a risk factor for hospital mortality among critically ill patients.Chest. 1999 Feb;115(2):462-74. doi: 10.1378/chest.115.2.462. Chest. 1999. PMID: 10027448
-
Association Between Dexamethasone and Delirium in Critically Ill Patients: A Retrospective Cohort Study of a Large Clinical Database.J Surg Res. 2021 Jul;263:89-101. doi: 10.1016/j.jss.2021.01.027. Epub 2021 Feb 24. J Surg Res. 2021. PMID: 33639374
-
Variation in Antibiotic Prescribing Across a Pediatric Primary Care Network.J Pediatric Infect Dis Soc. 2015 Dec;4(4):297-304. doi: 10.1093/jpids/piu086. Epub 2014 Oct 30. J Pediatric Infect Dis Soc. 2015. PMID: 26582868 Free PMC article.
-
Increased body mass index and adjusted mortality in ICU patients with sepsis or septic shock: a systematic review and meta-analysis.Crit Care. 2016 Jun 15;20(1):181. doi: 10.1186/s13054-016-1360-z. Crit Care. 2016. PMID: 27306751 Free PMC article.
Cited by
-
Antimicrobial Defined Daily Dose in Neonatal Population: Validation in the Clinical Practice.Antibiotics (Basel). 2023 Mar 17;12(3):602. doi: 10.3390/antibiotics12030602. Antibiotics (Basel). 2023. PMID: 36978469 Free PMC article.
References
-
- Blinova E, Lau E, Bitnun A, et al. . Point prevalence survey of antimicrobial utilization in the cardiac and pediatric critical care unit. Pediatr Crit Care Med. 2013;14:e280–e288. - PubMed
-
- Brogan TV, Thurm C, Hersh AL, et al. . Variability in antibiotic use across PICUs. Pediatr Crit Care Med. 2018;19:519–527. - PubMed
-
- Grohskopf LA, Huskins WC, Sinkowitz-Cochran RL, et al. ; Pediatric Prevention Network. Use of antimicrobial agents in United States neonatal and pediatric intensive care patients. Pediatr Infect Dis J. 2005;24:766–773. - PubMed
-
- Centers for Disease Control and Prevention. Antibiotic Resistance Threats in the United States. Atlanta, GA: U.S. Department of Health and Human Services; 2013.
Grants and funding
LinkOut - more resources
Full Text Sources