

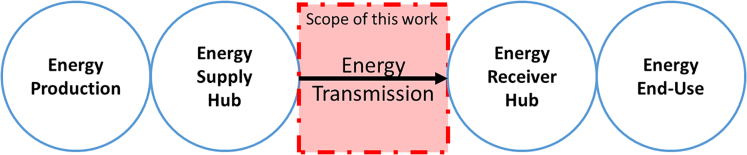
Cost of long-distance energy transmission by different carriers
- PMID: 34934917
- PMCID: PMC8661478
- DOI: 10.1016/j.isci.2021.103495
Cost of long-distance energy transmission by different carriers
Abstract
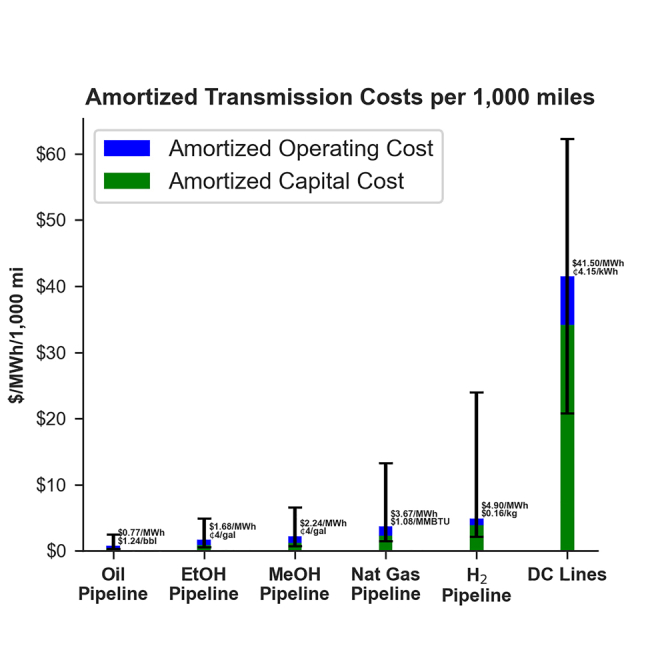
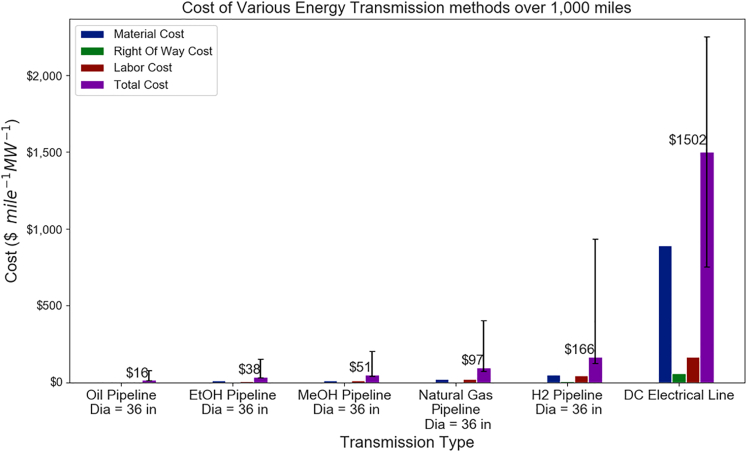
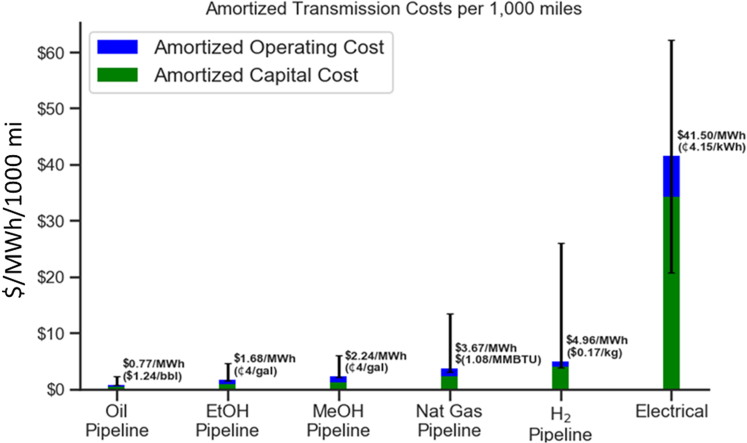
This paper compares the relative cost of long-distance, large-scale energy transmission by electricity, gaseous, and liquid carriers (e-fuels). The results indicate that the cost of electrical transmission per delivered MWh can be up to eight times higher than for hydrogen pipelines, about eleven times higher than for natural gas pipelines, and twenty to fifty times higher than for liquid fuels pipelines. These differences generally hold for shorter distances as well. The higher cost of electrical transmission is primarily because of lower carrying capacity (MW per line) of electrical transmission lines compared to the energy carrying capacity of the pipelines for gaseous and liquid fuels. The differences in the cost of transmission are important but often unrecognized and should be considered as a significant cost component in the analysis of various renewable energy production, distribution, and utilization scenarios.
Keywords: Energy flexibility; Energy resources; Energy systems; Energy transportation.
© 2021 The Author(s).
Conflict of interest statement
The authors declare no competing interests.
Figures
References
-
- Ahlgren W.L. The dual-fuel strategy: an energy transition plan. Proc. IEEE. 2012;100:3001–3052.
-
- ASME B31.12 . The American Society of Mechanical Engineers; 2012. Hydrogen Piping and Pipelines with Code Mod.-R013487.
-
- Bjorck P.-O., Grahn M. Chalmers University of Technology; 1999. A Feasibility Study of Hydrogen Distribution in Present Natural Gas Pipeline Systems.
-
- Brandt A.R., Heath G.A., Kort E.A., O’Sullivan F., Pétron G., Jordaan S.M., Tans P., Wilcox J., Gopstein A.M., Arent D., et al. Methane leaks from North American natural gas systems. Energy Environ. 2014;343:733–734. - PubMed
-
- Brown D., Cabe J., Stout T. National lab uses OGJ data to develop cost equations. Oil Gas J. 2011;109:108–111.
LinkOut - more resources
Full Text Sources
Other Literature Sources
