. 2021 Dec 22;9(3):e0140421.
doi: 10.1128/Spectrum.01404-21. Epub 2021 Dec 22.

Microbial Communities in Retail Draft Beers and the Biofilms They Produce

Affiliations

Microbial Communities in Retail Draft Beers and the Biofilms They Produce

Nikhil Bose et al. Microbiol Spectr. .

Abstract

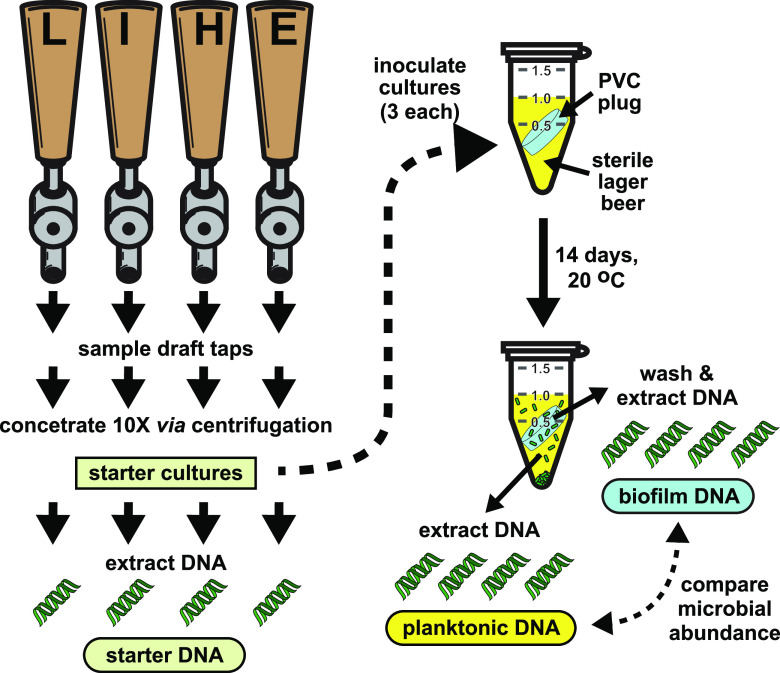
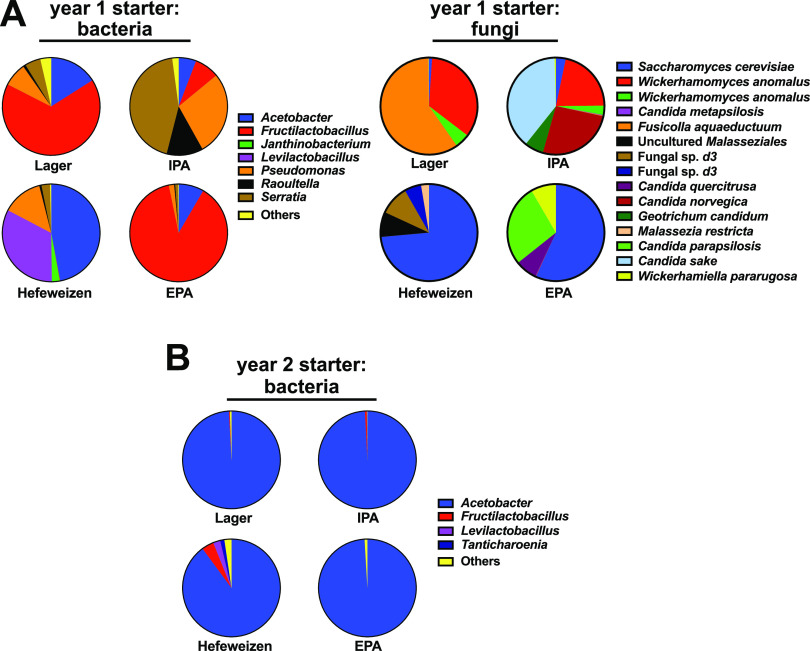
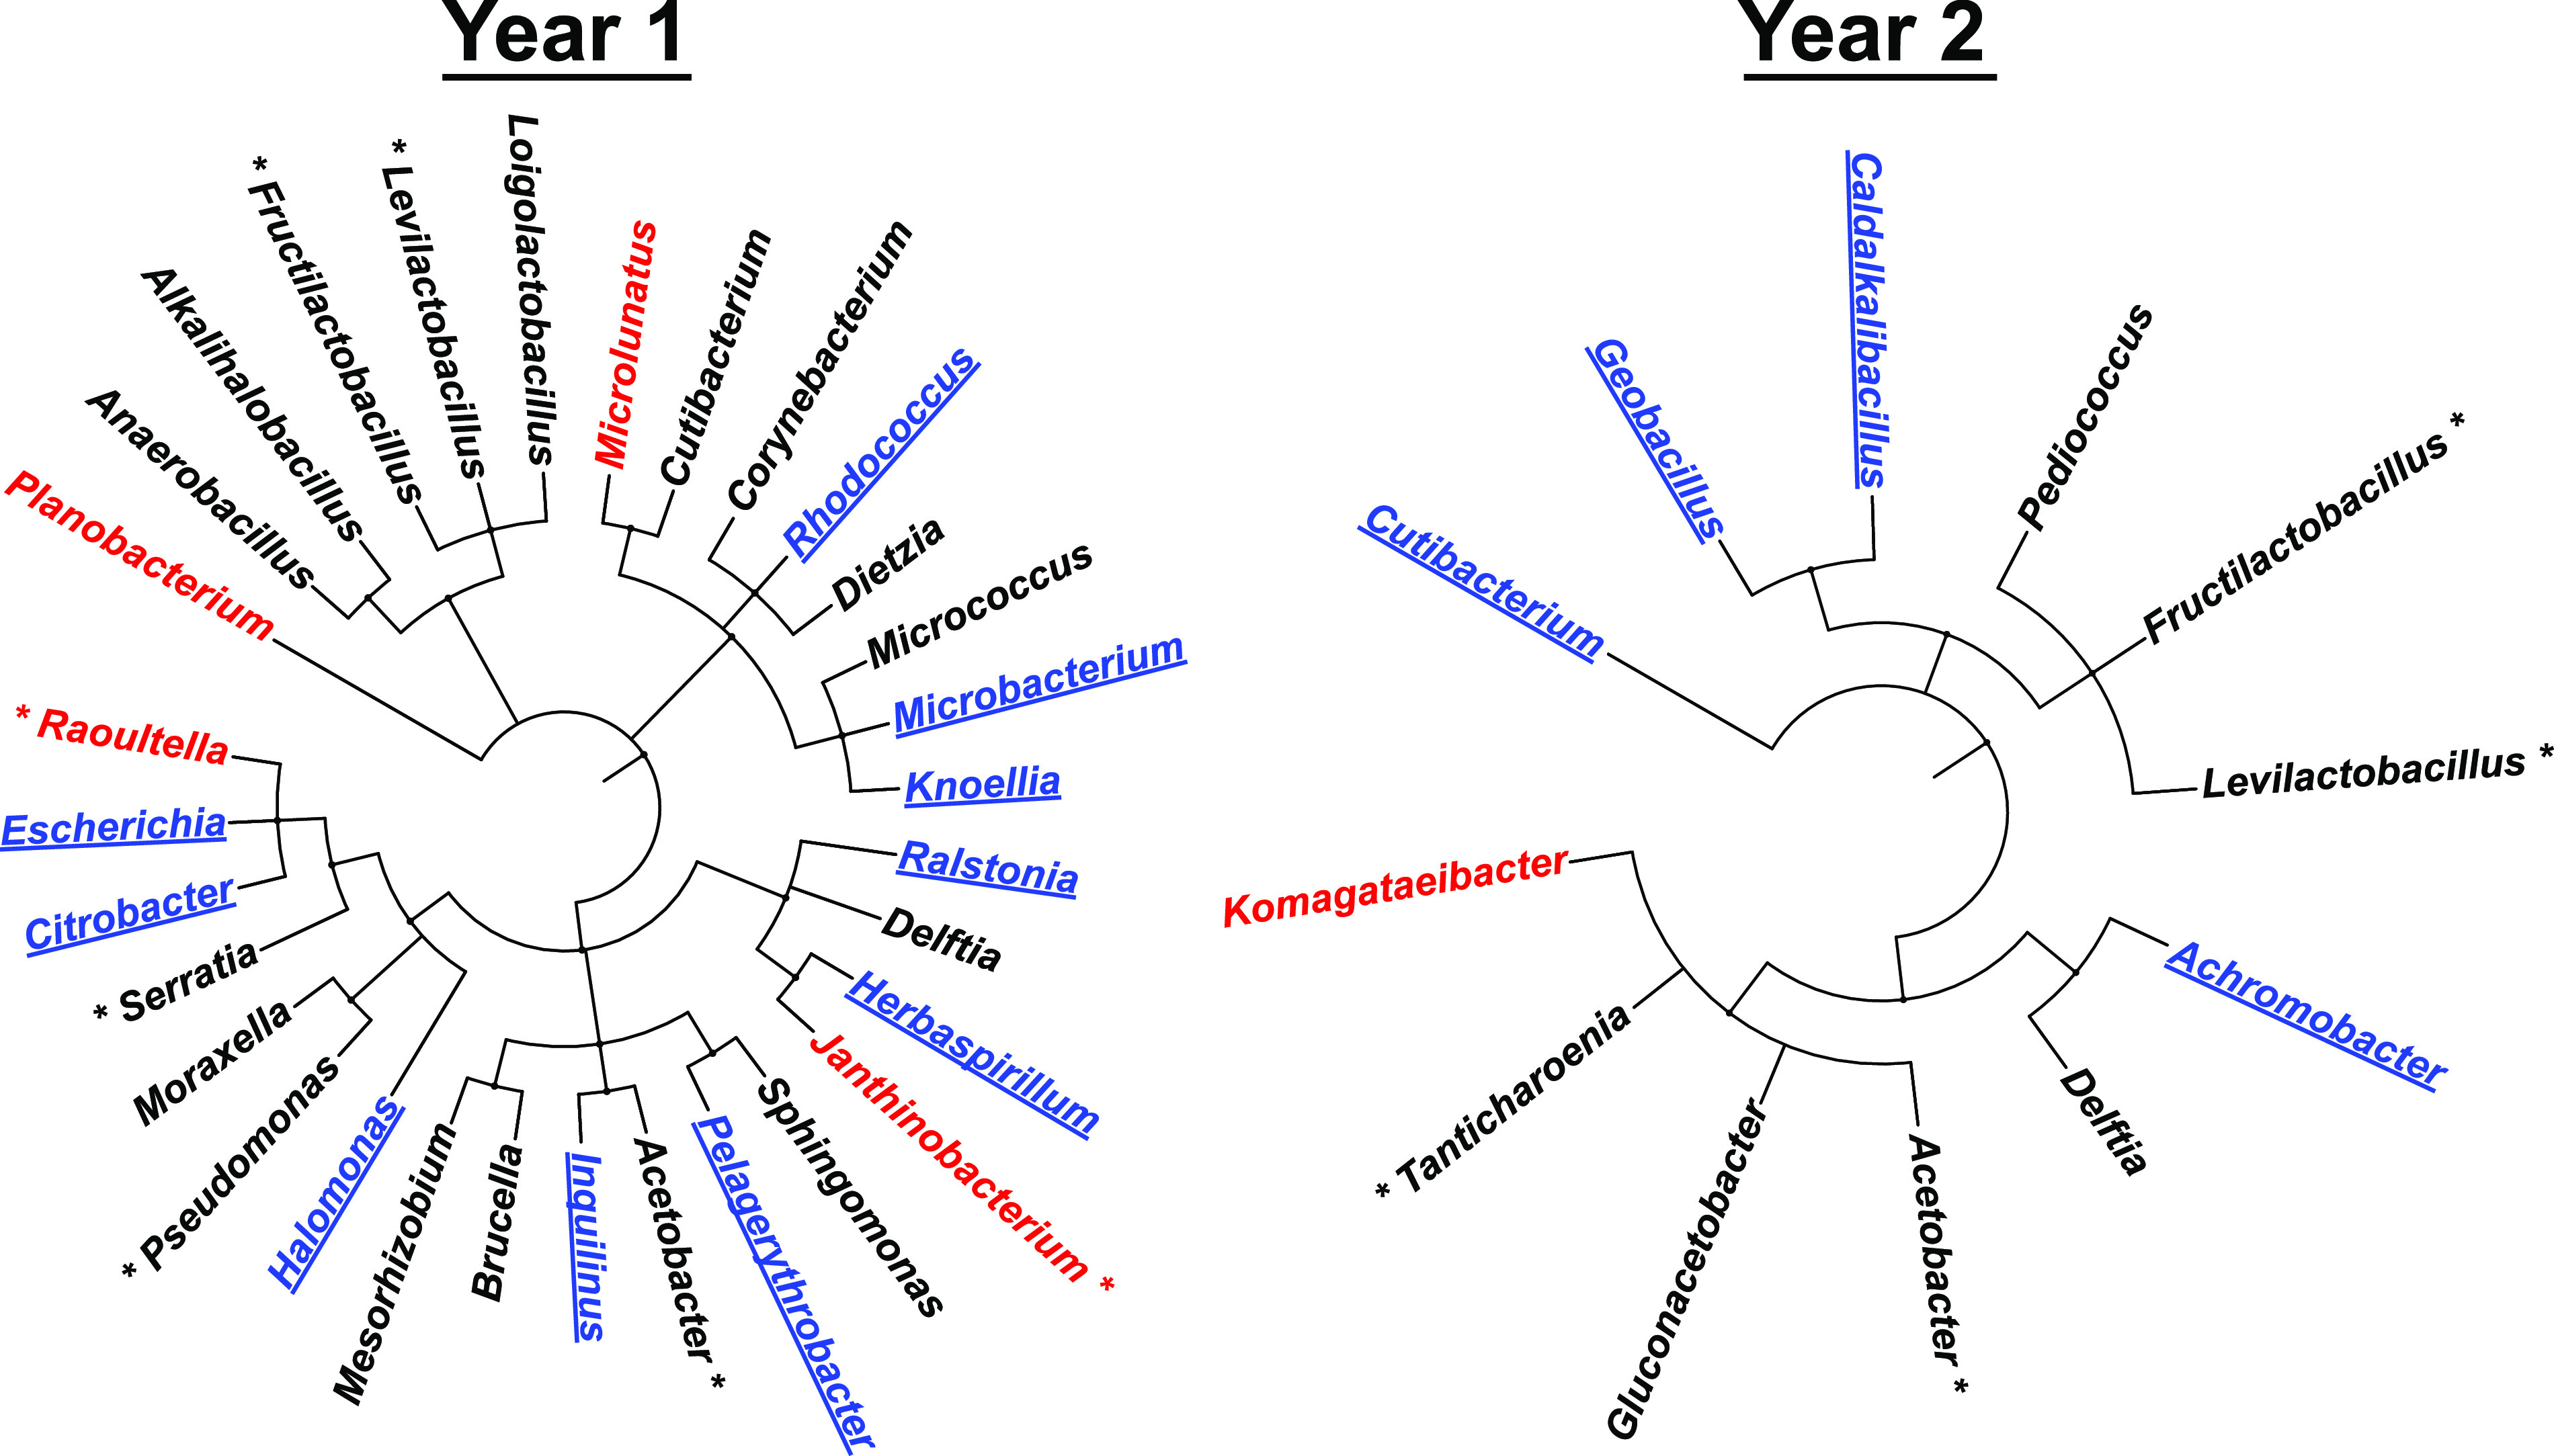
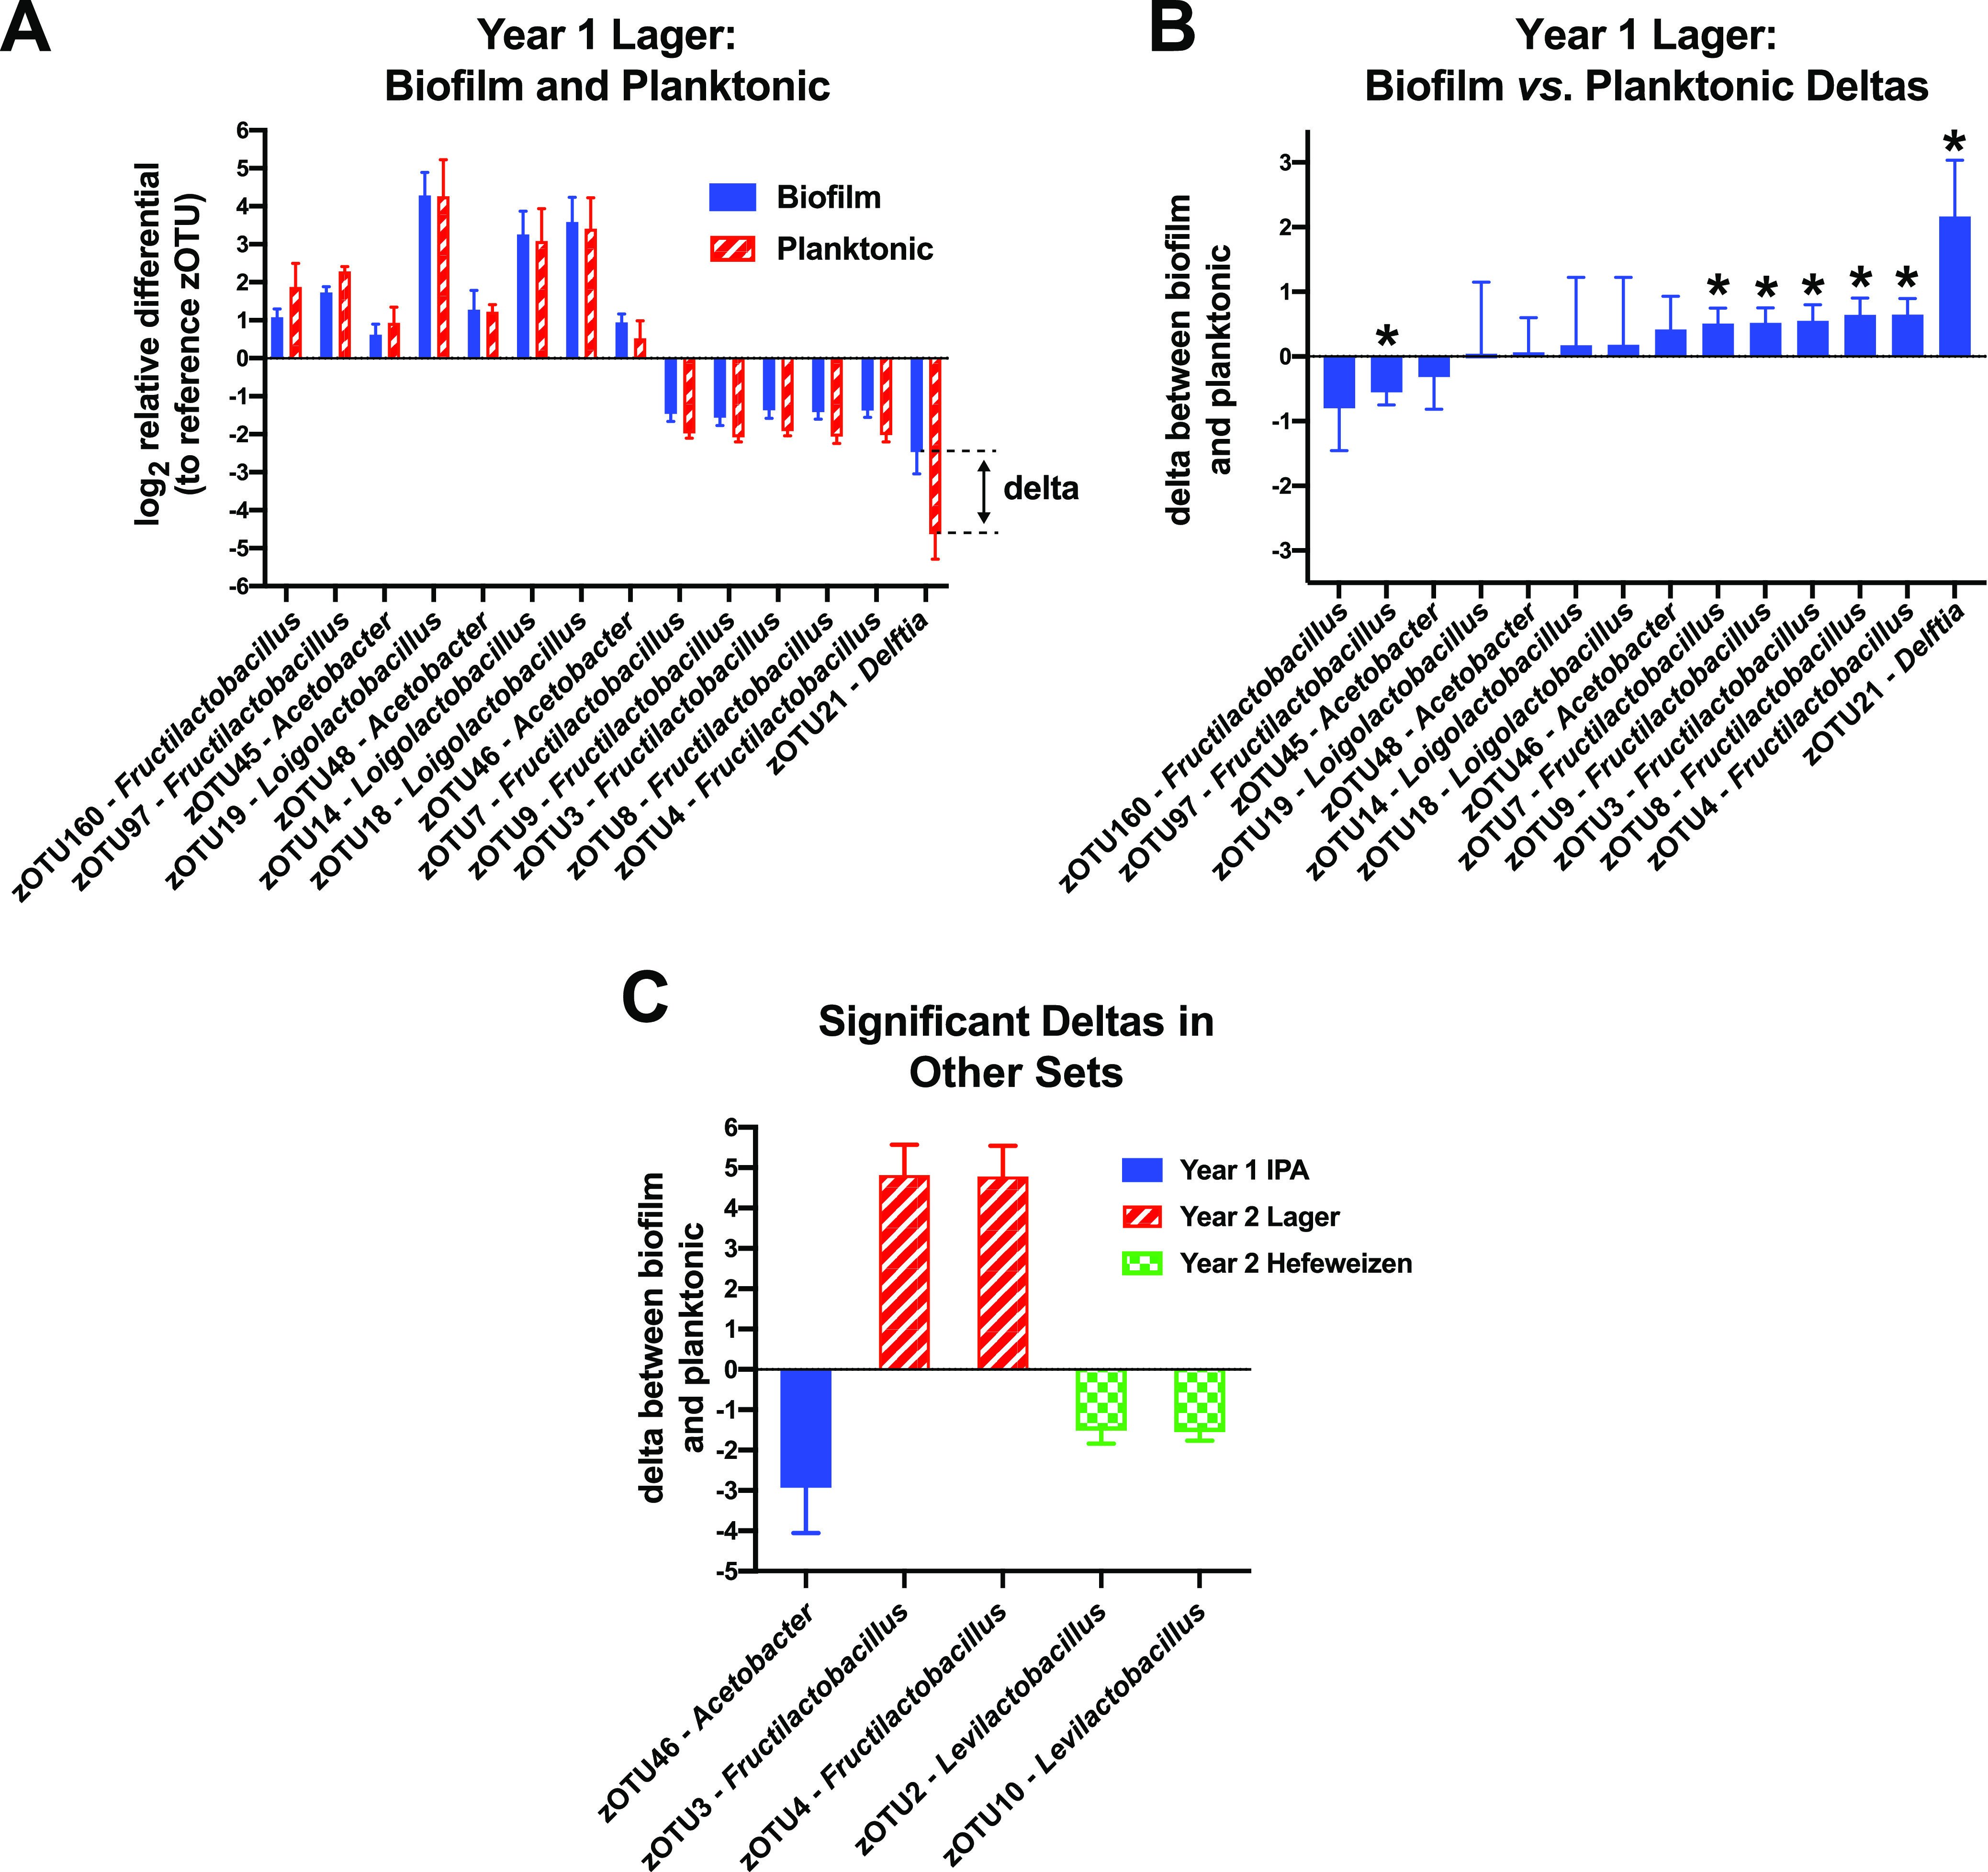
In the beer brewing industry, microbial spoilage presents a consistent threat that must be monitored and controlled to ensure the palatability of a finished product. Many of the predominant beer spoilage microbes have been identified and characterized, but the mechanisms of contamination and persistence remain an open area of study. Postproduction, many beers are distributed as kegs that are attached to draft delivery systems in retail settings where ample opportunities for microbial spoilage are present. As such, restaurants and bars can experience substantial costs and downtime for cleaning when beer draft lines become heavily contaminated. Spoilage monitoring on the retail side of the beer industry is often overlooked, yet this arena may represent one of the largest threats to the profitability of a beer if its flavor profile becomes substantially distorted by contaminating microbes. In this study, we sampled and cultured microbial communities found in beers dispensed from a retail draft system to identify the contaminating bacteria and yeasts. We also evaluated their capability to establish new biofilms in a controlled setting. Among four tested beer types, we identified over a hundred different contaminant bacteria and nearly 20 wild yeasts. The culturing experiments demonstrated that most of these microbes were viable and capable of joining new biofilm communities. These data provide an important reference for monitoring specific beer spoilage microbes in draft systems and we provide suggestions for cleaning protocol improvements. IMPORTANCE Beer production, packaging, and service are each vulnerable to contamination by microbes that metabolize beer chemicals and impart undesirable flavors, which can result in the disposal of entire batches. Therefore, great effort is taken by brewmasters to reduce and monitor contamination during production and packaging. A commonly overlooked quality control stage of a beer supply chain is at the retail service end, where beer kegs supply draft lines in bars and restaurants under nonsterile conditions. We found that retail draft line contamination is rampant and that routine line cleaning methods are insufficient to efficiently suppress beer spoilage. Thus, many customers unknowingly consume spoiled versions of the beers they consume. This study identified the bacteria and yeast that were resident in retail draft beer samples and also investigated their abilities to colonize tubing material as members of biofilm communities.

Keywords: Acetobacter; Fructilactobacillus; Lactobacillus; bacteria; beer; biofilm; yeast.


Figures

FIG 1
FIG 1
Beer sampling and biofilm development. Beer samples were collected from four draft taps serving a lager (L), an IPA (I), a hefeweizen (H), or an EPA (E) as the first draws of that day. The microbes in each were concentrated 10-fold using centrifugation to create starter cultures and sampled for DNA extractions. Each culture tube contained sterile lager beer as a growth medium and uniform plugs of draft line plastic prior to inoculation with a starter culture. These cultures were allowed to develop for 2 weeks before extracting DNA from the planktonic and biofilm cells. The DNA in each sample was processed to establish the abundance of different microbes and then compared. Approximately 1 year later, a second sampling was performed from the same taps (which were still serving the same beers) and the experiment was repeated.
FIG 2
FIG 2
Bacteria and fungi present in the starter samples. Bacterial V3-V4 and fungal ITS2 hypervariable regions were sequenced and cataloged as zero-radius operational taxonomic units (zOTUs). These sequences were then assigned to source organisms at the genus or species level. (A) Year 1 bacterial and fungi abundances in the starter samples. Pie-charts illustrate the relative read abundances for the indicated organisms. Sequences with read abundances less than 1% of the total were grouped as “others.” (B) Bacterial abundances in the year 2 starter samples. Fungal ITS2 PCR amplicons were not recovered from the year 2 starter samples.
FIG 3
FIG 3
Diversity of bacterial genera and their preferential growth - taxonomic bushes illustrate the evolutionary diversity of bacteria that reproducibly grew well in the lab cultures, plotted from kingdom to genus for each year. Bacteria with sequence read counts greater than 1% of the total reads in that year are marked with asterisks. Cultured bacteria that were detected predominantly in biofilms are colored blue and underlined; those detected predominantly as planktonic are colored red.
FIG 4
FIG 4
Evaluating bacterial biofilm preferences. The sequence read counts in each sample were used to calculate relative abundances with respect to a common reference sequence in each sample (zOTU1). Those ratios were then used to establish changes in their relative abundances in the incubated biofilm or planktonic communities compared to their abundances in the starter samples. (A) Bar plots of the log2 transforms of the relative differentials for bacteria in the incubated lager cultures (a 2-fold change is one unit on the ordinate axis). Error bars indicate the standard deviations between the three culture replicates. The 'delta' is the difference between the biofilm change and the planktonic change. (B) Bar plots of the deltas, with negative values indicating a preference for the planktonic niche and positive values for the biofilms in the cultured samples. Delta values from pairs that had significant differences between the biofilm and planktonic groups are marked with asterisks (t test P values <0.05). (C) Five additional significant biofilm deltas observed among the other seven culturing experiments.

References

    1. Barnett JA. 2000. A history of research on yeasts 2: Louis Pasteur and his contemporaries, 1850–1880. Yeast 16:755–771. doi:10.1002/1097-0061(20000615)16:8<755::AID-YEA587>3.0.CO;2-4. - DOI - PubMed
    1. Bamforth CW. 2017. Progress in brewing science and beer production. Annu Rev Chem Biomol Eng 8:161–176. doi:10.1146/annurev-chembioeng-060816-101450. - DOI - PubMed
    1. Lengeler KB, Stovicek V, Fennessy RT, Katz M, Förster J. 2020. Never change a brewing yeast? Why not, there are plenty to choose from. Front Genet 11:582789. doi:10.3389/fgene.2020.582789. - DOI - PMC - PubMed
    1. Baiano A. 2021. Craft beer: an overview. Compr Rev Food Sci Food Saf 20:1829–1856. doi:10.1111/1541-4337.12693. - DOI - PubMed
    1. Bokulich NA, Bamforth CW, Mills DA. 2012. Brewhouse-resident microbiota are responsible for multi-stage fermentation of American coolship ale. PLoS One 7:e35507. doi:10.1371/journal.pone.0035507. - DOI - PMC - PubMed

Publication types

LinkOut - more resources