. 2021 Dec;129(12):127007.
doi: 10.1289/EHP8562. Epub 2021 Dec 22.

Maternal Phthalates Exposure and Blood Pressure during and after Pregnancy in the PROGRESS Study

Affiliations

Maternal Phthalates Exposure and Blood Pressure during and after Pregnancy in the PROGRESS Study

Haotian Wu et al. Environ Health Perspect. 2021 Dec.

Abstract

Background: Phthalate exposure is ubiquitous and may affect biological pathways related to regulators of blood pressure. Given the profound changes in vasculature during pregnancy, pregnant women may be particularly susceptible to the potential effects of phthalates on blood pressure.

Objectives: We examined associations of phthalate exposure during pregnancy with maternal blood pressure trajectories from mid-pregnancy through 72 months postpartum.

Methods: Women with singleton pregnancies delivering a live birth in Mexico City were enrolled during the second trimester (n=892). Spot urine samples from the second and third trimesters were analyzed for 15 phthalate metabolites. Blood pressure and covariate data were collected over nine visits through 72 months postpartum. We used linear, logistic, and linear mixed models; latent class growth models (LCGMs); and Bayesian kernel machine regression to estimate the relationship of urinary phthalate biomarkers with maternal blood pressure.

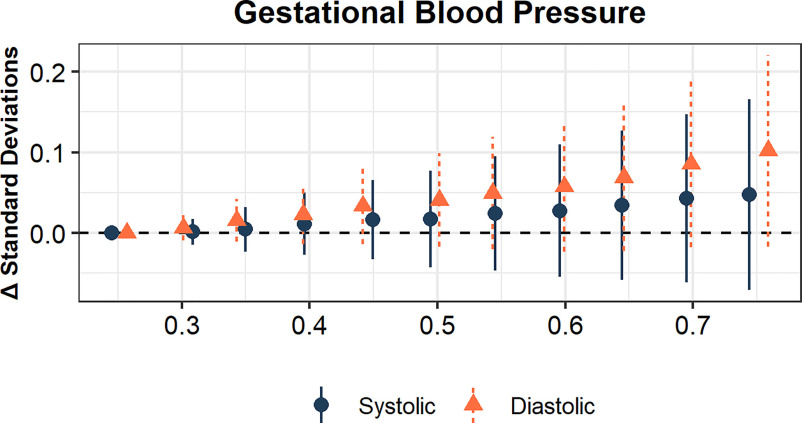
Results: As a joint mixture, phthalate biomarker concentrations during pregnancy were associated with higher blood pressure rise during mid-to-late gestation. With respect to individual biomarkers, second trimester concentrations of monobenzyl phthalate (MBzP) and di(2-ethylhexyl) phthalate biomarkers (ΣDEHP) were associated with higher third trimester blood pressure. Two trajectory classes were identified by LCGM, characterized by increasing blood pressure through 72 months postpartum ("increase-increase") or decreased blood pressure through 18 months postpartum with a gradual increase thereafter ("decrease-increase"). Increasing exposure to phthalate mixtures during pregnancy was associated with higher odds of being in the increase-increase class. Similar associations were observed for mono-2-ethyl-5-carboxypentyl terephthalate (MECPTP) and dibutyl phthalate (ΣDBP) biomarkers. When specific time periods were examined, we observed specific temporal relationships were observed for ΣDEHP, MECPTP, MBzP, and ΣDBP.

Discussion: In our cohort of pregnant women from Mexico City, exposure to phthalates and phthalate biomarkers was associated with higher blood pressure during late pregnancy, as well as with long-term changes in blood pressure trajectories. https://doi.org/10.1289/EHP8562.


Figures

Figure 1 is dot graph titled gestational blood pressure, plotting change in standard deviation, ranging from 0.0 to 0.2 in increments of 0.1 (y-axis) across 95 precent credible intervals, ranging from 0.3 to 0.7 in increments of 0.1 (x-axis) for systolic and diastolic.
Figure 1.
Bayesian kernel machine regression estimates of increasing phthalate metabolite mixture and blood pressure at third trimester. The model adjusted for maternal age, SES, education, parity, second trimester BMI, second trimester height, second trimester blood pressure, seasonality, and gestation age. The points and lines represent the point estimates (y-axis, in standard deviations for continuous blood pressure measures) and 95% credible intervals when all of the mixture components are at a given percentile (x-axis) compared with when all components are at the 25th percentile. All plots range from the 25th to the 75th percentile, in increments of 5%; the alignment are slightly jittered for presentation. Model estimates can be found in Table S3. Note: BMI, body mass index; SES, socioeconomic status.
2A is a set of nine error bar graphs titled di(2-ethylhexyl) phthalate, mono-2-ethyl-5-carboxypentyl terephthalate, diisononyl phthalate, mono(carboxy-isononyl) phthalate, mono-3-carboxypropyl phthalate, monobenzyl phthalate, diisobutyl phthalate, dibutyl phthalate, and monoethyl phthalate, plotting estimated change in systolic or diastolic blood pressure, in millimeter of Mercury, ranging from negative 1.0 to 1.0 in increments of 0.5 (y-axis), per double of metabolite concentrations (x-axis). Figure 2B is a set of nine line graphs titled di(2-ethylhexyl) phthalate, mono-2-ethyl-5-carboxypentyl terephthalate, diisononyl phthalate, mono(carboxy-isononyl) phthalate, mono-3-carboxypropyl phthalate, monobenzyl phthalate, diisobutyl phthalate, dibutyl phthalate, and monoethyl phthalate, plotting standard deviation difference, ranging from negative 0.5 to 0.5 in increments of 0.5 (y-axis) across standardized metabolite concentrations, ranging from negative 3 to 3 in increments of 3 (x-axis) for systolic and diastolic blood pressure.
Figure 2.
The associations of second trimester urinary phthalate metabolites and maternal blood pressure taken in the third trimester via (A) linear regression or (B) Bayesian kernel machine regression (BKMR). The linear models are interpreted as estimated change in blood pressure (in mmHg) per doubling of metabolite concentrations and the corresponding 95% confidence intervals. The BKMR models are presented as univariate dose–response curves with a scaled and centered exposure (x-axis) and outcome (y-axis) and can be interpreted as standard deviation changes in blood pressure compared with the median of exposure. The shaded areas represent the 95% credible intervals. Models included all nine metabolites in the same model and were adjusted for maternal age, SES, education, primiparity, height, second trimester BMI, second trimester blood pressure (systolic or diastolic), second trimester visit gestational age, and third trimester visit gestational age. Model estimates for (A) can be found in Table S4 (Model 3). Note: BMI, body mass index; DBP, dibutyl phthalate; DEHP, di(2-ethylhexyl) phthalate; DIBP, diisobutyl phthalate; DINP, diisononyl phthalate; MBzP, monobenzyl phthalate; MCNP, mono(carboxy-isononyl) phthalate; MCPP, mono-3-carboxypropyl phthalate; MECPTP, mono-2-ethyl-5-carboxypentyl terephthalate; MEP, monoethyl phthalate; SES, socioeconomic status.
Figures 3A and 3B are dot and line graphs titled systolic trajectories and diastolic trajectories, plotting postpartum systolic blood pressure change (millimeter of mercury), ranging from negative 40 to 60 in increments of 20 and postpartum diastolic blood pressure change (millimeter of mercury), ranging from negative 25 to 50 in increments of 25 (y-axis) across postpartum day, ranging from 0 to 3000 in increments of 1000 (x-axis) for latent class 1, and class 2. Figure 3C is a set of nine error bar graphs titled di(2-ethylhexyl) phthalate, mono-2-ethyl-5-carboxypentyl terephthalate, diisononyl phthalate, mono(carboxy-isononyl) phthalate, mono-3-carboxypropyl phthalate, monobenzyl phthalate, diisobutyl phthalate, dibutyl phthalate, and monoethyl phthalate, plotting odds ratio (reference equals class 1), ranging from negative 0.80 to 1.20 in increments of 0.20 (y-axis) per doubling of metabolite concentrations (x-axis) for systolic and diastolic blood pressure. Figure 3D is a set of nine line graphs titled di(2-ethylhexyl) phthalate, mono-2-ethyl-5-carboxypentyl terephthalate, diisononyl phthalate, mono(carboxy-isononyl) phthalate, mono-3-carboxypropyl phthalate, monobenzyl phthalate, diisobutyl phthalate, dibutyl phthalate, and monoethyl phthalate, plotting probit index change, ranging from negative 1.0 to 1.0 in increments of 0.5 (y-axis) across standardized metabolite concentrations, ranging from negative 3 to 3 in increments of 3 (x-axis) for systolic and diastolic blood pressure.
Figure 3.
Trajectory classes for postpartum blood pressure identified by latent class growth models are shown for (A) systolic and (B) diastolic blood pressure. The associations of geometric mean urinary phthalate metabolites (second and third trimester) and the trajectory classes via (C) logistic regression or (D) Bayesian kernel machine regression (BKMR). In all cases, trajectory 1 (“increase–increase”) was the reference group and trajectory 2 (“decrease–increase”) was the comparison group. The logistic regression models are expressed as odds ratios per doubling of metabolite concentrations, along with the corresponding 95% confidence intervals. The BKMR models are presented as univariate dose–response curves with a scaled and centered exposure (x-axis) and outcome (y-axis). The y-axis can be interpreted as the change in z-score (Probit index) of systolic/diastolic blood pressure compared with the median of exposure. Models included all nine metabolites in the same model and excluded women with preeclampsia or if they were pregnant again. Models were adjusted for maternal age, SES, education, primiparity, height, baseline BMI, and blood pressure at both baseline and 1 month postpartum. Model estimates for (C) can be found in Table S6. Note: BMI, body mass index; DBP, dibutyl phthalate; DEHP, di(2-ethylhexyl) phthalate; DIBP, diisobutyl phthalate; DINP, diisononyl phthalate; MBzP, monobenzyl phthalate; MCNP, mono(carboxy-isononyl) phthalate; MCPP, mono-3-carboxypropyl phthalate; MECPTP, mono-2-ethyl-5-carboxypentyl terephthalate; MEP, monoethyl phthalate; SES, socioeconomic status.
Figures 4A to 4C are error bar graphs titled latent class growth model classes (reference equals increase to increase class), postpartum short term changes (1 to 18 months), and postpartum long term changes (24 to 72 months), plotting change in Probit index, ranging from negative 0.5 to 0.1 in increments of 0.1; change in standard deviation, ranging from 0.0 to 0.2 in increments of 0.1; and change in standard deviation, ranging from 0.0 to 0.2 in increments of 0.1 (y-axis) across exposure quantities, ranging from 0.3 to 0.7 in increments of 0.1 (x-axis) for Systolic and Diastolic, respectively.
Figure 4.
Bayesian kernel machine regression estimates of increasing phthalate metabolite mixture on probability of being in (A) trajectory class 2 (“decrease–increase”), (B) short-term changes in postpartum blood pressure, and (C) long-term changes in postpartum blood pressure. All models were adjusted for maternal age, SES, education, parity, second trimester BMI, second trimester height, and second trimester blood pressure. The model in (A) additionally was adjusted for 1 month postpartum blood pressure, whereas models in (B) and (C) were adjusted for visit (days since delivery). The points and lines represent the point estimates (y-axis, in standard deviations for continuous blood pressure measures and Probit index for the binary trajectory class models) and 95% credible intervals when all of the mixture components are at a given percentile (x-axis) compared with when all components are at the 25th percentile. All plots range from the 25th to the 75th percentile, in increments of 5%; the alignments are slightly jittered for presentation. Model estimates can be found in Table S3. Note: BMI, body mass index; LCGM, latent class growth model; SES, socioeconomic status.
Figure 5A is a set of nine error bar graphs titled di(2-ethylhexyl) phthalate, mono-2-ethyl-5-carboxypentyl terephthalate, diisononyl phthalate, mono(carboxy-isononyl) phthalate, mono-3-carboxypropyl phthalate, monobenzyl phthalate, diisobutyl phthalate, dibutyl phthalate, and monoethyl phthalate, plotting millimeter of mercury difference for systolic and diastolic blood pressure, ranging from negative 2 to 2 in unit increments (y-axis), per doubling of metabolite concentrations (x-axis). Figure 5B is a set of nine line graphs titled di(2-ethylhexyl) phthalate, mono-2-ethyl-5-carboxypentyl terephthalate, diisononyl phthalate, mono(carboxy-isononyl) phthalate, mono-3-carboxypropyl phthalate, monobenzyl phthalate, diisobutyl phthalate, dibutyl phthalate, and monoethyl phthalate, plotting standard deviation difference, ranging from negative 0.5 to 1.0 in increments of 0.5 (y-axis) across standardized metabolite concentrations, ranging from negative 3 to 3 in increments of 3 (x-axis) for systolic and diastolic blood pressure.
Figure 5.
The associations of mean urinary phthalate metabolites (second and third trimester) and short-term postpartum maternal blood pressure (6, 12, and 18 months) via (A) linear mixed models or (B) Bayesian kernel machine regression (BKMR). The linear mixed models are interpreted as estimated change in blood pressure (in mmHg) per doubling of metabolite concentrations and the corresponding 95% confidence intervals. The BKMR models are presented as univariate dose–response curves with a scaled and centered exposure (x-axis) and outcome (y-axis) and can be interpreted as standard deviation changes in blood pressure compared with the median of exposure. The shaded areas represent the 95% credible intervals. Models included all nine metabolites in the same model and excluded women with preeclampsia or if they were pregnant again. Models were adjusted for maternal age, SES, education, primiparity, height, baseline blood pressure, 1 month postpartum blood pressure, baseline BMI, and visit (1, 6, and 12 months postpartum). Model estimates for (B) can be found in Table S9 (Model 2). Note: BMI, body mass index; DBP, dibutyl phthalate; DEHP, di(2-ethylhexyl) phthalate; DIBP, diisobutyl phthalate; DINP, diisononyl phthalate; MBzP, monobenzyl phthalate; MCNP, mono(carboxy-isononyl) phthalate; MCPP, mono-3-carboxypropyl phthalate; MECPTP, mono-2-ethyl-5-carboxypentyl terephthalate; MEP, monoethyl phthalate; SES, socioeconomic status.
Figure 6A is a set of nine error bar graphs titled di(2-ethylhexyl) phthalate, mono-2-ethyl-5-carboxypentyl terephthalate, diisononyl phthalate, mono(carboxy-isononyl) phthalate, mono-3-carboxypropyl phthalate, monobenzyl phthalate, diisobutyl phthalate, dibutyl phthalate, and monoethyl phthalate, plotting millimeter of mercury difference for systolic and diastolic blood pressure, ranging from negative 2 to 2 in unit increments (y-axis), per doubling of standardized metabolite concentrations (x-axis). Figure 6B is a set of nine line graphs titled di(2-ethylhexyl) phthalate, mono-2-ethyl-5-carboxypentyl terephthalate, diisononyl phthalate, mono(carboxy-isononyl) phthalate, mono-3-carboxypropyl phthalate, monobenzyl phthalate, diisobutyl phthalate, dibutyl phthalate, and monoethyl phthalate, plotting standard deviation difference, ranging from negative 0.4 to 0.8 in increments of 0.4 (y-axis) across standardized metabolite concentrations, ranging from negative 3 to 3 in increments of 3 (x-axis) for systolic and diastolic blood pressure.
Figure 6.
The associations of mean urinary phthalate metabolites (second and third trimester) and long-term postpartum maternal blood pressure (24, 48, 72 months) via (A) linear mixed models or (B) Bayesian kernel machine regression (BKMR) (B). The linear mixed models are interpreted as estimated change in blood pressure (in mmHg) per doubling of metabolite concentrations and the corresponding 95% confidence intervals. The BKMR models are presented as univariate dose–response curves with a scaled and centered exposure (x-axis) and outcome (y-axis) and can be interpreted as standard deviation changes in blood pressure compared with the median of exposure. The shaded areas represent the 95% credible intervals. Models included all nine metabolites in the same model and excluded women with preeclampsia or if they were pregnant again. Models were adjusted for maternal age, SES, education, primiparity, height, baseline BMI, baseline blood pressure, and visit (number of days postpartum), excluding those with preeclampsia (n=47). Model estimates for (B) can be found in Table S10 (Model 2). Note: BMI, body mass index; DBP, dibutyl phthalate; DEHP, di(2-ethylhexyl) phthalate; DIBP, diisobutyl phthalate; DINP, diisononyl phthalate; MBzP, monobenzyl phthalate; MCNP, mono(carboxy-isononyl) phthalate; MCPP, mono-3-carboxypropyl phthalate; MECPTP, mono-2-ethyl-5-carboxypentyl terephthalate; MEP, monoethyl phthalate; SES, socioeconomic status.
Figure 7 is a set of two error bar graphs titled Sphygmomanometer (48 to 72 months) and Oscillometer (48 to 72 months), plotting change in standard deviations, ranging from 0.0 to 0.2 in increments of 0.1 (y-axis) across exposure quantities, ranging from 0.3 to 0.7 in increments of 0.1 (x-axis) for Systolic and Diastolic, respectively.
Figure 7.
Bayesian kernel machine regression estimates of increasing phthalate metabolite mixture on long-term postpartum blood pressure measured at 48 and 72 months postpartum using sphygmomanometer and or SpaceLab oscillometers. Models were adjusted for maternal age, SES, education, primiparity, height, baseline BMI, baseline blood pressure, and visit (number of days postpartum). The estimates represent the estimated change and associated 95% credible interval (y-axis, in standard deviations) when all of the mixture components are at a given percentile (x-axis) compared with when all components are at the 25th percentile. All plots range from the 25th to the 75th percentile, in increments of 5%; the alignment are slightly jittered for presentation. Note: BMI, body mass index; SES, socioeconomic status.

Comment in

References

    1. Amin MM, Ebrahimpour K, Parastar S, Shoshtari-Yeganeh B, Hashemi M, Mansourian M, et al. . 2018. Association of urinary concentrations of phthalate metabolites with cardiometabolic risk factors and obesity in children and adolescents. Chemosphere 211:547–556, PMID: , 10.1016/j.chemosphere.2018.07.172. - DOI - PubMed
    1. Bakk Z, Tekle FB, Vermunt JK. 2013. Estimating the association between latent class membership and external variables using bias-adjusted three-step approaches. Sociol Methodol 43(1):272–311, 10.1177/0081175012470644. - DOI
    1. Benjamin S, Masai E, Kamimura N, Takahashi K, Anderson RC, Faisal PA. 2017. Phthalates impact human health: epidemiological evidences and plausible mechanism of action. J Hazard Mater 340:360–383, PMID: , 10.1016/j.jhazmat.2017.06.036. - DOI - PubMed
    1. Bobb JF, Claus Henn B, Valeri L, Coull BA. 2018. Statistical software for analyzing the health effects of multiple concurrent exposures via Bayesian kernel machine regression. Environ Health 17(1):67, PMID: , 10.1186/s12940-018-0413-y. - DOI - PMC - PubMed
    1. Bobb JF, Valeri L, Claus Henn B, Christiani DC, Wright RO, Mazumdar M, et al. . 2015. Bayesian kernel machine regression for estimating the health effects of multi-pollutant mixtures. Biostatistics 16(3):493–508, PMID: , 10.1093/biostatistics/kxu058. - DOI - PMC - PubMed

Publication types