. 2022 Feb 23;96(4):e0211721.
doi: 10.1128/jvi.02117-21. Epub 2021 Dec 22.

Catch Me if You Can: the Crosstalk of Zika Virus and the Restriction Factor Tetherin

Affiliations

Catch Me if You Can: the Crosstalk of Zika Virus and the Restriction Factor Tetherin

Marie-Luise Herrlein et al. J Virol. .

Abstract

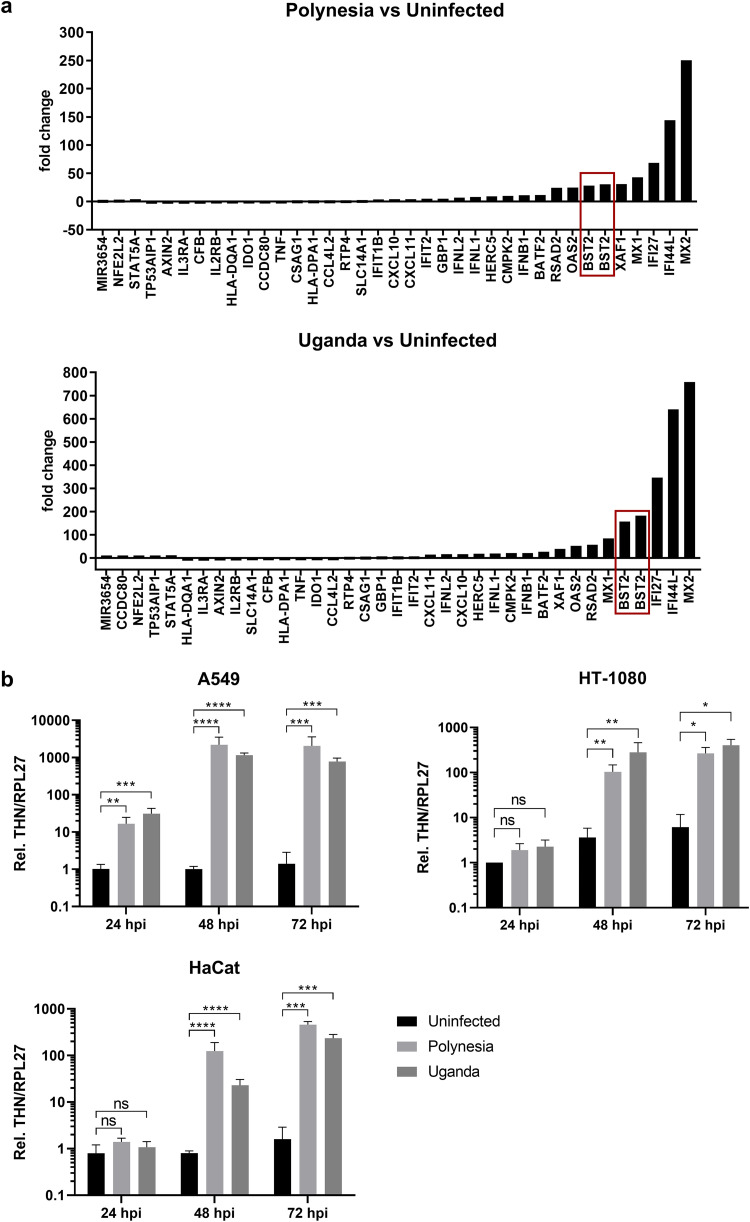
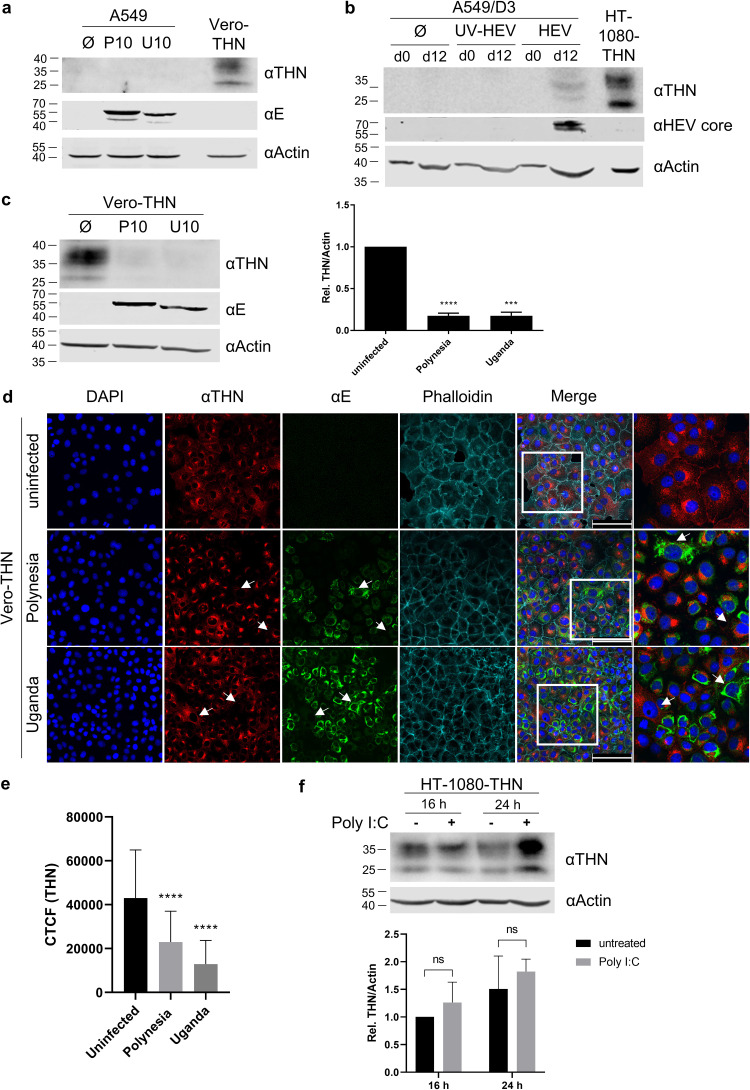
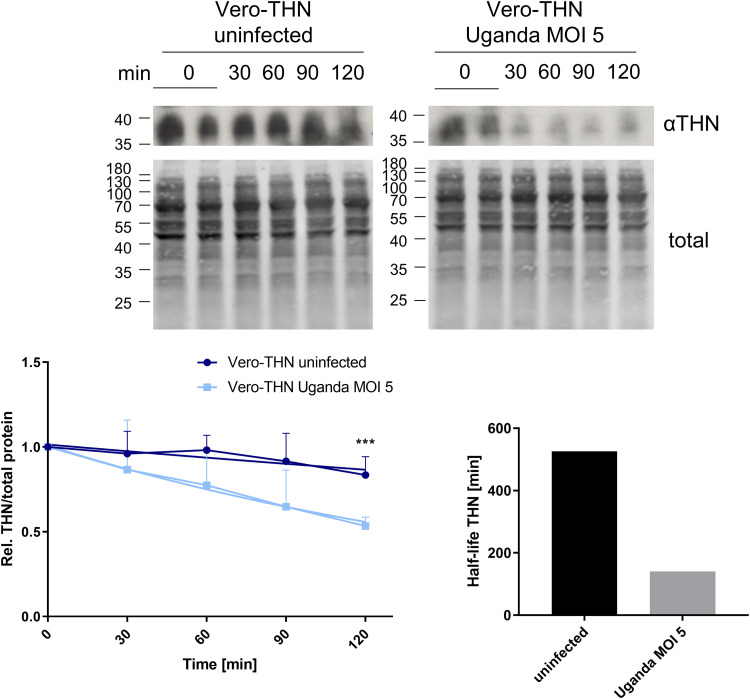
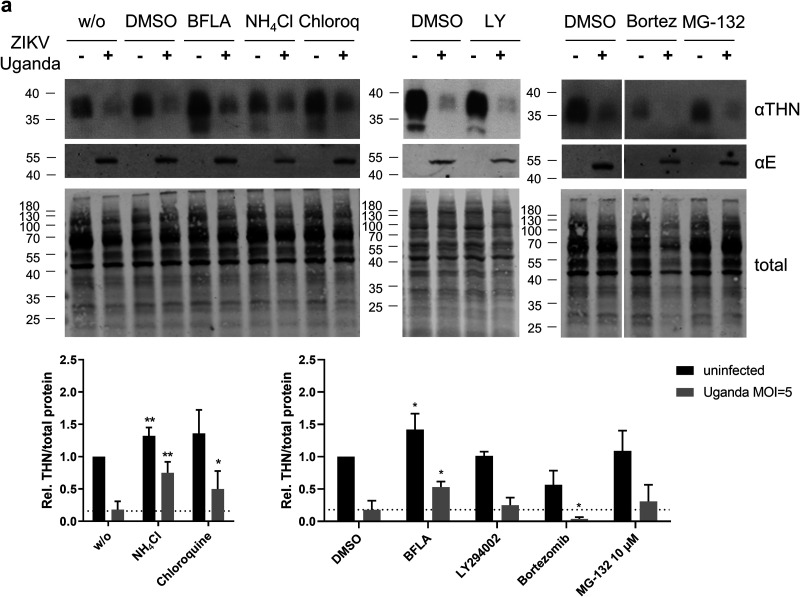
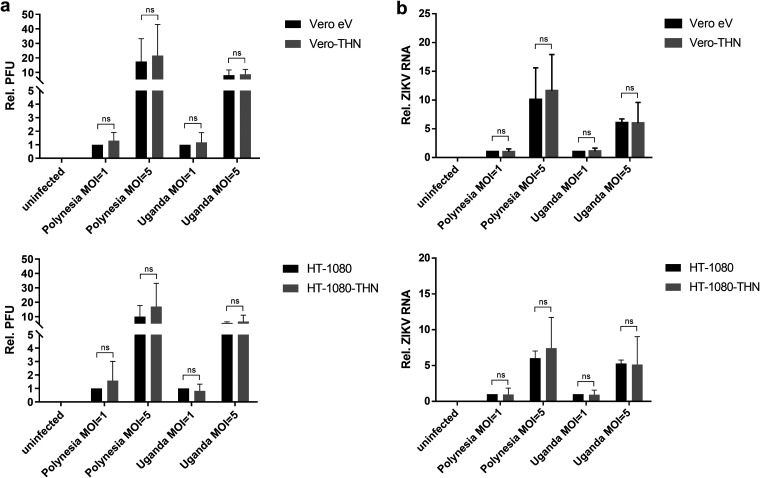
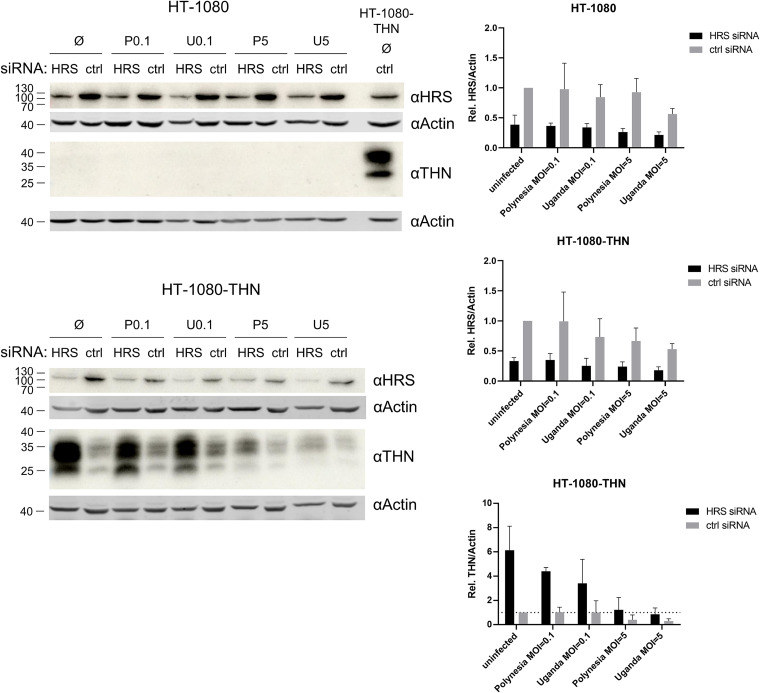
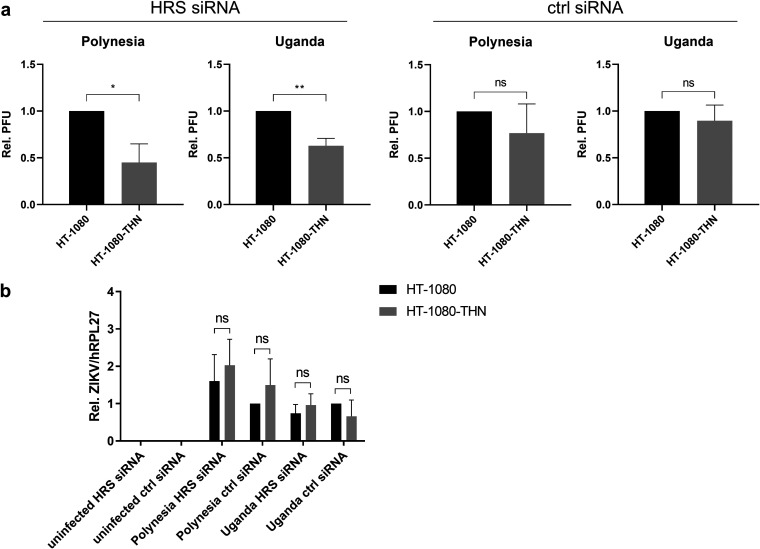
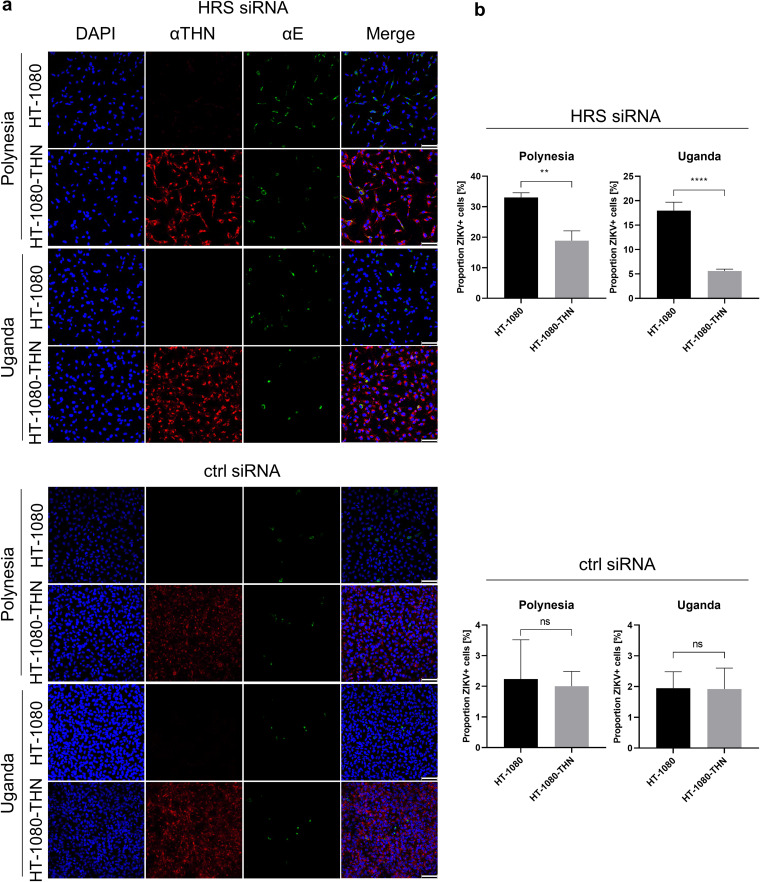
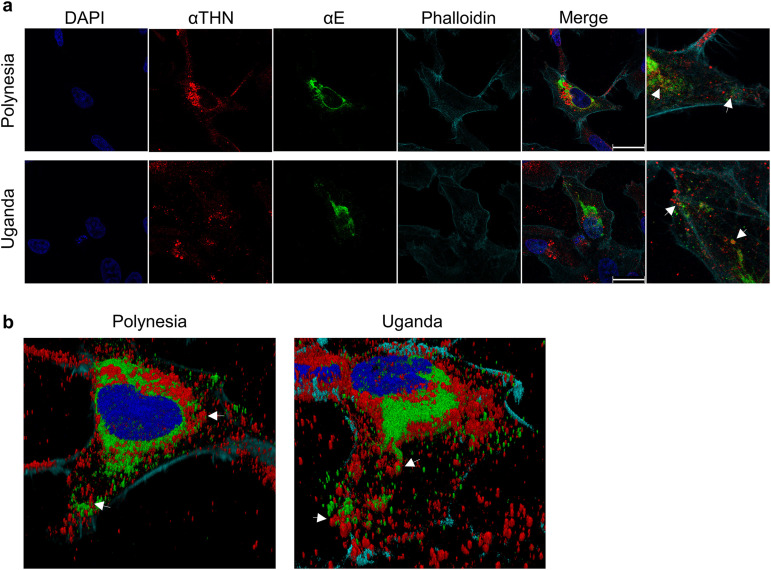
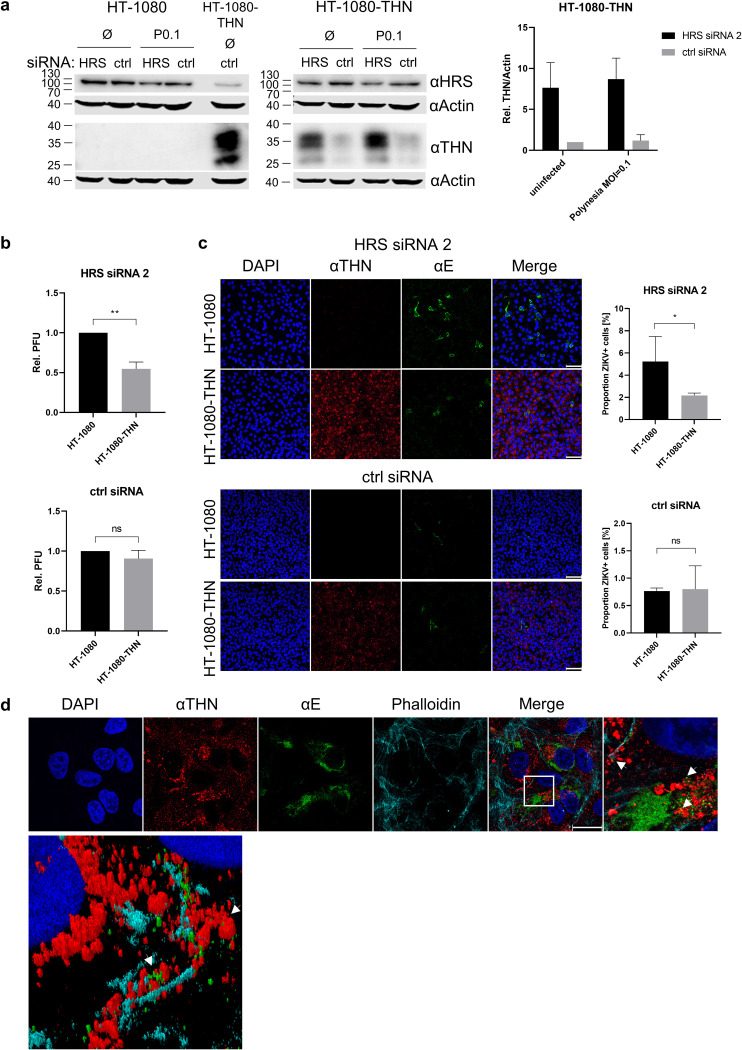
Zika virus (ZIKV) is a flavivirus that is mainly transmitted by Aedes mosquitos and normally causes mild symptoms. During the outbreak in the Americas in 2015, it was associated with more severe implications, like microcephaly in newborns and the Guillain-Barré syndrome. The lack of specific vaccines and cures strengthens the need for a deeper understanding of the virus life cycle and virus-host interactions. The restriction factor tetherin (THN) is an interferon-inducible cellular protein with broad antiviral properties. It is known to inhibit the release of various enveloped viruses by tethering them to each other and the cell membrane, thereby preventing their further spread. On the other hand, different viruses have developed various escape strategies against THN. Analysis of the cross-talk between ZIKV and THN revealed that, despite a strong induction of THN mRNA expression in ZIKV-infected cells, this is not reflected by an elevated protein level of THN. Contrariwise, the THN protein level is decreased due to a reduced half-life. The increased degradation of THN in ZIKV infected cells involves the endo-lysosomal system but does not depend on the early steps of autophagy. Enrichment of THN by depletion of the ESCRT-0 protein HRS diminishes ZIKV release and spread, which points out the capacity of THN to restrict ZIKV and explains the enhanced THN degradation in infected cells as an effective viral escape strategy. IMPORTANCE Although tetherin expression is strongly induced by ZIKV infection there is a reduction in the amount of tetherin protein. This is due to enhanced lysosomal degradation. However, if the tetherin level is rescued then the release of ZIKV is impaired. This shows that tetherin is a restriction factor for ZIKV, and the induction of an efficient degradation represents a viral escape strategy. To our knowledge, this is the first study that describes and characterizes tetherin as a restriction factor for the ZIKV life cycle.

Keywords: BST-2; HRS; ZIKV; Zika virus; flavivirus; tetherin.


Conflict of interest statement

The authors declare no conflict of interest.

Figures

FIG 1
FIG 1
Expression of THN is strongly induced after ZIKV infection. (A) Identification of deregulated genes in ZIKV-infected HaCat cells 48 h pi by microarray analysis, referred to as the uninfected control. Infection with both ZIKV strains resulted in a strong upregulation of BST2 (verified by two different spots on the array), which encodes THN (n = 1). (B) Quantification of THN mRNA levels in A549, HaCat, and HT-1080 cells by qPCR at 24, 48, and 72 h pi at a MOI of 0.1. All values were normalized to the uninfected control at the 24 h time point. More than 100-fold induction of THN mRNA expression could be seen in infected versus uninfected HaCat and HT-1080 cells and more than 1000-fold induction in infected compared to uninfected A549 cells.
FIG 2
FIG 2
ZIKV infection leads to a reduced amount of THN. (A) Western blot analysis of A549 cells at 24 h pi at a MOI of 10 with ZIKV Polynesia or Uganda. Vero-THN cells served as control. Despite elevated BST-2 expression, THN protein is not detectable after ZIKV infection in A549 cells. (B) Western blot analysis of A549/D3 cells at 0 and 12 days after infection with HEV. UV-inactivated HEV and HT-1080-THN cells served as negative- and positive-controls, respectively. In contrast to ZIKV, HEV infection results in elevated amounts of THN that are detectable by Western blotting. (C) Western blot of Vero-THN cells at 24 h pi at a MOI of 10. ZIKV infection strongly decreased THN protein levels. (D) Immunofluorescence microscopy of Vero-THN cells left uninfected or after infection with ZIKV Polynesia or Uganda 24 h pi at a MOI of 0.1. THN and ZIKV E were visualized with specific antibodies in red and green, respectively. Nuclei were stained with DAPI (blue) and the actin cytoskeleton with phalloidin-Atto633 (cyan). Scale bars indicate 100 μM. Expanded fields of view are shown without the actin signal to ease comparison. A strong reduction of THN signal in infected compared to uninfected cells was observed, as indicated by the arrows. (E) The total fluorescence per cell of cells depicted in (D) was calculated using the software Fiji with the formula corrected total cell fluorescence (CTCFTHN) = integrated densityTHN (area of selected cell × mean fluorescence of background readings). Per condition, a minimum of 67 cells was measured. In the case of infected cells, cells with a CTCFZIKV E ≥8000 were considered. (F) Western blot of HT-1080-THN cells 16 h and 24 h after Poly I:C treatment. A slight but not significant increase of THN amount was observed in Poly I:C-treated cells.
FIG 3
FIG 3
ZIKV infection causes a reduced THN half-life. Vero-THN cells were treated with CHX 16 h pi and analyzed by Western blotting at the indicated time points. All values were normalized to the onset of the treatment. Half-lives were calculated by a nonlinear regression equation based on the mean values of at least five independent experiments and are shown in the bottom right graph. THN protein half-life is significantly shorter in infected cells, indicating an elevated degradation of THN compared to uninfected cells.
FIG 4
FIG 4
Lysosomal protein degradation is responsible for reduced THN levels in ZIKV infected cells. (A) THN-overexpressing Vero cells were treated with inhibitors of different protein degradation pathways after infection with ZIKV Uganda and THN levels were analyzed by Western blotting. Values were normalized to the uninfected untreated (w/o) or DMSO control, depending on the solvent of the respective inhibitor. Inhibition of lysosomal acidification partly restored THN levels, while inhibition of early steps of autophagy or proteasomal degradation did not change or even further decreased the THN signal. (B) Immunofluorescence microscopy of uninfected or ZIKV Polynesia/Uganda infected cells 24 h pi at a MOI of 5. At this time point and MOI, all of the cells are typically infected. On the left side, THN (green) and the lysosomal marker LAMP-2 (red), on the right side, THN (red) and the autophagosomal marker LC3 (green) were stained with specific antibodies. Nuclei were visualized with DAPI (blue). Scale bars indicate 30 μM. In untreated cells, the remaining intracellular amount of THN is colocalizing with the LAMP-2, but not with LC3. BFLA treatment results in the accumulation of THN within lysosomal structures.
FIG 5
FIG 5
ZIKV escapes THN restriction. Vero or HT-1080 cells stably overexpressing THN (Vero-THN/HT-1080-THN) and the respective empty vector or wild-type control (Vero eV/HT-1080) were infected at a MOI of 1 or 5. (A) The amount of released infectious viral particles was determined by plaque assay. (B) Extracellular viral genomes were analyzed by qPCR. Relative values referred to the empty vector/wild-type control infected at a MOI of 1 with the respective ZIKV strain. No impact on THN-overexpression on the amount of released virus and viral genomes was observed.
FIG 6
FIG 6
Knockdown of HRS with siRNA results in THN accumulation. THN-overexpressing and wild-type HT-1080 cells were transfected with HRS or control siRNA and infected 48 h later at a MOI of 0.1 or 5. Cells were analyzed by Western blotting 24 h pi for HRS and THN. For HT-1080 cells, one lane with HT-1080-THN cells served as positive-control in terms of THN detection. Quantification of HRS and THN protein amounts were normalized to the uninfected, control siRNA-transfected cells. THN accumulated in HT-1080-THN cells after HRS knockdown compared to control siRNA-transfected cells. However, a decrease of THN signal after infection at high MOI compared to the uninfected cells was still observed.
FIG 7
FIG 7
Reduction of ZIKV release from THN-overexpressing cells after HRS knockdown. (A) Extracellular viral titers from HT-1080 and HT-1080-THN cells transfected with either HRS or control siRNA were determined by plaque assay 24 h pi at a MOI of 0.1. Values were normalized to the HRS or control siRNA-transfected wild-type cells. While no significant difference between HT-1080 and HT-1080-THN extracellular viral titers was observed after transfection of control siRNA, titers of HRS siRNA-transfected HT-1080-THN cells were lower than HT-1080 cells. (B) ZIKV binding assay. HT-1080 and HT-1080-THN cells transfected either with HRS or control siRNA were prechilled 30 min and then infected 1 h at 4°C. Bound viral genomes were determined by qPCR. Values were normalized to control siRNA-transfected HT-1080 cells. No significant difference in ZIKV binding was observed, neither in HRS nor in control siRNA-transfected cells.
FIG 8
FIG 8
Reduced ZIKV spread in HT-1080-THN cells after HRS knockdown. (A) Immunofluorescence microscopy of HT-1080 and HT-1080-THN cells transfected either with HRS or control siRNA and infected with ZIKV Polynesia or Uganda for 24 h at a MOI of 0.1. THN and ZIKV E were visualized with specific antibodies in red and green, respectively; nuclei were stained with DAPI (blue). Scale bars indicate 100 μM. (B) Quantification of ZIKV-positive cells in three fields of view of cells depicted in (A). After transfection with HRS siRNA, the number of infected cells was lower for HT-1080-THN compared to HT-1080 cells. This was not the case in control siRNA-transfected cells. Due to reduced proliferation and lower cell density after HRS siRNA transfection, a direct comparison between HRS and control siRNA-transfected cells was not possible.
FIG 9
FIG 9
ZIKV E partly colocalizes with THN in HT-1080-THN cells after HRS knockdown. (A) Images with higher magnification (100× objective) of HRS siRNA-transfected HT-1080-THN cells 24h after infection with ZIKV Polynesia/Uganda at a MOI of 0.1. THN and ZIKV E were visualized with specific antibodies in red and green, respectively; nuclei were stained with DAPI (blue) and the actin skeleton with phalloidin-Atto633. Scale bars indicate 30 μM. A colocalization of ZIKV E and THN was observed in peripheral structures as indicated by the arrows. (B) 3D reconstruction of cells depicted in (A).
FIG 10
FIG 10
Second HRS siRNA confirms a reduction of ZIKV release and spread in HT-1080-THN cells after HRS knockdown. HT-1080 and HT-1080-THN cells were transfected with HRS siRNA 2 or control siRNA and infected with ZIKV Polynesia at a MOI of 0.1 for 24 h. (A) Cells were analyzed by Western blotting for HRS and THN. (B) Extracellular viral titers were determined by plaque assay. (C) The number of ZIKV-positive cells was analyzed by immunofluorescence microscopy. THN and ZIKV E were visualized with specific antibodies in red and green, respectively; nuclei were stained with DAPI (blue). Scale bars indicate 100 μM. ZIKV-positive cells were quantified in three fields of view. (D) HT-1080-THN cells transfected with HRS siRNA 2 and infected with ZIKV Polynesia were imaged with higher magnification (100× objective). THN, ZIKV E, and nuclei were visualized as described in (C), the actin skeleton with phalloidin-Atto633. Scale bars indicate 30 μM. The lower panel shows a 3D reconstruction of a section of the cells depicted above.

Similar articles

Cited by

References

    1. Musso D, Gubler DJ. 2016. Zika virus. Clin Microbiol Rev 29:487–524. 10.1128/CMR.00072-15. - DOI - PMC - PubMed
    1. World Health Organization. Zika virus. https://www.who.int/news-room/fact-sheets/detail/zika-virus. Accessed 29 September, 2021.
    1. Sirohi D, Kuhn RJ. 2017. Zika virus structure, maturation, and receptors. J Infect Dis 216:S935–S944. 10.1093/infdis/jix515. - DOI - PMC - PubMed
    1. Sirohi D, Chen Z, Sun L, Klose T, Pierson TC, Rossmann MG, Kuhn RJ. 2016. The 3.8 Å resolution cryo-EM structure of Zika virus. Science 352:467–470. 10.1126/science.aaf5316. - DOI - PMC - PubMed
    1. Kostyuchenko VA, Lim EXY, Zhang S, Fibriansah G, Ng T-S, Ooi JSG, Shi J, Lok S-M. 2016. Structure of the thermally stable Zika virus. Nature 533:425–428. 10.1038/nature17994. - DOI - PubMed

Publication types

MeSH terms

Substances