. 2021 Dec 22;6(24):e153201.
doi: 10.1172/jci.insight.153201.

Single-cell profiling of T and B cell repertoires following SARS-CoV-2 mRNA vaccine

Affiliations

Single-cell profiling of T and B cell repertoires following SARS-CoV-2 mRNA vaccine

Suhas Sureshchandra et al. JCI Insight. .

Abstract

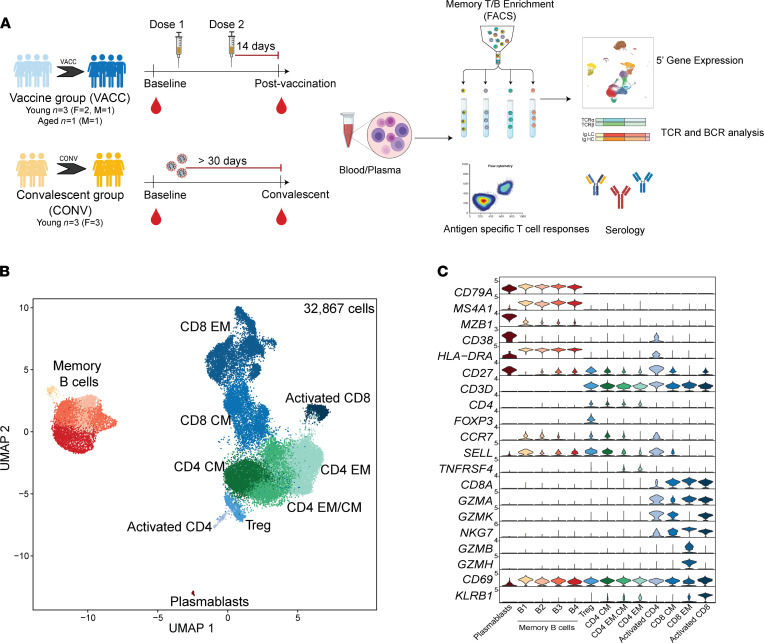
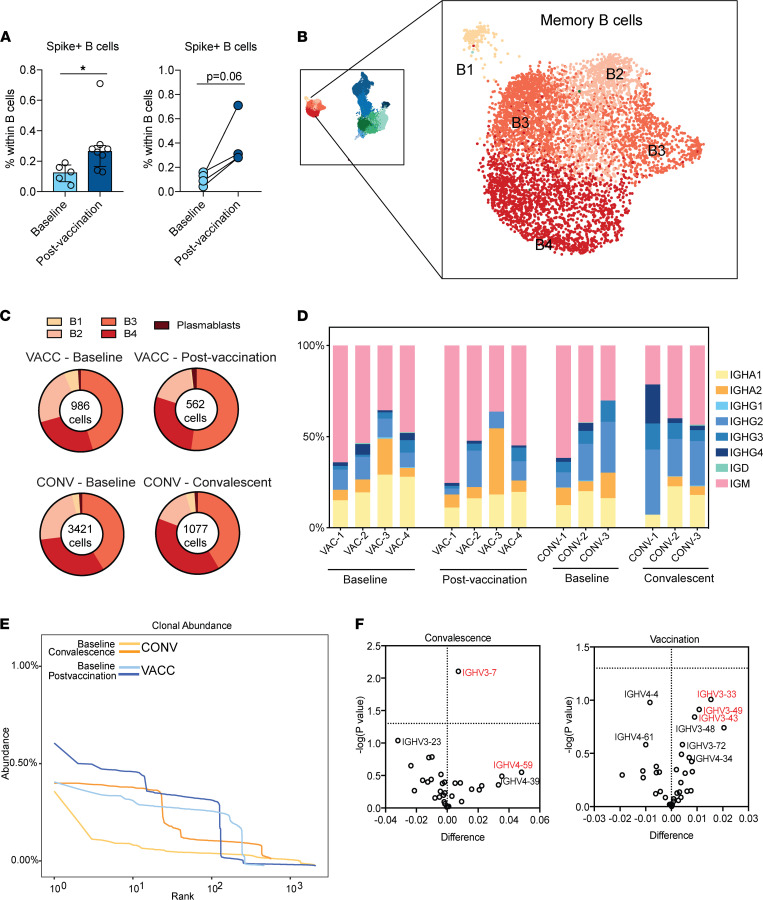
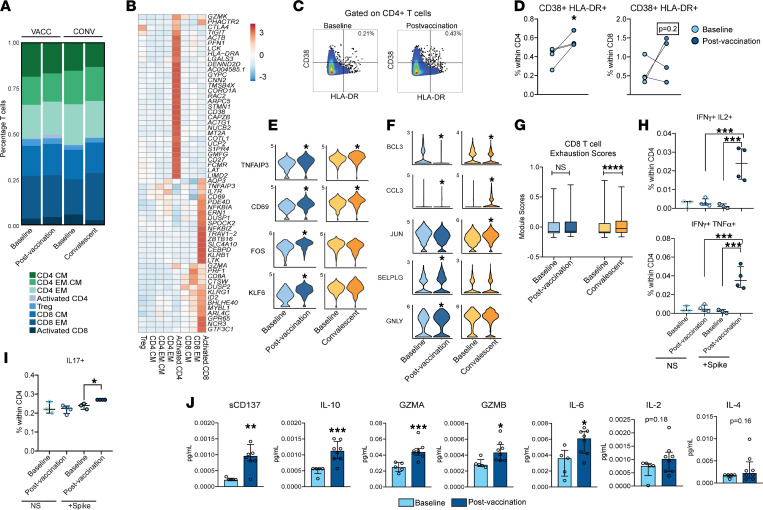
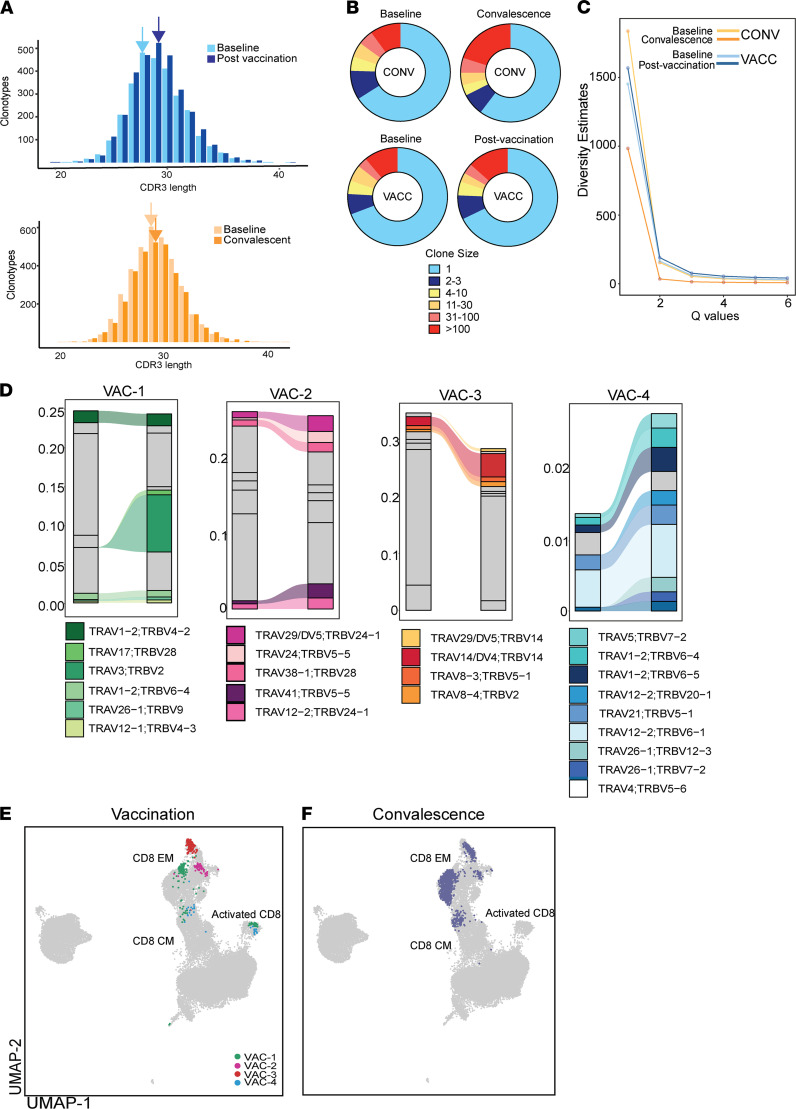
mRNA vaccines for SARS-CoV-2 have shown exceptional clinical efficacy, providing robust protection against severe disease. However, our understanding of transcriptional and repertoire changes following full vaccination remains incomplete. We used scRNA-Seq and functional assays to compare humoral and cellular responses to 2 doses of mRNA vaccine with responses observed in convalescent individuals with asymptomatic disease. Our analyses revealed enrichment of spike-specific B cells, activated CD4+ T cells, and robust antigen-specific polyfunctional CD4+ T cell responses following vaccination. On the other hand, although clonally expanded CD8+ T cells were observed following both vaccination and natural infection, CD8+ T cell responses were relatively weak and variable. In addition, TCR gene usage was variable, reflecting the diversity of repertoires and MHC polymorphism in the human population. Natural infection induced expansion of CD8+ T cell clones that occupy distinct clusters compared to those induced by vaccination and likely recognize a broader set of viral antigens of viral epitopes presented by the virus not seen in the mRNA vaccine. Our study highlights a coordinated adaptive immune response in which early CD4+ T cell responses facilitate the development of the B cell response and substantial expansion of effector CD8+ T cells, together capable of contributing to future recall responses.

Keywords: Adaptive immunity; COVID-19; T cell receptor; T cells; Vaccines.


Figures

Figure 1
Figure 1. Immunological changes with SARS-CoV-2 mRNA vaccination.
(A) Experimental design for the study. Blood was collected from SARS-CoV-2–naive individuals before vaccination, 2 weeks after dose 1, and 2 weeks after prime-boost vaccination (VACC group) or in SARS-CoV-2–exposed but asymptomatic individuals (CONV group) before and after convalescence. Immune phenotypes of PBMCs and antigen-specific T and B cell responses were measured using multicolor flow cytometry. Longitudinal serological responses to the vaccine were measured using ELISA and neutralization assays. Memory T and B cells from a subset of PBMC samples (n = 4/group for vaccine volunteers, n = 3/group for convalescent health care workers, matched) were profiled using scRNA-Seq at baseline (before vaccination) or after vaccination time points. (B) UMAP projection of 32,867 memory T and B cells with major subsets annotated. (C) Violin plots of key gene markers used for cluster annotations. Normalized transcript counts are shown on the y axis.
Figure 2
Figure 2. B cell adaptations following SARS-CoV-2 mRNA vaccination and infection.
(A) Dot plots representing expansion of spike+ cells within total CD20+ B cells in PBMCs before and after vaccination (aggregate differences at baseline, n = 5, and following vaccination, n = 8, on the left; matched differences on the right, n = 4). PBMCs were incubated with biotinylated spike protein and fluorochrome-conjugated streptavidin, surface stained, washed, and analyzed using flow cytometry. Group differences were tested using unpaired t test with Welch’s correction (left) or paired t test (right). Error bars denote medians and interquartile ranges. (B) Magnified image of B cell subsets identified using scRNA-Seq. Data include samples from all 4 groups. (C) Pie chart quantifying B cell cluster frequencies after infection and vaccination. (D) Isotype distribution of productive B cell clones in vaccinated (n = 4) and convalescent (n = 3) individuals. Isotypes were determined based on the constant region of the clone. (E) Aggregate clonal abundance following vaccination and infection. (F) Volcano plots depicting heavy chain gene usage biases following convalescence (relative to preinfection baseline) or vaccination (relative to prevaccination baseline). The x axis represents the change in gene usage, and the y axis represents P value (–log10). *P < 0.05.
Figure 3
Figure 3. T cell adaptations with SARS-CoV-2 mRNA vaccination.
(A) Stacked bar graph comparing the distribution of memory CD4+ and CD8+ T cells across each group, reported as percentage of total cells. (B) Clustered heatmap comparing aggregate top markers from each of the memory T cell clusters. Colors represent normalized transcript levels, ranging from low (in blue) to high (in red). (C) Gating strategy for identification of activated CD4+ and CD8+ T cells before and after vaccination. (D) Frequencies of CD38+HLA-DR+ CD4+ and CD8+ T cells following vaccination (n = 4/group). (E and F) Violin plots comparing key genes differentially expressed in (E) activated CD8+ and (F) CD8+ EM subsets either with convalescence and/or vaccination. (G) Box plot comparing exhaustion scores within CD8+ T cells with convalescence and/or vaccination. Lines indicate quartiles and median scores. (H) Polyfunctional CD4+ T cell (Th1) and (I) Th17 responses following overnight stimulation with SARS-CoV-2 spike–overlapping peptide pool, measured using intracellular cytokine staining at baseline (n = 3) and following vaccination (n = 4). (J) Secreted levels of soluble costimulatory molecule (sCD137), cytokines (IL-10, IL-6, IL-2, and IL-4), and effector molecules (granzyme A and granzyme B) in CD4+ T cells at baseline (n = 5) or following mRNA vaccination (n = 8). Two-way comparisons were tested using either paired test for matched comparisons or unpaired t test with Welch’s correction for group comparisons. Four-way comparisons were tested using 1-way ANOVA followed by Holm-Šidák multiple-hypothesis correction. Error bars denote medians and interquartile ranges. *P < 0.05; **P < 0.01; ***P < 0.001; ****P < 0.0001.
Figure 4
Figure 4. Clonal expansion of T cells following SARS-CoV-2 mRNA vaccination and infection.
(A) CDR3 distribution of T cell clones following vaccination (top) and infection (bottom). Arrows highlight shifts in peak CDR3 lengths. (B) Pie chart representations of distribution of T cell clone sizes following vaccination and infection. (C) Diversity profiles of T cells following vaccination (n = 4, 2 time points) and infection (n = 3, 2 time points). The y axis represents Hill diversity, interpreted as the effective number of clonotypes within the data set. (D) Clonotype tracking in 4 volunteers for 2 weeks following the second dose of mRNA vaccine. Only the top 10 clones after vaccination with evidence of clonal expansion following vaccination are highlighted. (E and F) UMAP projection of the top 10 expanded clones following (E) vaccination (each participant is highlighted) and (F) convalescence.

References

    1. Carvalho T, et al. The first 12 months of COVID-19: a timeline of immunological insights. Nat Rev Immunol. 2021;21(4):245–256. doi: 10.1038/s41577-021-00522-1. - DOI - PMC - PubMed
    1. Pardi N, et al. Nucleoside-modified mRNA vaccines induce potent T follicular helper and germinal center B cell responses. J Exp Med. 2018;215(6):1571–1588. doi: 10.1084/jem.20171450. - DOI - PMC - PubMed
    1. Wang X. Safety and efficacy of the BNT162b2 mRNA Covid-19 vaccine. N Engl J Med. 2021;384(16):1577–1578. - PubMed
    1. Widge AT, et al. Durability of responses after SARS-CoV-2 mRNA-1273 vaccination. N Engl J Med. 2021;384(1):80–82. doi: 10.1056/NEJMc2032195. - DOI - PMC - PubMed
    1. Thomas SJ, et al. Safety and efficacy of the BNT162b2 mRNA Covid-19 vaccine through 6 months. N Engl J Med. doi: 10.1056/NEJMoa2110345. [published online September 15, 2021]. - DOI - PMC - PubMed

Publication types

MeSH terms