. 2022 Feb 7;219(2):e20201966.
doi: 10.1084/jem.20201966. Epub 2021 Dec 22.

TCR signal strength defines distinct mechanisms of T cell dysfunction and cancer evasion

Affiliations

TCR signal strength defines distinct mechanisms of T cell dysfunction and cancer evasion

Mojdeh Shakiba et al. J Exp Med. .

Abstract

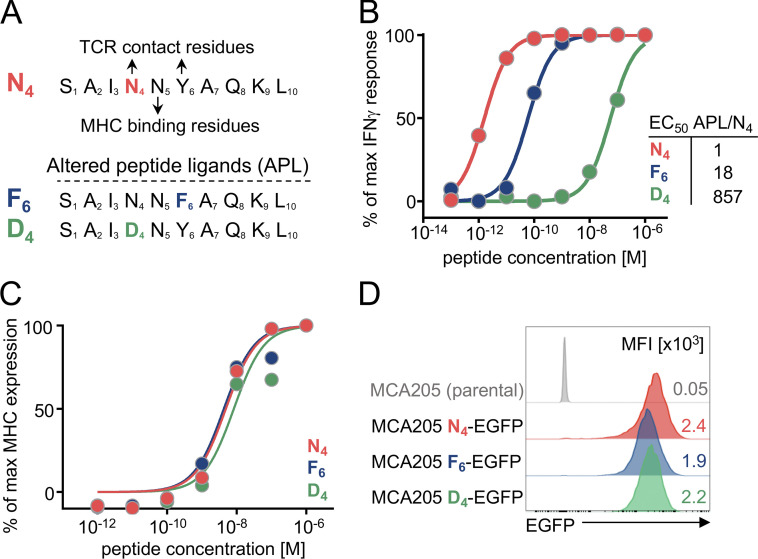
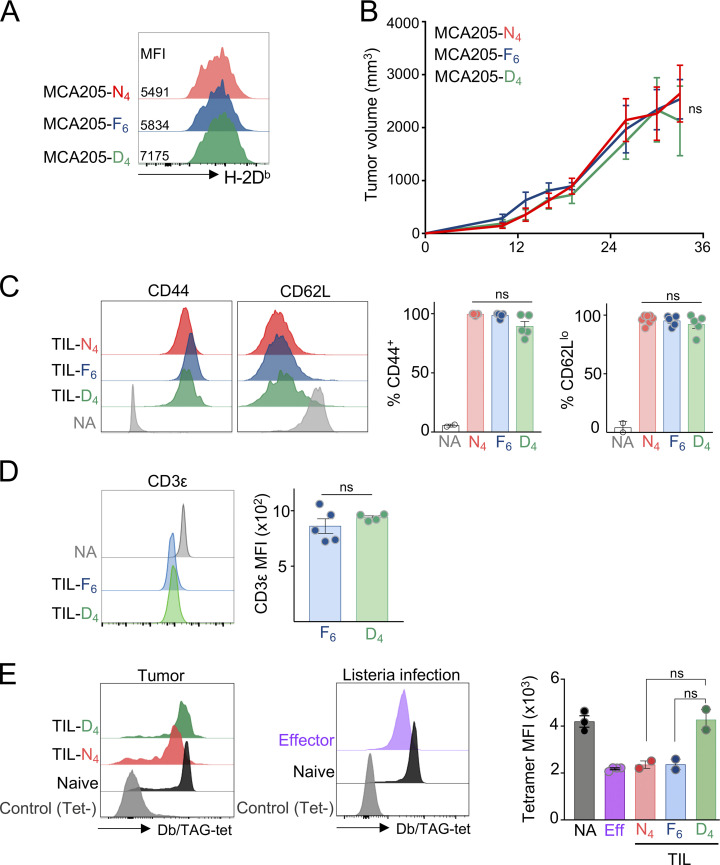
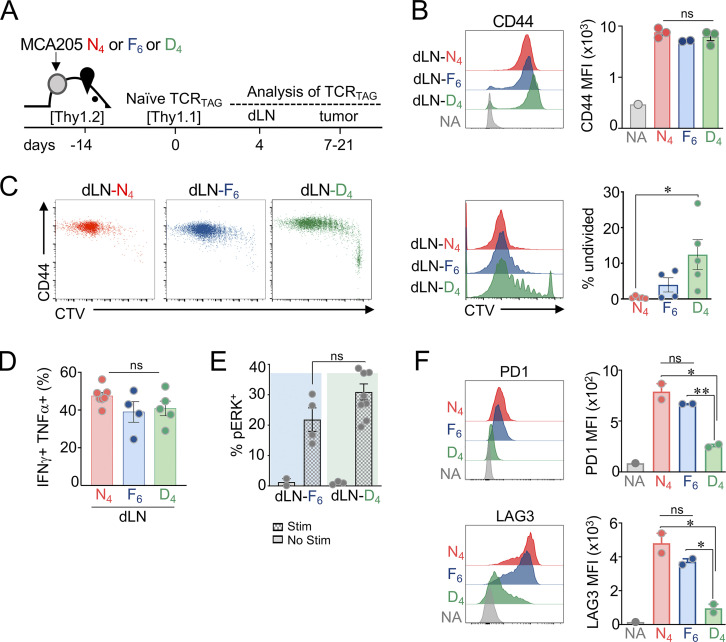
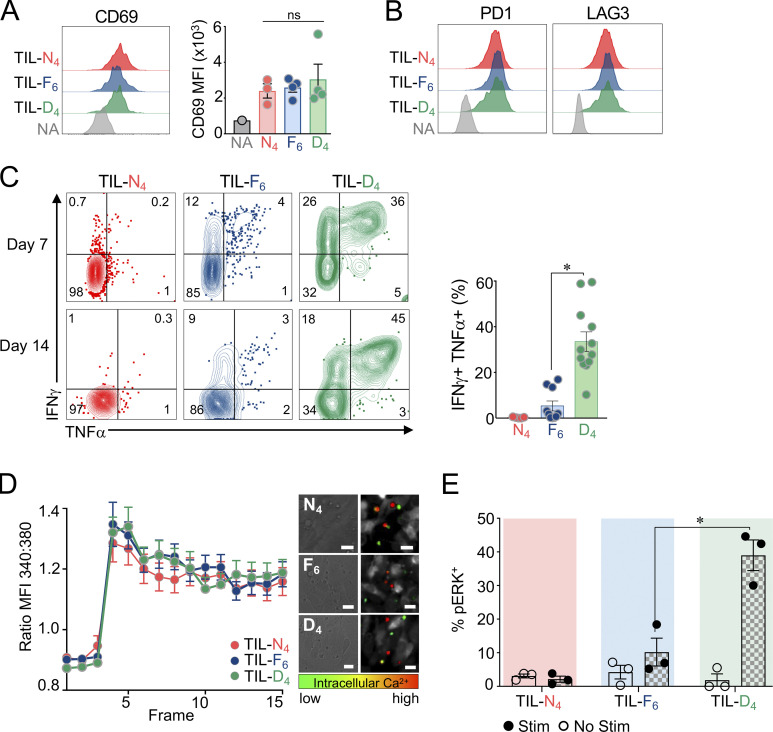
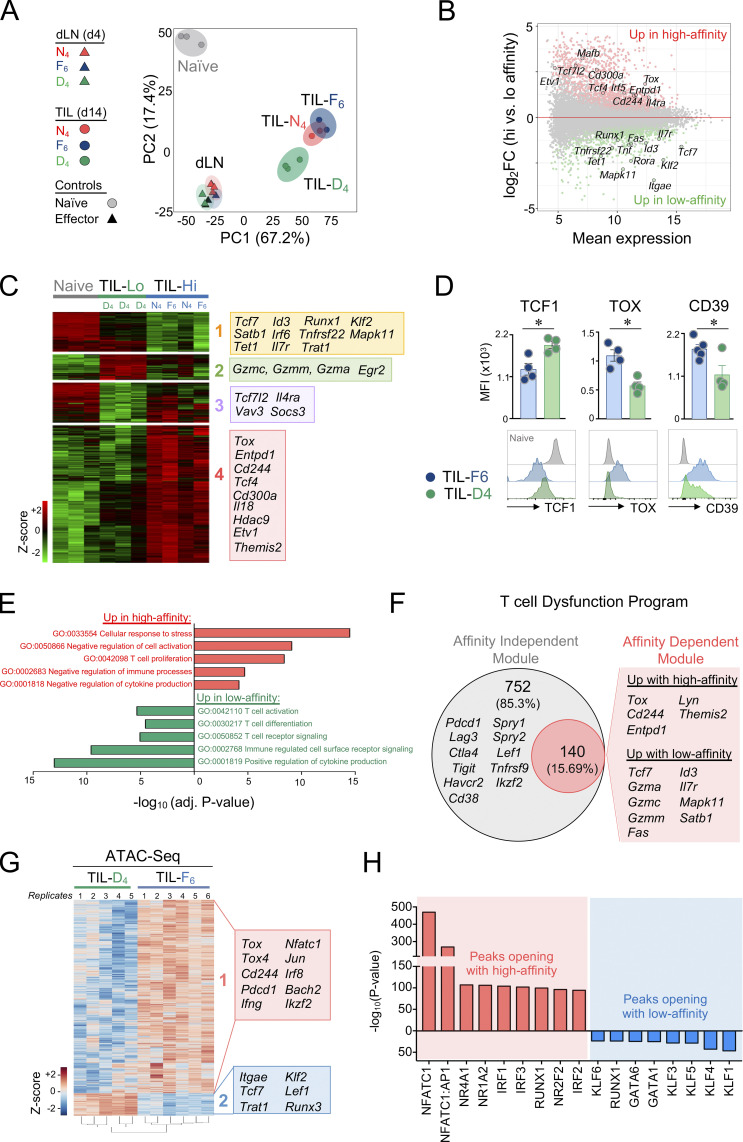
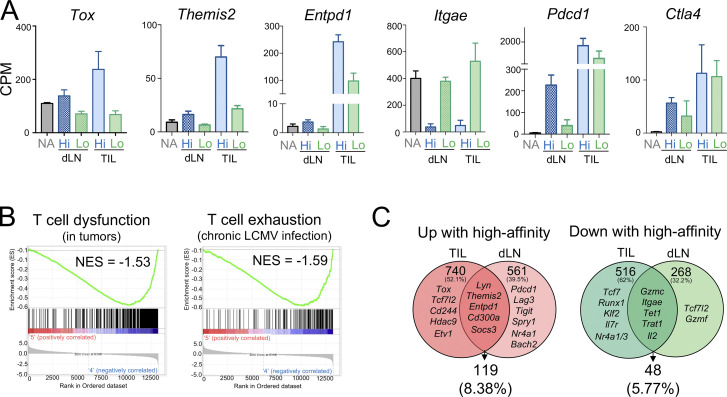
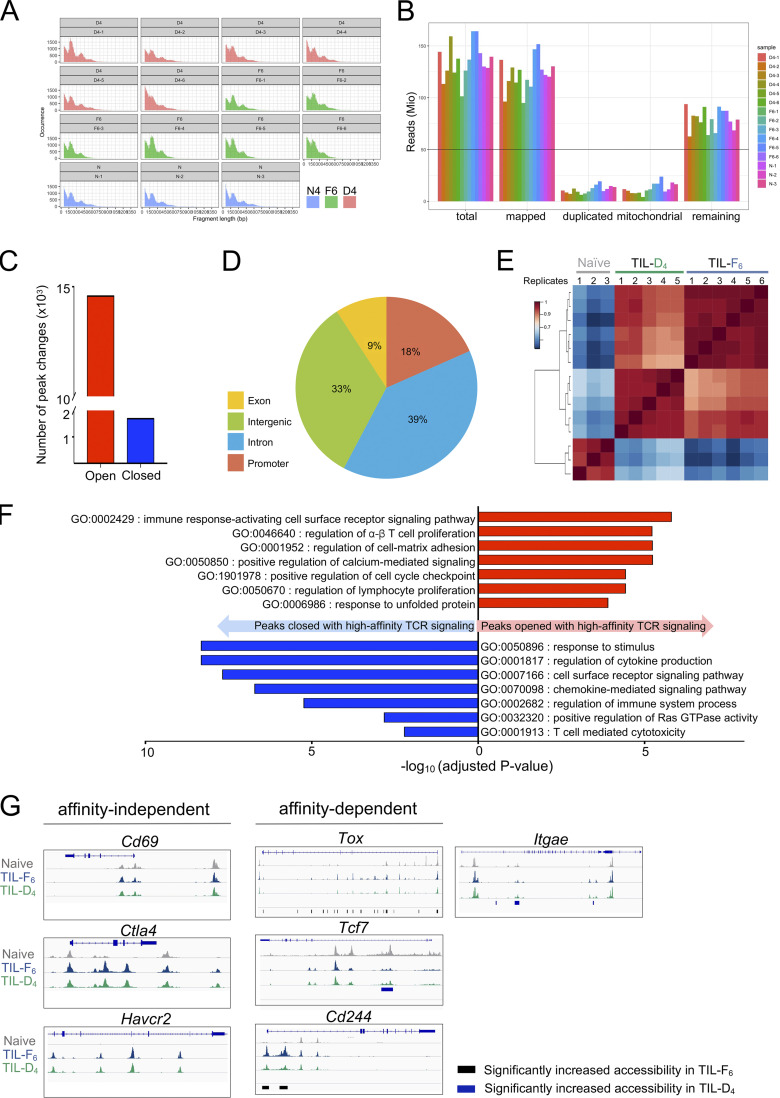
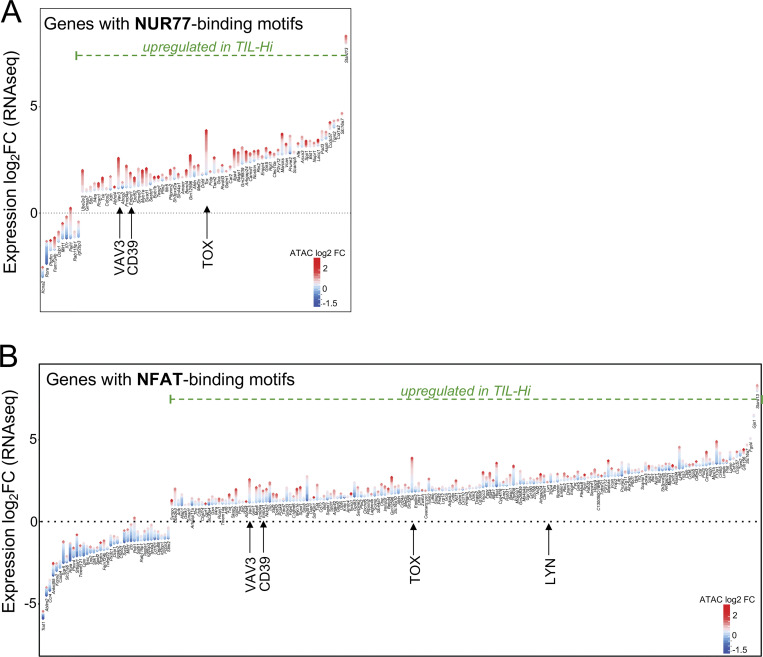
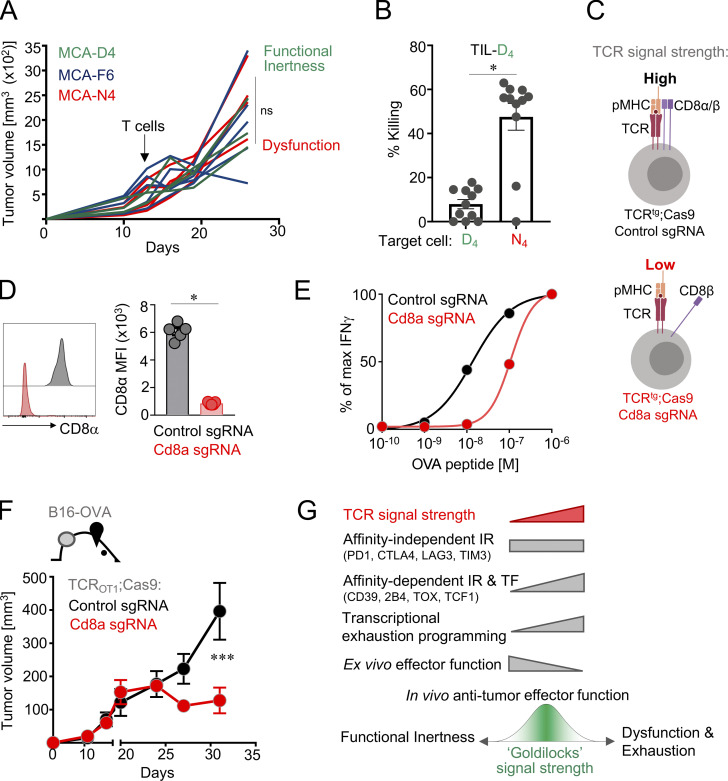
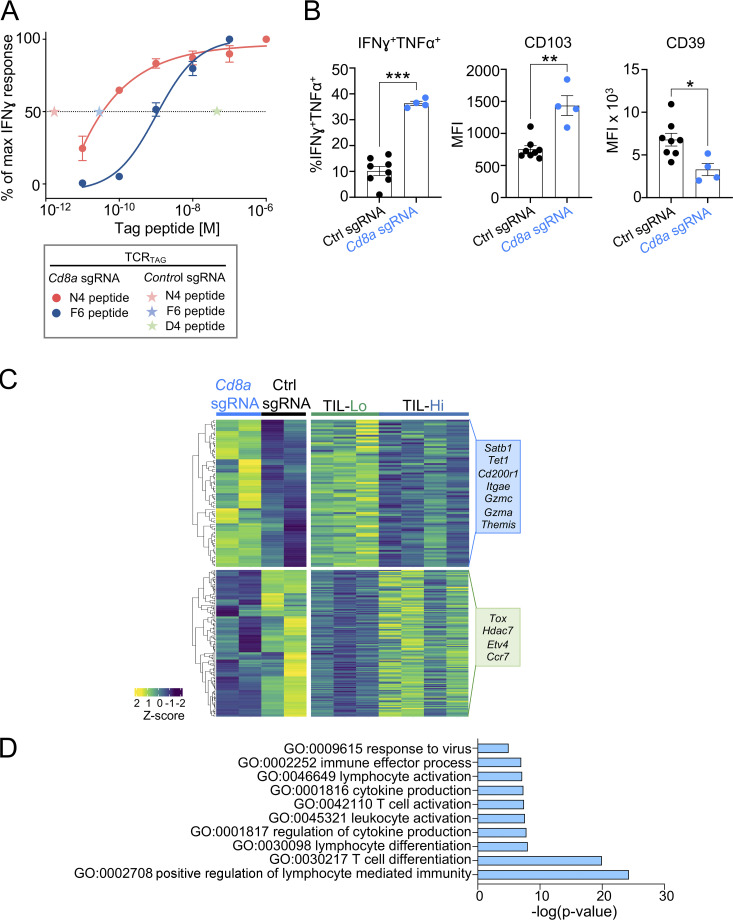
T cell receptor (TCR) signal strength is a key determinant of T cell responses. We developed a cancer mouse model in which tumor-specific CD8 T cells (TST cells) encounter tumor antigens with varying TCR signal strength. High-signal-strength interactions caused TST cells to up-regulate inhibitory receptors (IRs), lose effector function, and establish a dysfunction-associated molecular program. TST cells undergoing low-signal-strength interactions also up-regulated IRs, including PD1, but retained a cell-intrinsic functional state. Surprisingly, neither high- nor low-signal-strength interactions led to tumor control in vivo, revealing two distinct mechanisms by which PD1hi TST cells permit tumor escape; high signal strength drives dysfunction, while low signal strength results in functional inertness, where the signal strength is too low to mediate effective cancer cell killing by functional TST cells. CRISPR-Cas9-mediated fine-tuning of signal strength to an intermediate range improved anti-tumor activity in vivo. Our study defines the role of TCR signal strength in TST cell function, with important implications for T cell-based cancer immunotherapies.


Conflict of interest statement

Disclosures: N.A. Defranoux reports personal fees from Alector outside the submitted work. M.D. Hellman receives institutional research funding from Bristol-Myers Squibb; has been a compensated consultant for Merck, Bristol-Myers Squibb, AstraZeneca, Genentech/Roche, Nektar, Syndax, Mirati, Shattuck Labs, Immunai, Blueprint Medicines, Achilles, and Arcus; received travel support/honoraria from AstraZeneca, Eli Lilly, and Bristol-Myers Squibb; has options from Factorial, Shattuck Labs, Immunai, and Arcus; reported personal fees from Adicet, DaVolterra, Genzyme/Sanofi, Janssen, Immunai, Instil Bio, Mana Therapeutics, Natera, Pact Pharms, Chattuck Labs, and Regenron out side the submitted work; and has a patent filed by his institution related to the use of tumor mutation burden to predict response to immunotherapy (PCT/US2015/062208), which has received licensing fees from PGDx. D.K. Wells is a founder, equity holder, and receives advisory fees from Immunai. No other disclosures were reported.

Figures

Figure 1.
Figure 1.
Generation of the SV40 TAG APL tumor model. (A) TAG APLs were generated through single-amino-acid substitutions of the TCR contact residues of the native TAG peptide (N4, red) at positions 4 and 6, generating F6 (blue) and D4 (green) APLs. (B) Functional avidity measured as IFN-γ production by effector TAG-specific CD8+ T cells (TCRTAG cells) after 4-h stimulation with antigen-presenting cells pulsed with the indicated peptide concentrations. The ratio of APL peptide concentration required to induce half-maximum IFN-γ response (EC50) relative to native N4 peptide is shown. Data are represented as mean of n = 2 technical replicates per condition and representative of two independent experiments. (C) Dose–response curves of surface expression of MHC class I (H-2Db) on RMA-S cells incubated with N4, F6, or D4 peptides at the indicated concentrations. Data show mean of n = 2 technical replicates per condition and are representative of two independent experiments. Value points for the highest peptide concentration (10−6 M) reach y = 100% and are masked by the N4 peptide. (D) EGFP expression levels of MCA205 N4-, F6-, and D4-EGFP tumor cells; parental MCA205 cell line is shown in gray. Inset numbers represent mean fluorescence intensity (MFI) of EGFP. Data are representative of two independent experiments.
Figure S1.
Figure S1.
MCA205 APL tumor model. (A) Flow cytometric analysis of MHC class I (H-2Db) expression of MCA-APL cell lines. Histograms are gated on APL-EGFP–expressing MCA205 cancer cells. Data are representative of two independent experiments. Inset numbers show MFI. (B) Tumor outgrowth of MCA-APL cell lines in TCROT1 hosts. Data show mean ± SEM of n = 5–8 mice per APL; ns, three-way ANOVA. (C–E) Phenotypic characterization of TIL-TCRTAG cells isolated from MCA-APL tumors. Flow cytometric analysis of CD44, CD62L (C), CD3ε (D), and TCR expression levels through tetramer staining (E) of TIL-TCRTAG cells isolated 14 d after AT into MCA-APL tumor-bearing hosts. Each symbol represents an individual mouse. NA, naive TCRTAG; control, tetramer-negative (Tet) endogenous CD8+ T cells; Eff, TCRTAG effector CD8 T cells at the peak of response 5 d after Listeria (LmTAG) infection. Data are representative of two independent experiments. Data show mean ± SEM; ns, unpaired two-tailed Student’s t test.
Figure 2.
Figure 2.
Low- and high-affinity interactions lead to robust activation and differentiation of naive TST cells in dLNs. (A) Experimental scheme. MCA-APL cell lines were injected subcutaneously into TCROT1 (Thy1.2) mice. 2 wk later, naive, CTV-labeled congenically marked (Thy1.1+) TCRTAG cells were adoptively transferred. Transferred T cells were reisolated from dLN and tumors at indicated time points. (B) CD44 expression levels of TCRTAG from dLN (MFI shown for dividing cells). n = 2–3 per APL; data are representative of three independent experiments. (C) CTV dilution and CD44 expression of TCRTAG cells isolated from dLN of APL tumor-bearing mice. Percentages of undivided TCRTAG cells (CTVhi) are shown (right). (D) Production of effector cytokines IFN-γ and TNF-α by TCRTAG cells isolated from dLN and stimulated with N4 peptide (0.5 µg/ml). Each symbol represents an individual mouse. For C and D, n = 4–5 per APL; data are representative of three independent experiments. (E) Flow cytometric analysis of phospho-ERK (pERK) by TCRTAG cells isolated 4 d after AT from dLN of MCA-F6 (dLN-F6) and MCA-D4 (dLN-D4) tumor-bearing mice. T cells were simulated ex vivo with MCA-N4 tumor cells (see Materials and methods). Each circle is an individual mouse. n = 4 for dLN-F6, and n = 9 for dLN-D4. Data are representative of two independent experiments. (F) PD1 and LAG3 expression levels on TCRTAG cells from dLN (n = 2 per APL). Data are representative of two independent experiments. (B–F) Data are shown as mean ± SEM. *, P < 0.05; **, P < 0.01; ns, P > 0.05; unpaired two-tailed Student’s t test.
Figure 3.
Figure 3.
Tumor-infiltrating TST cells encountering low-affinity antigens preserve a cell-intrinsic functional state. (A) CD69 expression levels on TCRTAG isolated from MCA-APL tumors 14 d after AT. Data are representative of two independent experiments with n = 3–5 per APL. (B) PD1 and LAG3 expression levels by tumor-infiltrating TCRTAG cells (TILs) 14 d after AT. Data are representative of four independent experiments (n = 4–6 per APL). (C) Intracellular IFN-γ and TNF-α production of TCRTAG TILs isolated from APL tumors 7 (top) and 14 (bottom) d after AT, assessed after 4-h peptide stimulation with N4 peptide (0.5 µg/ml). Each symbol represents an individual mouse (n = 4–5 per APL). Data are representative of four independent experiments. (D) Calcium flux of TCRTAG TILs isolated from MCA-APL tumors 14 d after AT and loaded with the calcium-sensing dye Fura-2AM. Time-lapse microscopy was performed with T cells encountering MCA-N4 tumor cells. Shown is the ratio of the emission at 340 nm to 380 nm. Data are shown as mean ± SEM and are representative of two independent experiments (n = 20–50 cells per condition). (E) Flow cytometric analysis of phospho-ERK (pERK) by TCRTAG TIL (isolated 14 d after AT) following TCR stimulation with MCA-N4 tumor cells. n = 3 per APL. (A–E) Data are shown as mean ± SEM. *, P < 0.001, unpaired two-tailed Student’s t test.
Figure 4.
Figure 4.
TCR signal strength drives distinct transcriptional and epigenetic programs in TST cells. (A) TCRTAG cells isolated from dLN (4 d after AT) and tumors (14 d after AT) were subjected to RNA-seq; naive TCRTAG and effector TCRTAG cells isolated from LN 4 d after infection with a L. monocytogenes strain expressing TAG (N4) epitope were used as controls. Principal-component (PC) analysis of RNA-seq data. Each symbol represents a biological replicate, and each component is indicated with the amount of variation that it explains. (B) MA plot of RNA-seq data showing the relationship between average expression and expression changes between high-affinity TIL-N4/F6 and low-affinity TIL-D4. Statistically significantly DEGs are shown in red and green, with select genes highlighted for reference. (C) Hierarchical clustering of genes differentially expressed (log2 fold change >1, false discovery rate <0.1) in high-affinity TILs (from MCA205-N4 and MCA205-F6 tumors; TIL-Hi) versus low-affinity TILs (from MCA205-D4; TIL-Lo). Expression in naive TCRTAG cells is shown as a control. Selected genes within each cluster are shown. (D) TCF1, TOX, and CD39 expression levels from TIL-F6 and TIL-D4 14 d after AT (n = 4–5 biological replicates per APL). All values are mean ± SEM. *, P < 0.05, unpaired two-tailed Student’s t test. (E) Selected GO terms enriched in genes up-regulated in response to high-affinity (red) or low-affinity (green) TCR stimulation in TILs. (F) Affinity-dependent (red) and affinity-independent (gray) modules of the tumor-specific T cell dysfunction program. Select genes of each module are highlighted. (G) Heatmap of log2-transformed normalized read counts per regions with differential chromatin accessibility comparing TIL-F6 and TIL-D4. Genes associated with the two major clusters are highlighted. (H) Top 17 most-significantly enriched transcription factor motifs in peaks with increased accessibility in high-affinity TIL-F6 (red) or low-affinity TIL-D4 (blue).
Figure S2.
Figure S2.
TCR affinity drives distinct molecular programs of tumor-specific T cells. (A) mRNA expression levels of select genes in TCRTAG isolated from the dLN (day 4 after AT) and tumors (TILs; day 10–14 after AT) from high-affinity (blue) or low-affinity (green) MCA-APL tumor-bearing mice. Expression in naive (NA) TCRTAG cells is shown as control. (B) Enrichment of gene sets described for tumor-specific T cell dysfunction (from Philip et al., 2017; left), and T cell exhaustion during chronic viral infection (from West et al., 2011 [GSE30962]; right) in TIL-Lo. NES, normalized enrichment score. (C) Venn diagrams showing the degree of overlap between genes up- or down-regulated in TCRTAG isolated from dLN or tumors (TILs). Examples of genes in each category are shown.
Figure S3.
Figure S3.
Chromatin accessibility changes in response to varying TCR signal strength in TST cells. (A and B) Quality control plots for ATAC-seq samples. (A) Fragment length distribution plots (base pairs on x axis and read count on y axis). (B) Number of aligned reads per sample showing the number remaining after mapping and removing duplicated and nonmitochondrial reads. The ENCODE guideline is indicated by the horizontal line. (C) Number of chromatin accessibility changes in TIL encountering high- versus low-affinity tumor antigen. (D) Pie chart showing the proportion of reproducible ATAC-seq peaks in exonic, intronic, intergenic, and promoter regions. (E) Correlation heatmap of peaks that are differentially accessible (false discovery rate <0.05) between TIL-F6 versus TIL-D4. (F) Selected GO terms enriched in peaks opened (red) or closed (blue) in response to high-affinity TCR stimulation in TILs. (G) ATAC-seq signal profiles of loci of affinity-dependent genes, including Tox, Tcf7, Cd244, and Itgae, and affinity-independent genes, including Cd69, Ctla4, and Havcr2. Vertical bars at the bottom of each plot represent regions with statistically significant changes in accessibility in TIL-F6 versus TIL-D4.
Figure S4.
Figure S4.
Transcription factor binding motif analysis for peaks with differential accessibility based on TCR signal strength. (A and B) Gains and losses of regulatory elements for the most DEGs containing NUR77 (A) or NFAT (B) binding motifs. Plots are divided into top and bottom genes with the highest and lowest respective log2 fold change (FC) of gene expression (shown on the y axis). Each gene is illustrated by a stack of diamonds representing peaks gained (red) or lost (blue) in high-affinity TILs.
Figure 5.
Figure 5.
Optimal anti-tumor efficacy requires an intermediate range of TCR signal strength. (A) Tumor outgrowth of MCA-APL tumor-bearing mice receiving AT of naive TCRTAG cells at day 14. Data show mean ± SEM of n = 5–7 mice per APL. ns, three-way ANOVA. Data are representative of two independent experiments. (B) Functional inertness of TIL-D4. TIL-D4 fail to kill D4 targets but can eliminate N4 targets. TIL-D4 were sorted from MCA-D4 tumors 10 d after AT and incubated with MCA-D4 or MCA-N4 tumor cells in vitro at a 1:10 effector to target ratio. Killing of tumor cells was assessed 18 h later by flow cytometry (see Materials and methods for technical details). Each circle represents an individual mouse (n = 11). Values are mean ± SEM. *, P < 0.0001, unpaired two-tailed Student's t test. Data are representative of two independent experiments. (C) CRISPR-Cas9–mediated deletion of Cd8a in high-affinity Cas9;TCRtg T cells to partially lower TCR signal strength. (D) CD8α expression on TCROTI;Cas9 T cells transduced with Cd8a sgRNA (red) or control sgRNA (black) and reisolated at 30 d after AT into B16-OVA tumor-bearing hosts. Values are mean ± SEM. Each symbol represents an individual mouse. *, P < 0.01, unpaired two-tailed Student's t test. Data are representative of two independent experiments. (E) Functional avidity measured as production of IFN-γ by TCROT1;Cas9 T cells transduced with Cd8a sgRNA (red) or control sgRNA (black) after 4-h stimulation with SIINFEKL peptide at the indicated concentrations. Data represent mean of technical replicates n = 2 and are representative of two independent experiments. (F) Lowering TCR signal strength through CRISPR-Cas9–mediated deletion of Cd8a in TCROTI enhances anti-tumor efficacy in vivo. B16-OVA tumor outgrowth in B6 mice that received congenically marked CD8 T cells (Thy1.1/Thy1.2) from TCROTI;Cas9 mice transduced with Cd8a or control sgRNA, sorted based on CD8α and sgRNA reporter (red fluorescence protein) expression and treated with anti-PD1 and anti-PDL1 antibodies, starting 4 d after T cell transfer, every other day. Data are representative of two independent experiments (n = 6 mice). Values are mean ± SEM. Significance was calculated by two-way ANOVA. (G) Summary and conclusions of the study. Phenotypic, functional, and transcriptional characteristics of TST cells encountering antigens with distinct TCR signal strength. TF, transcription factor. We propose a Goldilocks signal strength range that allows effective anti-tumor immunity in vivo. TST cells with affinity beyond this range are dysfunctional due to exhaustion (for high-affinity TST cells) or functionally inert (for T cells specific to low-affinity neoantigens and tumor/self-antigens). Affinity tuning for immunotherapeutic interventions through lowering signal strength of high-affinity TST cells or high-affinity chimeric antigen receptor T cells or signal strength enhancement of low-affinity T cells could result in increased anti-tumor effector function.
Figure S5.
Figure S5.
Lowering TCR signal strength of high-affinity TCRTAG enhances anti-tumor effector function. (A) Functional avidity measured as production of IFN-γ by TCRTAG;Cas9 CD8 T cells deficient of Cd8a (transduced with Cd8a sgRNA) after 4-h stimulation with N4 (red) or F6 (blue) peptides at the indicated concentrations. EC50 of control CD8α-sufficient TCRTAG (transduced with control sgRNA) encountering each APL is shown with asterisks. Data represent mean of technical replicates (n = 2) and two independent experiments. (B) TCRTAG cells were transduced with either Cd8α-targeting or control sgRNA to generate CD8α-deficient (blue) or CD8α-sufficient control (black) TCRTAG T cells. CD8α-deficient or control TCRTAG cells were injected into MCA-F6 tumor-bearing mice. Ex vivo cytokine production and expression levels of CD103 and CD39 of TCRTAG cells isolated from tumors were assessed 10–11 d after transfer. MCA-F6 tumor cells were used in this experiment, because the EC50 of CD8α-deficient T cells to F6 is between that of the CD8α-sufficient control to D4 and F6. Each dot represents an individual mouse. Values are mean ± SEM. Significance is calculated by Student’s t test. *, P < 0.05; **, P < 0.01; ***, P < 0.001. (C) Hierarchical clustering of genes differentially expressed (log2 fold change >1) both in CD8α-deficient TCRTAG cells versus control cells and in low-affinity TILs (TCRTAG cells isolated from MCA205-D4; TIL-Lo) versus high-affinity TILs (TCRTAG cells isolated from MCA205-N4 and MCA205-F6 tumors; TIL-Hi). Selected genes within each cluster are shown. (D) Selected GO terms enriched in genes up-regulated in CD8α-deficient TCRTAG TILs.

Comment in

  • Goldilocks and the three TILs.
    Dada H, Dustin ML. Dada H, et al. J Exp Med. 2022 Feb 7;219(2):e20212269. doi: 10.1084/jem.20212269. Epub 2022 Jan 12. J Exp Med. 2022. PMID: 35020792 Free PMC article.

References

    1. Aleksic, M., Liddy N., Molloy P.E., Pumphrey N., Vuidepot A., Chang K.M., and Jakobsen B.K.. 2012. Different affinity windows for virus and cancer-specific T-cell receptors: implications for therapeutic strategies. Eur. J. Immunol. 42:3174–3179. 10.1002/eji.201242606 - DOI - PMC - PubMed
    1. Altan-Bonnet, G., and Germain R.N.. 2005. Modeling T cell antigen discrimination based on feedback control of digital ERK responses. PLoS Biol. 3:e356. 10.1371/journal.pbio.0030356 - DOI - PMC - PubMed
    1. Andrews, S. 2010. FastQC: a quality control tool for high throughput sequence data. http://www.bioinformatics.babraham.ac.uk/projects/fastqc.
    1. Artyomov, M.N., Lis M., Devadas S., Davis M.M., and Chakraborty A.K.. 2010. CD4 and CD8 binding to MHC molecules primarily acts to enhance Lck delivery. Proc. Natl. Acad. Sci. USA. 107:16916–16921. 10.1073/pnas.1010568107 - DOI - PMC - PubMed
    1. Azizi, E., Carr A.J., Plitas G., Cornish A.E., Konopacki C., Prabhakaran S., Nainys J., Wu K., Kiseliovas V., Setty M., et al. . 2018. Single-Cell Map of Diverse Immune Phenotypes in the Breast Tumor Microenvironment. Cell. 174:1293–1308 e36. 10.1016/j.cell.2018.05.060 - DOI - PMC - PubMed

Publication types

MeSH terms