. 2022 Jan;112(1):169-178.
doi: 10.2105/AJPH.2021.306565.

Adherence to Social-Distancing and Personal Hygiene Behavior Guidelines and Risk of COVID-19 Diagnosis: Evidence From the Understanding America Study

Affiliations

Adherence to Social-Distancing and Personal Hygiene Behavior Guidelines and Risk of COVID-19 Diagnosis: Evidence From the Understanding America Study

Theresa Andrasfay et al. Am J Public Health. 2022 Jan.

Abstract

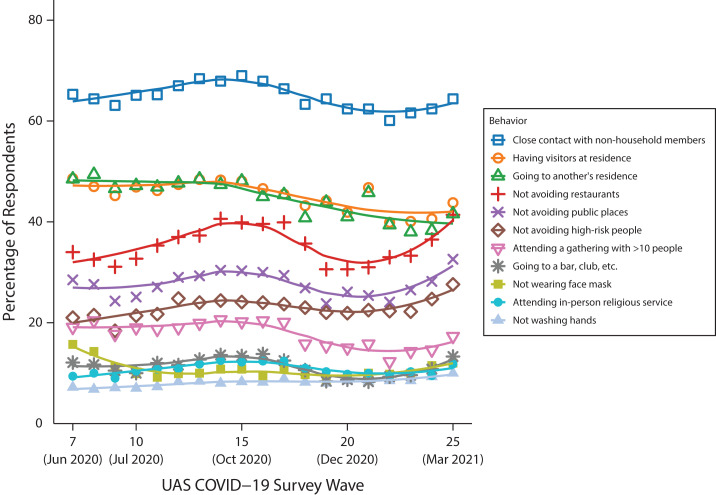
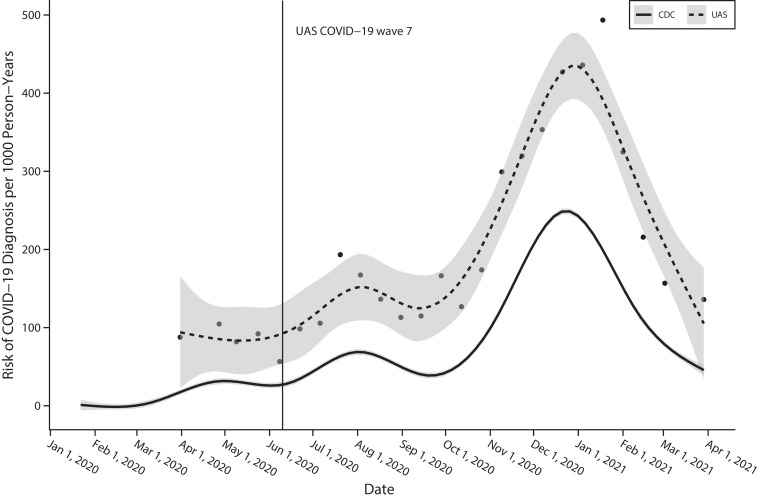
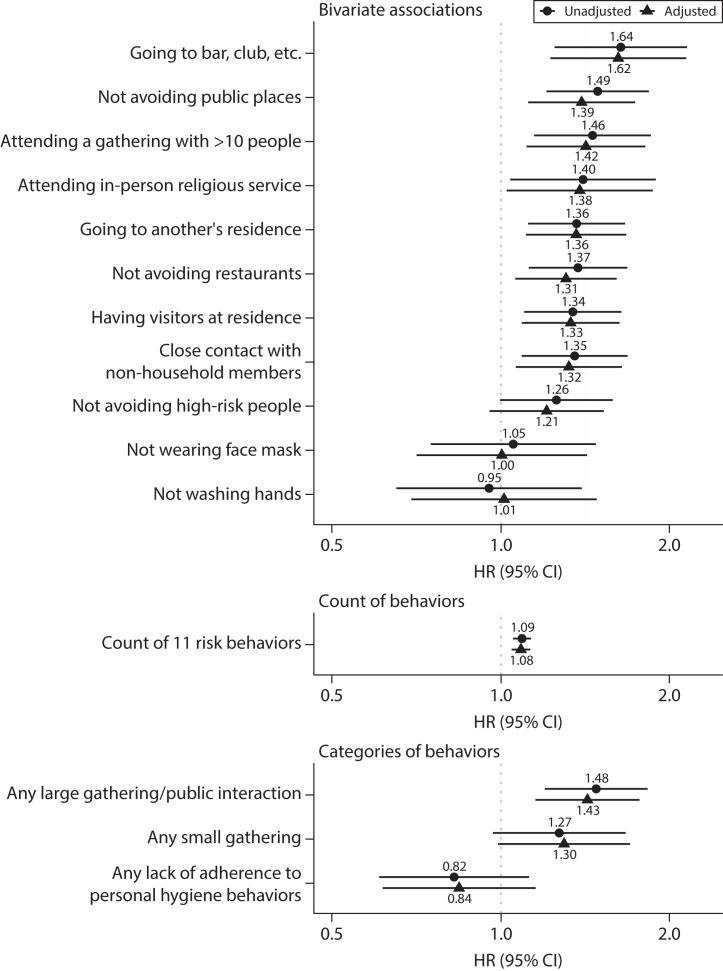
Objectives. To assess the association between individual-level adherence to social-distancing and personal hygiene behaviors recommended by public health experts and subsequent risk of COVID-19 diagnosis in the United States. Methods. Data are from waves 7 through 26 (June 10, 2020-April 26, 2021) of the Understanding America Study COVID-19 survey. We used Cox models to assess the relationship between engaging in behaviors considered high risk and risk of COVID-19 diagnosis. Results. Individuals engaging in behaviors indicating lack of adherence to social-distancing guidelines, especially those related to large gatherings or public interactions, had a significantly higher risk of COVID-19 diagnosis than did those who did not engage in these behaviors. Each additional risk behavior was associated with a 9% higher risk of COVID-19 diagnosis (hazard ratio [HR] = 1.09; 95% confidence interval [CI] = 1.05, 1.13). Results were similar after adjustment for sociodemographic characteristics and local infection rates. Conclusions. Personal mitigation behaviors appear to influence the risk of COVID-19, even in the presence of social factors related to infection risk. Public Health Implications. Our findings emphasize the importance of individual behaviors for preventing COVID-19, which may be relevant in contexts with low vaccination. (Am J Public Health. 2022;112(1):169-178. https://doi.org/10.2105/AJPH.2021.306565).


Figures

FIGURE 1—
FIGURE 1—
Percentage of Sample Respondents Engaging in Risk Behaviors at Each Understanding America Study (UAS) COVID-19 Survey Wave in the Study Period: United States, June 10, 2020–April 26, 2021 Note. We calculated percentages using weights provided by the UAS. The points represent the percentage of respondents engaging in the behavior at each wave, and the lines represent smoothed fits of these discrete estimates.
FIGURE 2—
FIGURE 2—
Estimated Risk of COVID-19 Diagnosis in the Understanding America Study (UAS) COVID-19 Survey Compared With CDC Case Data: United States, January 2020–April 2021 Note. CDC = Centers for Disease Control and Prevention. The dots represent the risk of incident COVID-19 diagnosis following each UAS wave, calculated as the number of incident diagnoses divided by the total number of person-years of exposure. The dotted line presents a smoothed fit of these discrete estimates. The vertical line indicates the beginning of wave 7, which was the first wave in our study period. The solid line represents a smoothed fit of the 7-day COVID-19 case rate reported by the CDC COVID Data Tracker. The UAS data included both positive test results and diagnoses by health care providers and were limited to adults 18 years and older. The CDC case data contained individuals of all ages.
FIGURE 3—
FIGURE 3—
Association Between Adherence to Personal Mitigation Behaviors and Risk of COVID-19 Diagnosis: Understanding America Study, United States, June 10, 2020–April 26, 2021 Note. CI = confidence interval; HR = hazard ratio. Results from Cox proportional hazards models of 748 COVID-19 diagnoses over 4769 person-years of exposure. Unadjusted models included the behavior alone. Adjusted models additionally included sex, age category, race/ethnicity, educational attainment, employment status, living arrangement, and the natural logarithm of the state-level 7-day COVID-19 case rate.

References

    1. Dong E, Du H, Gardner L. An interactive web-based dashboard to track COVID-19 in real time. Lancet Infect Dis. 2020;20(5):533–534. doi: 10.1016/S1473-3099(20)30120-1. - DOI - PMC - PubMed
    1. Ahmad FB, Anderson RN. The leading causes of death in the US for 2020. JAMA. 2021;325(18):1829–1830. doi: 10.1001/jama.2021.5469. - DOI - PMC - PubMed
    1. Andrasfay T, Goldman N. Association of the COVID-19 pandemic with estimated life expectancy by race/ethnicity in the United States, 2020. JAMA Netw Open. 2021;4(6):e2114520. doi: 10.1001/jamanetworkopen.2021.14520. - DOI - PMC - PubMed
    1. Centers for Disease Control and Prevention. 2021. https://www.cdc.gov/coronavirus/2019-ncov/variants/delta-variant.html
    1. Centers for Disease Control and Prevention. 2020. https://www.cdc.gov/coronavirus/2019-ncov/prevent-getting-sick/index.html

Publication types