. 2022 Feb 21;61(9):e202112995.
doi: 10.1002/anie.202112995. Epub 2022 Jan 14.

A Charge-Switchable Zwitterionic Peptide for Rapid Detection of SARS-CoV-2 Main Protease

Affiliations

A Charge-Switchable Zwitterionic Peptide for Rapid Detection of SARS-CoV-2 Main Protease

Zhicheng Jin et al. Angew Chem Int Ed Engl. .

Abstract

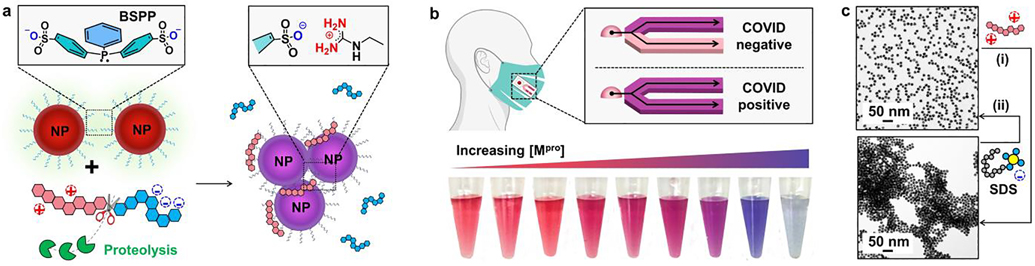
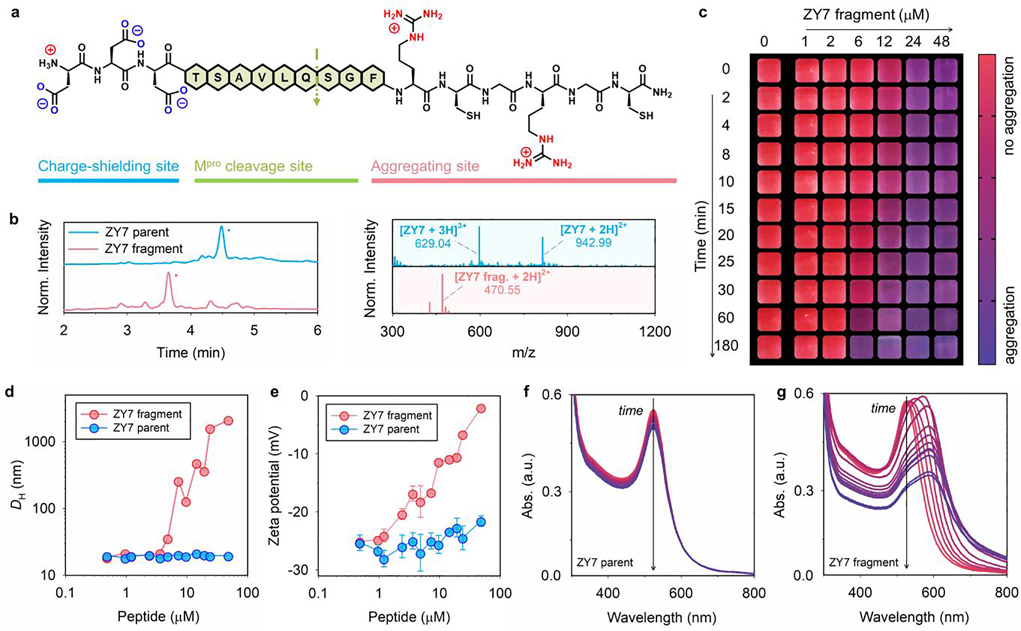
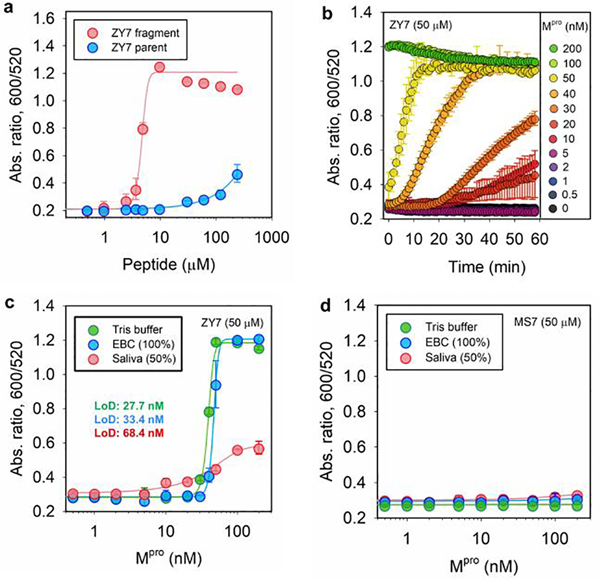
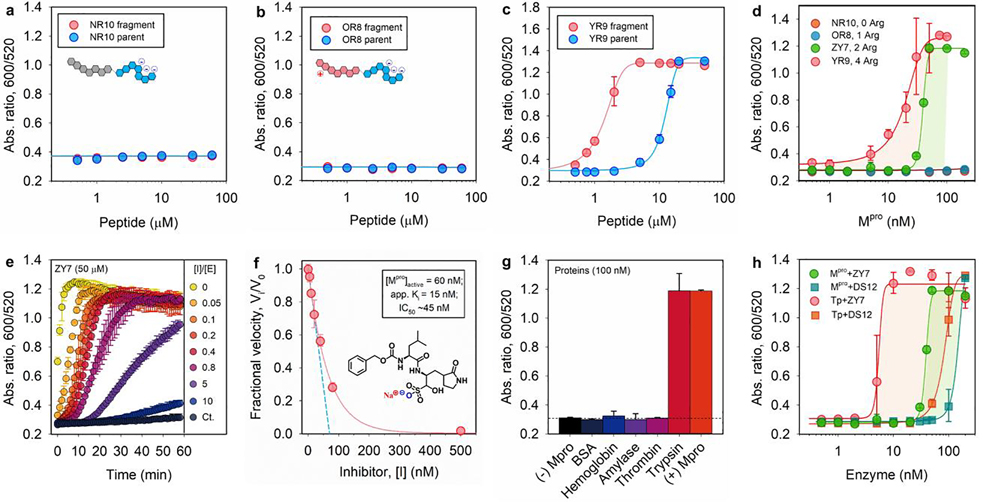
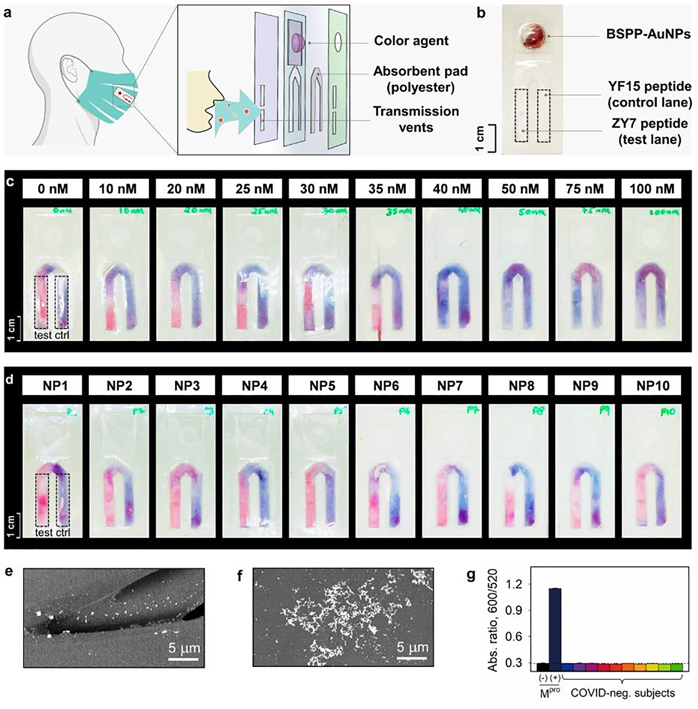
The transmission of SARS-CoV-2 coronavirus has led to the COVID-19 pandemic. Nucleic acid testing while specific has limitations for mass surveillance. One alternative is the main protease (Mpro ) due to its functional importance in mediating the viral life cycle. Here, we describe a combination of modular substrate and gold colloids to detect Mpro via visual readout. The strategy involves zwitterionic peptide that carries opposite charges at the C-/N-terminus to exploit the specific recognition by Mpro . Autolytic cleavage releases a positively charged moiety that assembles the nanoparticles with rapid color changes (t<10 min). We determine a limit of detection for Mpro in breath condensate matrices <10 nM. We further assayed ten COVID-negative subjects and found no false-positive result. In the light of simplicity, our test for viral protease is not limited to an equipped laboratory, but also is amenable to integrating as portable point-of-care devices including those on face-coverings.

Keywords: Colorimetric analysis; Covid-19; Smart mask; Zwitterionic peptide; mpro/3clpro/nsp5.


Figures

Figure 1.
Figure 1.
The surveillance approach uses a color change based on peptide-gold assembly. (a) Schematic illustration of the aggregation of bis(p-sulfonatophenyl)phenylphosphine-coated gold nanoparticles (BSPP-AuNPs) caused by the proteolytic hydrolysis of the intact peptide where the net charge of intact peptide and its fragment is reversed. The green cartoon designates proteases, i.e., Mpro; the tandem hexagon represents a modular zwitterionic peptide with a Mpro recognition site. (b) The colorimetric test could be coupled with face coverings with a lateral flow strip to indicate COVID infection in-situ (top). White-light image of BSPP-AuNPs after incubating with the proteolytic products. The visual color shifts from ruby red to violet-blue with increasing amount of Mpro from 0−200 nM (bottom). (c) TEM images of the dispersed BSPP-AuNPs (top) and proteolysis-induced gold aggregates [bottom, (i)]. The flocculated AuNPs can be redispersed using ionic surfactant additives, such as sodium dodecyl sulfate [SDS, (ii)], due to the restored electrostatic repulsion.
Figure 2.
Figure 2.
Modular zwitterionic peptide and protease-induced gold aggregation. (a) Peptide ZY7 has three domains, including a charge-shielding (DDD), a Mpro recognition (LQ↓SG), and an aggregating site (RCGRGC). The net charge of ZY7 and its aggregating fragment is 0 and +3, respectively. (b) HPLC and ESI-MS data show that Mpro selectively cleaves the ZY7 peptide at the C-terminus of glutamine (Q). Peak with * is the product. (c) The color evolution of BSPP-AuNPs (3.8 nM, 50 μL) in the presence of pre-cleaved ZY7 fragments. Shown are the cropped images with a color bar where purple represents more aggregation. The particle aggregation kinetic is concentration- and time-dependent, as shown in horizontal and vertical directions. (d) DLS profiles of BSPP-AuNPs (3.8 nM, 100 μL) incubated with increasing concentrations of ZY7 parent peptide (blue) and ZY7 fragments (red). No change of the hydrodynamic diameter (DH) for BSPP-AuNPs was observed when incubated with ZY7 peptide, while such a change became sizable in the presence of ZY7 fragments of more than ~3 μM. (e) Zeta potential measurements of AuNPs (3.8 nM, 100 μL) incubated with increasing concentrations of ZY7 parent peptide (blue) and ZY7 fragments (red). The ZY7 fragments adsorbed to the particle and altered the surface charges from −26.5 to −2.5 mV. Error bars represent triplicate measurements for one sample. (f-g) The time progression of optical absorption of AuNPs (3.8 nM, 50 μL) when incubated with ZY7 parent peptide and its fragments (c = 6.0 μM). The curves from red to purple were recorded every 10 min for 2 h. Noticeable peak changes were observed at 520 and 600 nm for a fragment-AuNP mixture.
Figure 3.
Figure 3.
Operation window of the sensing system and limit of detection (LoD) for Mpro. (a) Ratiometric signal (Abs600/Abs520) collected from BSPP-AuNPs (3.8 nM, 100 μL) incubated with various amount of ZY7 parent (blue) and fragments (red). The working window for ZY7 substrate is 3.2−55.3 μM. (b) Time progression of absorbance ratio in the enzyme assay, where a fixed amount of ZY7 substrate (50 μM) is incubated with increasing concentrations Mpro (0−200 nM). The test media is exhaled breath condensate (EBC). The data points were read every 1 min for 1 h. (c) The absorbance ratio as a function of Mpro concentration, where ZY7 substrate (50 μM) is used. The determined LoD for Mpro is: 27.7 nM in Tris buffer (TB), 33.4 nM in EBC matrix, and 68.4 nM in saliva. Note that the readout time is 20 min for saliva. The linear regions used to calculate LoDs can be found in Figure S5d. Error bar = standard deviation. (d) The absorbance ratio as a function of Mpro concentration in three biofluids, where MS7 (control) substrate (50 μM) is used. Readout time is set to be 10 min.
Figure 4.
Figure 4.
Tunning sensitivity and specificity of the sensor. (a-c) The operation window of Mpro sensors based on NR10, OR8, and YR9 peptide, which contains 0, 1, and 4 arginine residues in its aggregating sequence, respectively; see Table 1. (d) The Mpro LoD of sensors based on four peptides of varying number of arginine: no LoD observed for NR10 and OR8 substrate; 27.7 and 3.4 nM is determined for YR9 and ZY7 substrate, respectively. (e) Time progression of ratiometric signal (Abs600/Abs520) in inhibitor assays. Increasing molar ratio of [inhibitor]/[Mpro] from 0−10 was employed. The control curve (Ct.) designates inhibitor only without Mpro additive. (f) A typical inhibition titration curve fitted with the Morrison equation (Eqn. S2) is shown for the competitive inhibitor, GC376.[30] Inset shows the chemical structure of GC376 inhibitor. A Henderson equation was applied to resolve the apparent inhibitor dissociation constant, Ki (app) =15 nM, and active enzyme concentration, [E]0 =60 nM (out of 100 nM). The IC50 is 45 nM. (g) Sensor activation by other mammalian proteins (100 nM), including bovine serum albumin (BSA), hemoglobin, α-amylase (100 U/mL), thrombin, and trypsin. Assay with and without Mpro is included as positive and negative control. (h) The response of sensors based on ZY7 and DS12 substrate to Mpro or trypsin in Tris buffer. LoD for Mpro is 27.7 and 114.4 nM for ZY7 and DS12, respectively; LoD for trypsin is 9.7 and 30.3 nM for ZY7 and DS12, respectively.
Figure 5.
Figure 5.
Portable device for protease detection. (a) Structural illustration of the flow-cell device on a face covering for colorimetric sensing. The vents allow the transmitted respiratory droplets to be concentrated on the absorbent pad. The reagent yielding color change is packed in the reservoir. More details about the flow strip can be found in Table S1. (b) A white-light image of the assembled sensing trip, equipped with a BSPP-AuNP dispersion in the blister pack, ZY7 peptide on the test lane (left, dash box), and YF15 peptide on the positive-control lane (right, dash box). Scale bar of 1 cm is shown. (c) The sensing strip’s LoD for Mpro is estimated to be 30–40 nM. Monodispersed BSPP-AuNPs appear as pink-red, while the clustered gold aggregates by peptide fragments appear as violet-blue. (d) Strip testing of Mpro marker on COVID-negative participants (NP#, n=10). All test lanes show pink-red in the absence of SARS-CoV-2 protease. SEM images of non-aggregating AuNPs on the red lane (e) and clustered AuNPs (f) on the purple lane. (g) Sensor testing on aqueous EBC matrices collected from COVID-negative subjects (n=10). No absorbance ratio change/false positive was noticed.

References

    1. de Graaf M, van Beek J, Koopmans MP, Nat. Rev. Microbiol. 2016, 14, 421. - PubMed
    1. V’kovski P, Kratzel A, Steiner S, Stalder H, Thiel V, Nat. Rev. Microbiol. 2021, 19, 155. - PMC - PubMed
    1. Jin Z, Du X, Xu Y, Deng Y, Liu M, Zhao Y, Zhang B, Li X, Zhang L, Yang H, Nature 2020, 582, 289. - PubMed
    1. Steuten K, Kim H, Widen JC, Babin BM, Onguka O, Lovell S, Bolgi O, Cerikan B, Neufeldt CJ, Bogyo M, ACS Infect. Dis. 2021, 7, 1457. - PMC - PubMed
    1. Medintz IL, Clapp AR, Brunel FM, Tiefenbrunn T, Tetsuo Uyeda H, Chang EL, Deschamps JR, Dawson PE, Mattoussi H, Nat. Mater. 2006, 5, 581. - PubMed

Publication types