. 2021 Dec 21;37(12):110139.
doi: 10.1016/j.celrep.2021.110139.

ATAD3A has a scaffolding role regulating mitochondria inner membrane structure and protein assembly

Affiliations

ATAD3A has a scaffolding role regulating mitochondria inner membrane structure and protein assembly

Tania Arguello et al. Cell Rep. .

Abstract

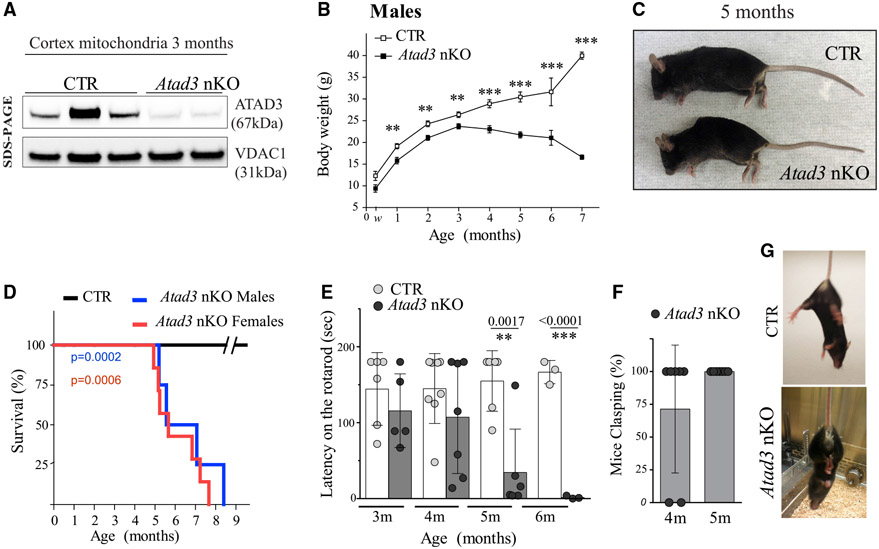
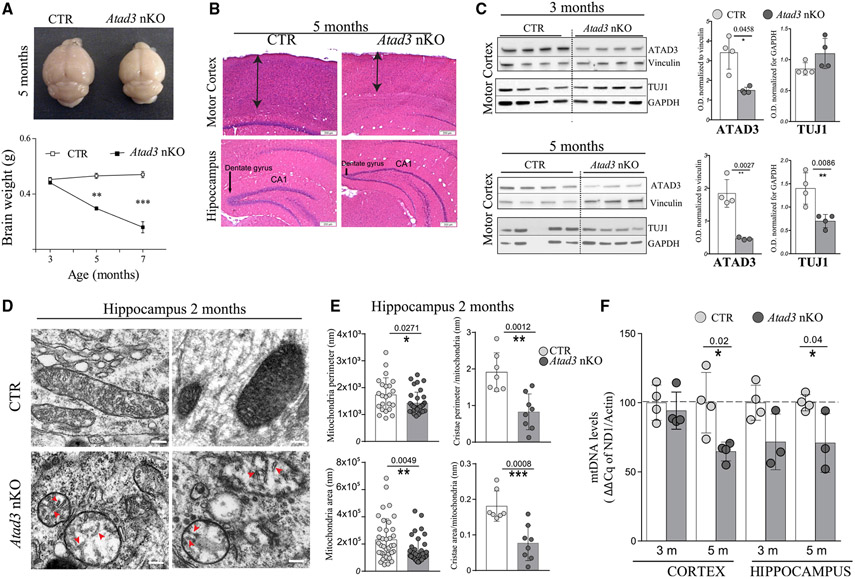
The ATPase Family AAA Domain Containing 3A (ATAD3A), is a mitochondrial inner membrane protein conserved in metazoans. ATAD3A has been associated with several mitochondrial functions, including nucleoid organization, cholesterol metabolism, and mitochondrial translation. To address its primary role, we generated a neuronal-specific conditional knockout (Atad3 nKO) mouse model, which developed a severe encephalopathy by 5 months of age. Pre-symptomatic mice showed aberrant mitochondrial cristae morphogenesis in the cortex as early as 2 months. Using a multi-omics approach in the CNS of 2-to-3-month-old mice, we found early alterations in the organelle membrane structure. We also show that human ATAD3A associates with different components of the inner membrane, including OXPHOS complex I, Letm1, and prohibitin complexes. Stochastic Optical Reconstruction Microscopy (STORM) shows that ATAD3A is regularly distributed along the inner mitochondrial membrane, suggesting a critical structural role in inner mitochondrial membrane and its organization, most likely in an ATPase-dependent manner.

Keywords: ATAD3; cardiolipin; cristae; inner membrane; mitochondria.


Conflict of interest statement

Declaration of interests The authors declare no conflict of interests.

Figures

Figure 1.
Figure 1.. Characterization of Atad3 nKO mice
(A) Western blot of ATAD3 protein in mitochondria from cortex of 3 months old control (CTR) and Atad3 nKO mice, VDAC1 was probed to normalize the protein loading. (B) Body weight comparison over time of Atad3 nKO male mice (black squares; n = 6), age-matched control male mice (white squares; n = 7). P-values were calculated by Student’s t test. (C) Representative image of 5-month-old Atad3 nKO mouse and a control (CTR) littermate. (D) Survival curve of Atad3 nKO female mice (red line) and male mice (blue line). P-values were calculated using the log-rank (Mantel-Cox) test. p < 0.0002 for female mice (n = 7 CTR versus n = 7 nKO); p = 0.0006 for male mice (n = 7 CTR versus n = 5 nKO). All Atad3 nKO mice died before 8 months of age. (E) Rotarod performed by Atad3 nKO male mice and age-matched control mice at 3, 4, 5 and 6 months of age (n = 3–10). Data are represented as mean ± SD. (F) Clasping of the limbs in Atad3 nKO mice at 4 and 5 months of age. Bars represent means ± standard deviation (SD). P-values were calculated by Student’s t test to determine the level of statistical difference; statistical significance is indicated by *p < 0.05, **p < 0.01 and ***p < 0.0001. (G) Representative image of a tail suspension test of 4-month-old Atad3 nKO and control littermates. Atad3 nKO mice have a typical paw-clasped posture, while control mice show a normal flexion response.
Figure 2.
Figure 2.. Loss of ATAD3 in brain disrupts mitochondrial cristae structure and causes neurodegeneration
(A) Brain weight Atad3 nKO and control (CTR) mice of 3, 5, and 7-month-old male mice (n = 4–6) showing reduced size from 5 months old. (B) H&E staining of cortical (first row) and hippocampal (second row) regions of 5-month-old animals (arrows show neuronal loss). Original magnification × 10. (C) Western blots and relative quantifications of ATAD3 and the neuronal marker TUJ1 in homogenates from motor cortex of 3- and 5-month-old mice. Data are represented as mean ± SD (n ≥ 3/group). P-values were determined by Student’s t test. **p < 0.01, ***p < 0.001. (D) Representative electron-dense transmission micrographs (TEM) of mitochondria from CA1 hippocampus region of 2 months old control (CTR) and Atad3 nKO mice. Condensed cristae (red arrowheads) and smaller diameters are shown (scale bar, 200nm). (E) Quantification of the mitochondrial perimeter, area, and cristae surface (expressed as cristae perimeter per mitochondrial perimeter or area, respectively). Data represent mean ± SD of n = 3 different sections (> 20-30 mitochondria) of two control and Atad3 nKO mice. P-values were calculated by Student’s t test to determine the level of statistical difference; *p < 0.05, **p < 0.01 and ***p < 0.0001. (F) mtDNA levels measured by qPCR in DNA extracted from cortices and hippocampus of 3 and 5-month-old control and Atad3 nKO mice (n = 4–5/group). Bars represent means ± SD). p values were calculated by Student’s t test to determine the level of statistical difference; *p < 0.05, **p < 0.01 and ***p < 0.0001.
Figure 3.
Figure 3.. Analysis of the OXPHOS subunits and OXPHOS complex steady-state levels in Atad3 nKO brain
(A and B) western blots probing mitochondrial oxidative phosphorylation complex subunits (NDUFB8, SDHA and COX1) and VDAC1 in cortex homogenates from control and Atad3 nKO at 3 and 5 months of age. (C and D) Quantifications for of the western blots showed in A and B, respectively. (E) Blue Native PAGE blots probing mitochondrial oxidative phosphorylation complexes and supercomplexes in hippocampal homogenates from control and Atad3 nKO at 3 months of age and (G) relative quantifications. (F) BN-PAGE blots probing mitochondrial oxidative phosphorylation complexes and supercomplexes in hippocampal homogenates from control and Atad3 nKO at 5 months of age and (H) relative quantifications. Bars represent means ± SD. p values were calculated by Student’s t test to determine the level of statistical difference; *p < 0.05, **p < 0.01 and ***p < 0.0001.
Figure 4.
Figure 4.. Multi-omics analysis in pre-symptomatic Atad3 nKO brain
(A) Schematic representation of the phenotype found in the ATAD3A nKO mouse model. Cortex tissue samples were used for the Multi-omics analysis which included transcriptomics, metabolomics, and lipidomics at 2.5-month-old between control (CTR) and Atad3 nKO mice. (B and C) Transcriptomic analysis. (B) Supervised hierarchical clustering heatmap representation of the 22 differentially expressed genes by DESq2 between control CTR and Atad3 nKO mice (n = 5 per group). Green color indicates overexpression and red indicates under-expression. (C) Volcano plot of the 22 differential expressed genes. Top under-expressed transcripts included Atad3a and Mrpl12 (shown in red). Data are expressed as log2 fold change with adjusted p value (Benjamini-Hochberg adjusted, q-value < 0.05). (D and E) Metabolomics analysis. (D) 3D Partial Least-Squares Discriminant Analysis (PLS-DA) score plot showing the separation between CTR (n = 6) and Atad3 nKO mice (n = 4). Explained variables are shown in parenthesis for the 3 principal components. (E) SAM (Significance Analysis of Microarrays) table showing 27 significant overexpressed metabolites grouped by common functional pathway. Cutoff significance (d value = 1.4), FDR (q value) = 0.043. (F) Lipidomics analysis. Lipid content levels of the major phospholipid species detected showing a decrease of total PC (phosphatidylcholine) in the Atad3 nKO group (2way ANOVA p = 0.012). Independent analysis of the total Cardiolipin content also show a decrease in nKO mice group (n = 6 mice per group). *p < 0.05, **p < 0.01 and ***p < 0.0001. PG (phosphatidylglycerol), PA (phosphatidic acid), PS (phosphatidylserine), PI (phosphatidylinositol), ePE (ether-linked phosphatidylethanolamine), PE (phosphatidylethanolamine), lysoPE (lysophosphatidylethanolamine), ePC (ether-linked phosphatidylcholine), SM (sphingomyelin), DSM (dihydrosphingomyelin), cardiolipin (CL). (G) Phospholipid synthesis Pathway identified in our Integrated Omics analysis. DAG (diacylglycerol) and linoleic acylglycerols are preferentially used in two different reactions during the synthesis of phospholipids, integral components of mitochondrial membranes: 1. DAG is converted to cytidine diphosphate-diacylglycerol (CDP-DAG) by a cytidylyltransferase enzyme using PA located in the ER. CDP-DAG is then used as substrate through PG for the synthesis of CL. 2. DAG is also incorporated to the choline moiety of cytidine diphosphate-choline (CDP-choline) during the synthesis of PC. Using the CDP choline pathway, choline (which is located in the ER) follows several enzymatic reactions to form phosphocholine and CDP-choline. Once PC is synthesized in the ER it is translocated to the mitochondria and acts as a major donor of the acyl groups to the immature cardiolipin during the remodeling process within the inner mitochondrial membrane.
Figure 5.
Figure 5.. Enrichment and protein interaction analysis of ATAD3A
(A) CoIP analysis. GO enrichment analysis of the first 100 protein hits after co-immunoprecipitation of human ATAD3A showing the list of significant GO terms and annotations by molecular function. Bars represent the adjusted p value and marks on the grid correspond to the proteins annotated by the GO term. (B) BioID analysis. Representative scheme of the ATAD3 protein and the location of the glycine (G) to aspartate (D) (G355D) in the Walker A motif. The ATPase domain is located at the C-terminal region of the protein and contains the Walker A and the Walker B motif (required for ATP binding and hydrolysis). ATAD3 also contains a proline-rich domain (PR) at the N-terminal tail followed by two coil-coil domains (CC1 and CC2) and 2 transmembrane domains (TM1 and TM2). (C) Venn diagram of the common hit proteins found by BioID for the wild-type (ATAD3) and mutant (G355D) baits. 103 common preys were found between both groups while 25 unique preys were found in the ATAD3 and 30 in the G355D. (D) Hierarchical clustering of the common 12 top significant preys detected in both (ATAD3) and (G355D) with a BFDR < 0.01. The fold change score (calculated over the average of 23 controls) is shown for each bait. (E) Enrichment analysis of the common 103 preys found in BioID analysis. Top GO terms listed by molecular function are shown in bars representing the combined adjusted score ranking. GO terms are grouped in three distinctive pathways, complex I, mitoribosomes, and fatty acid metabolism. Protein members belonging to each term are shown in color on the grid of squares. (F) CoIP/MS+BioID. (left panel) Venn diagram showing the overlapping significant genes between the first 100 top hits found by coIP (ATAD3) and BioID wild-type and mutant G355D. (right panel). Enrichment analysis by Biological process of the common 14 proteins found between coIP and BioID analysis. The top 10 GO terms are shown in bars representing the combined adjusted score ranking and proteins belonging to each term are shown in color on the grid of squares. (G) LETM1 interacts with ATAD3A. (left panel) schematic representation of the NanoBit Assay. The Nanoluc luciferase relies on the structural complementation of two split subunits: small Bit and large Bit. These subunits act as a reporter and are fused to the N or C-terminal region of the two proteins of interest, which upon interaction form the active enzyme able to generate bioluminescence. (central panel) Kinetic in vivo luminescence data of the different pair combinations of LETM1 and ATAD3A fused to the subunits of the NanoLuc luciferase. Complementation was tested fusing the reporters at the C-terminal ATAD3A(C) and both terminal regions of the LETM1 protein, LETM1 C-terminal (LETM1(C) shown in red) or LETM1 N-terminal LETM1(N) shown in gray). LgBiT (Large Bit) and SmBit (HALO Small Bit) fragments were used as nonspecific complementation interactions at the C-terminal and N-terminal regions, respectively. The graph shows the relative luminescence units per second (RLUs/sec) over time (in minutes). (right panel) Luminescent signal was significant among the C-terminal of LETM1 and ATAD3A when compared to nonspecific interaction controls (LETM(C)-LgBiT p = 0.015 HALO-ATAD3A(C) p = 0.015) or the LETM(N)-ATAD3A(C) p = 0.044) values were calculated by Student’s t test to determine the level of statistical difference; *p < 0.05, **p < 0.01, and ***p < 0.0001. 3 independent experiments (4 technical replicates each)
Figure 6.
Figure 6.. Super resolution analysis of the spatial distribution of ATAD3A in HeLa cells
(A) HeLa cells labeled with ATAD3A (N-terminal antibody) (red) and TOM20 as an outer mitochondrial membrane marker (green upper panel) or TIM23 as the inner mitochondrial membrane marker (green lower panel) were analyzed by STORM. (B) Co-localization expressed as Mander’s coefficient showing the co-occurrence measurements (Manders A) of ATAD3A with TOM20 and with TIM23, respectively (n = 16 cells each). (C) Overlay STORM reconstructed image of ATAD3A N-terminal antibody (ATA3A-Nter) staining (red) and anti-mtDNA (mtDNA) in green. (Scale bar, 5 μm; inset scale bar, 1 μm). (D) Co-occurrence Manders coefficients of ATAD3 signal co-localizing with mtDNA (Manders A) and mtDNA co-localizing with ATAD3A (Manders B). (n = 16 cells) (E). (upper panel): Representative graph of the intensity profile after Fast Fourier Transform of ATAD3A N-terminal SMLM showing the peak detection amplitude as a function of the inverse of the distance (1/μm). Peaks that exceed the amplitude threshold are shown in red circles and were used for distribution analysis. (amplitude threshold is denoted by the red dot-line and represents 50% of the maximal amplitude detected in the intensity profile). (Lower panel): Histogram showing the distribution of ATAD3A periodicities by ranges (bins of 0.5 μm). The most frequent ATAD3A periodic signal was detected at 0.5 and 1 μm. Nonlinear regression with Gaussian fit is shown in black (Amplitude:526.3; mean:0.8461; SD:0.4339). Total number of periods detected by FFT above the amplitude threshold were used from n = 12 cells (560 intensity profile tracings, 1313 periodic values). (F–G) Histogram showing the distribution of the ATAD3 cluster diameters found by SR Tessler analysis. (F) ATAD3A N-terminal (red) and C-terminal (black) shows clusters with a diameter of 110.7 nm (Best-fit values: Amplitude:66.96, Mean:108.1, SD:17.16) and 139 nm (Best-fit values: Amplitude: 40.72, Mean: 136.3, SD 19.31), respectively. (G) Frequency distribution cluster at the ATAD3A N-terminal (in red) and absence of organized clusters with the ATAD3B (in black). Nonlinear regression with Gaussian fit is shown on each frequency distribution plot. Datasets correspond to n = 9 cells from three independent single-molecule experiments. Statistics were performed on the dataset computed from the Voronoï diagram on detected localizations and normalized by the average localization density. (H) Schematic model of the ATAD3 submitochondrial localization and scaffold function. ATAD3A spans the outer and inner mitochondrial membrane forming oligomeric clusters of approximately 100 to 120 nm on both N and C-terminal, respectively. The protein is distributed regularly each 500 to 1000nm along the mitochondrial membranes. We propose ATAD3A acts as a scaffold, perhaps distributing and arranging different protein complexes within mitochondrial membranes or sub-compartments in an ATPase-dependent manner

References

    1. Antonicka H, Lin ZY, Janer A, Aaltonen MJ, Weraarpachai W, Gingras AC, and Shoubridge EA (2020). A High-Density Human Mitochondrial Proximity Interaction Network. Cell Metab. 32, 479–497.e9. - PubMed
    1. Austin S, and Nowikovsky K (2019). LETM1: Essential for Mitochondrial Biology and Cation Homeostasis? Trends Biochem. Sci 44, 648–658. - PubMed
    1. Bardou P, Mariette J, Escudié F, Djemiel C, and Klopp C (2014). jvenn: an interactive Venn diagram viewer. BMC Bioinformatics 15, 293. - PMC - PubMed
    1. Baudier J (2018). ATAD3 proteins: brokers of a mitochondria-endoplasmic reticulum connection in mammalian cells. Biol. Rev. Camb. Philos. Soc 93, 827–844. - PubMed
    1. Bauerschmitt H, Mick DU, Deckers M, Vollmer C, Funes S, Kehrein K, Ott M, Rehling P, and Herrmann JM (2010). Ribosome-binding proteins Mdm38 and Mba1 display overlapping functions for regulation of mitochondrial translation. Mol. Biol. Cell 21, 1937–1944. - PMC - PubMed

Publication types

MeSH terms

Substances