Comparative Study
. 2022 Feb;602(7896):307-313.
doi: 10.1038/s41586-021-04342-0. Epub 2021 Dec 22.

Enhanced fitness of SARS-CoV-2 variant of concern Alpha but not Beta

Affiliations
Comparative Study

Enhanced fitness of SARS-CoV-2 variant of concern Alpha but not Beta

Lorenz Ulrich et al. Nature. 2022 Feb.

Abstract

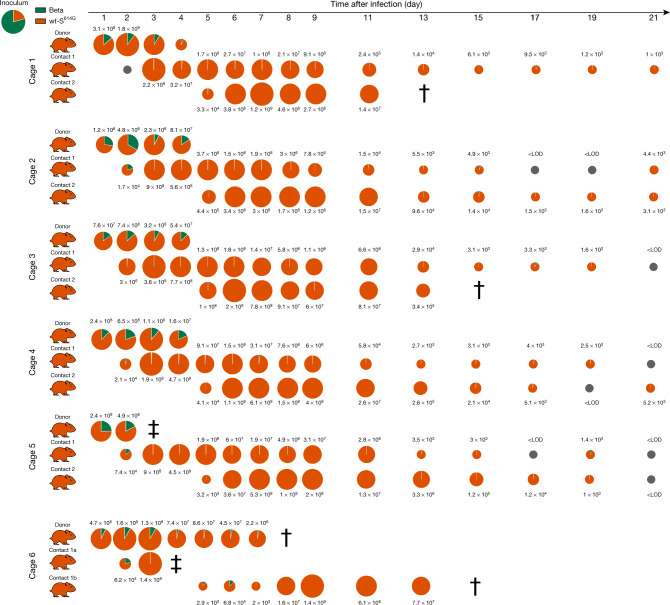
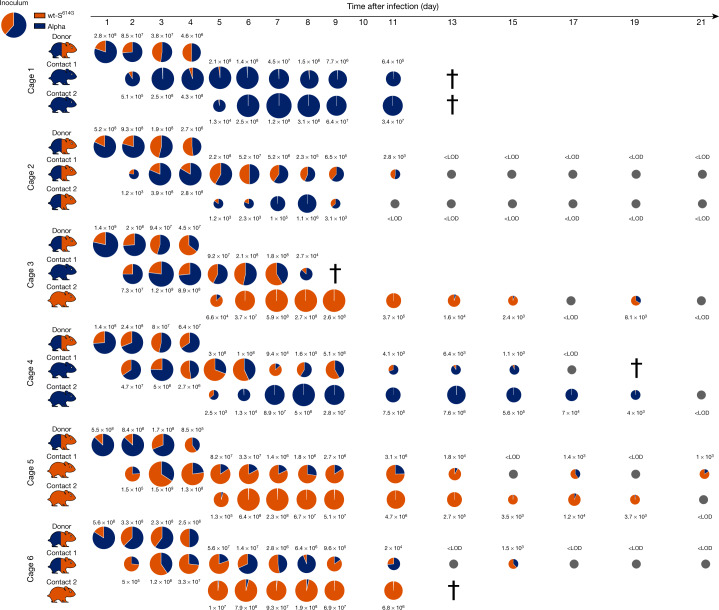
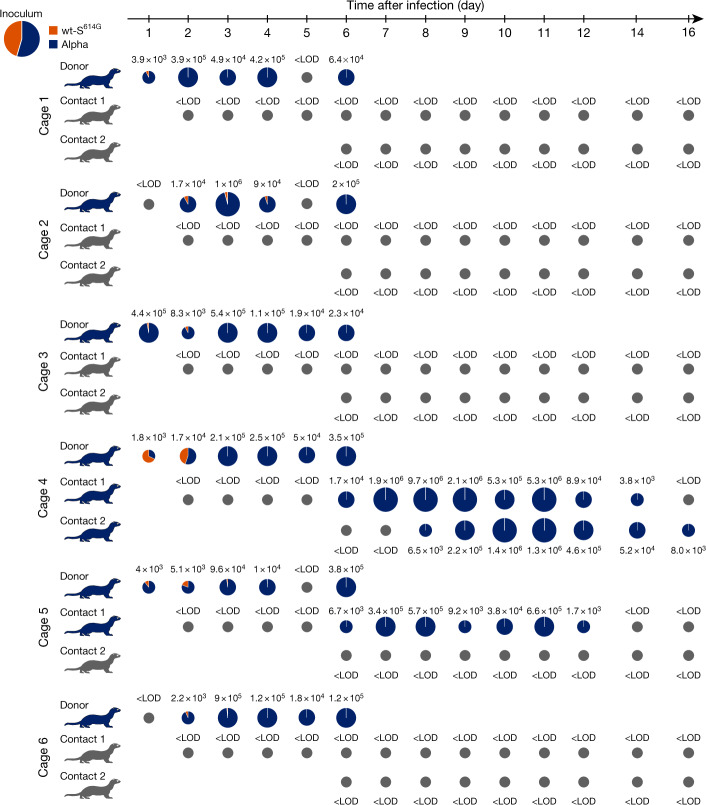
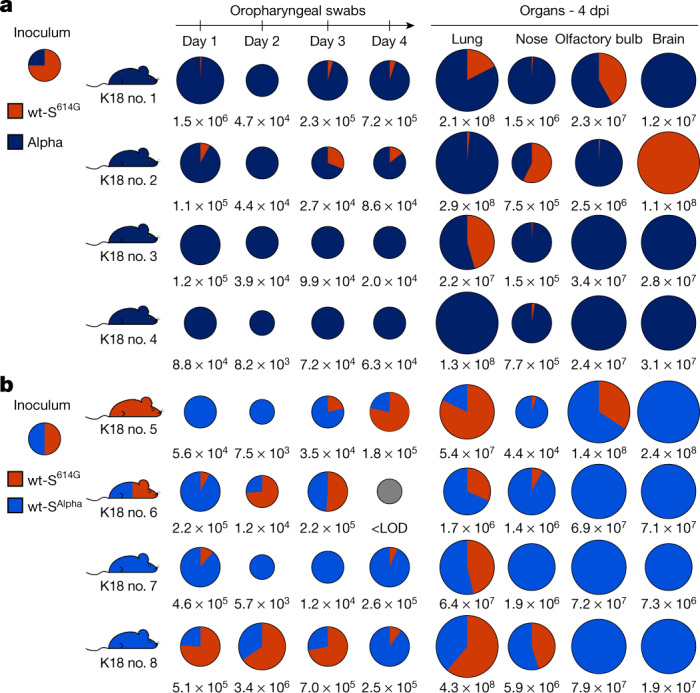
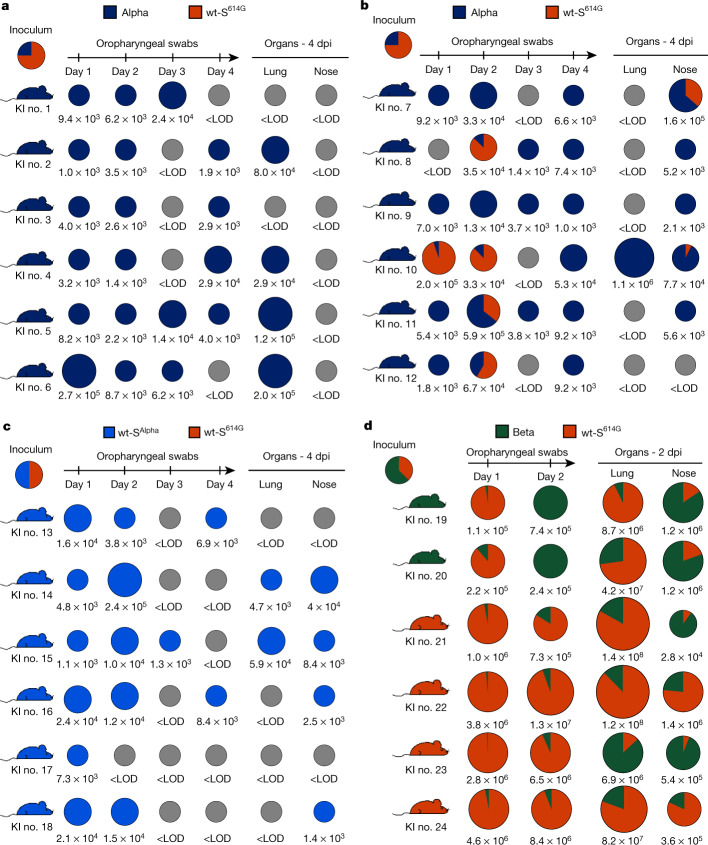
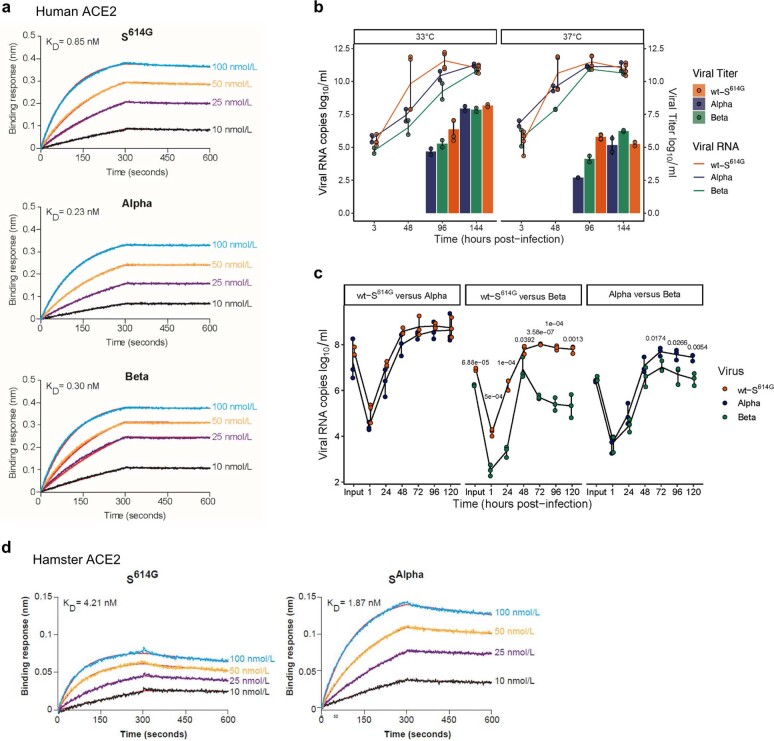
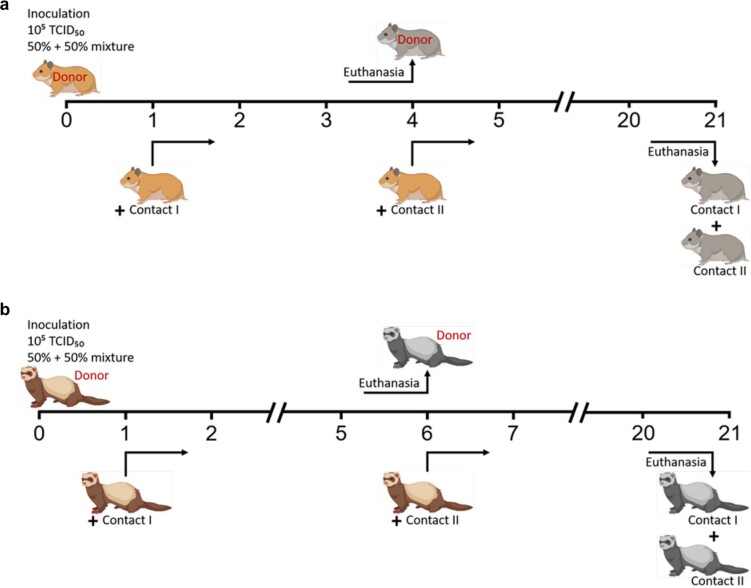
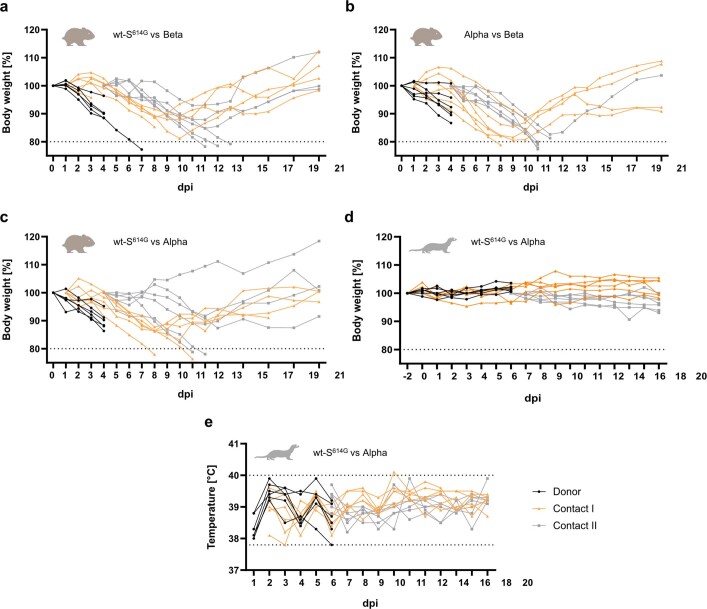
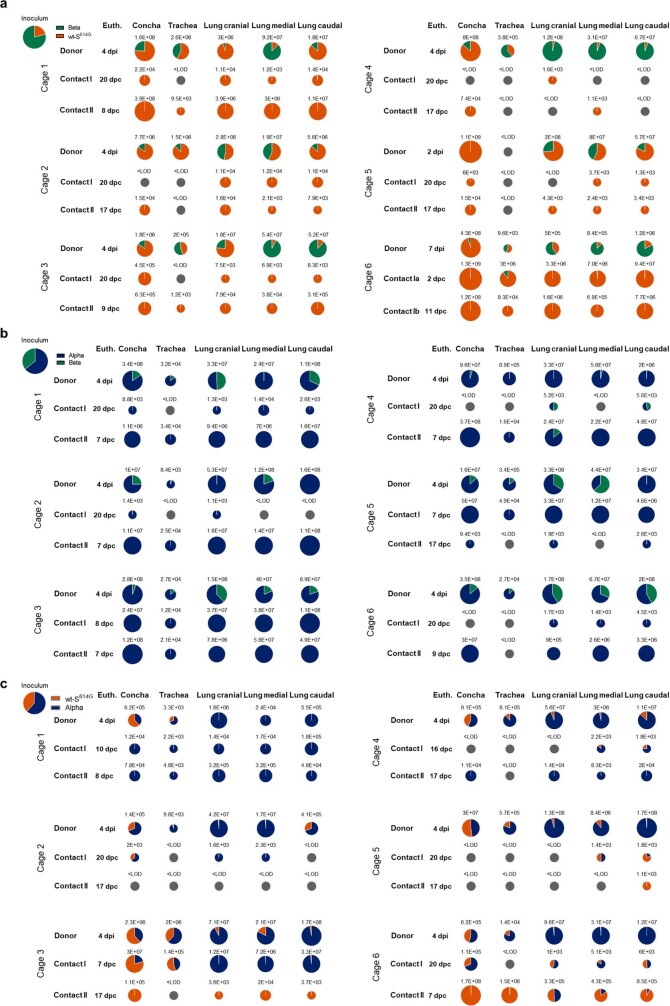
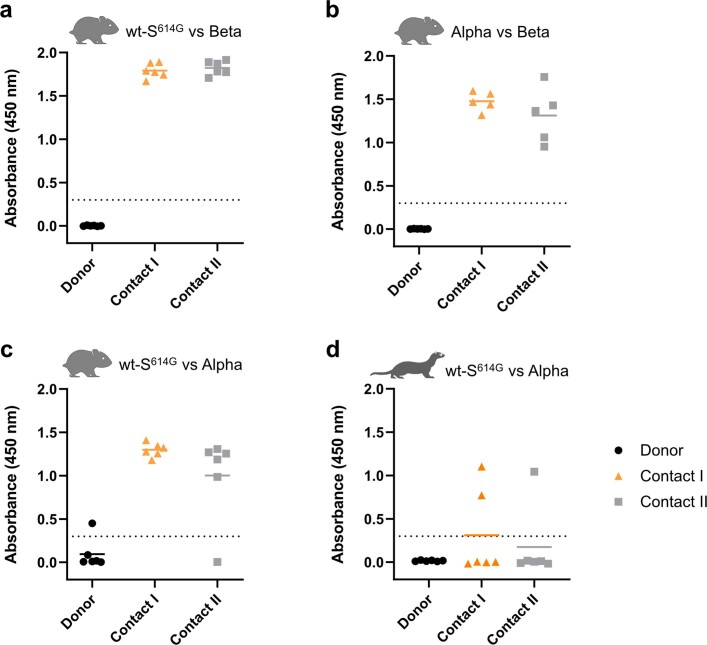
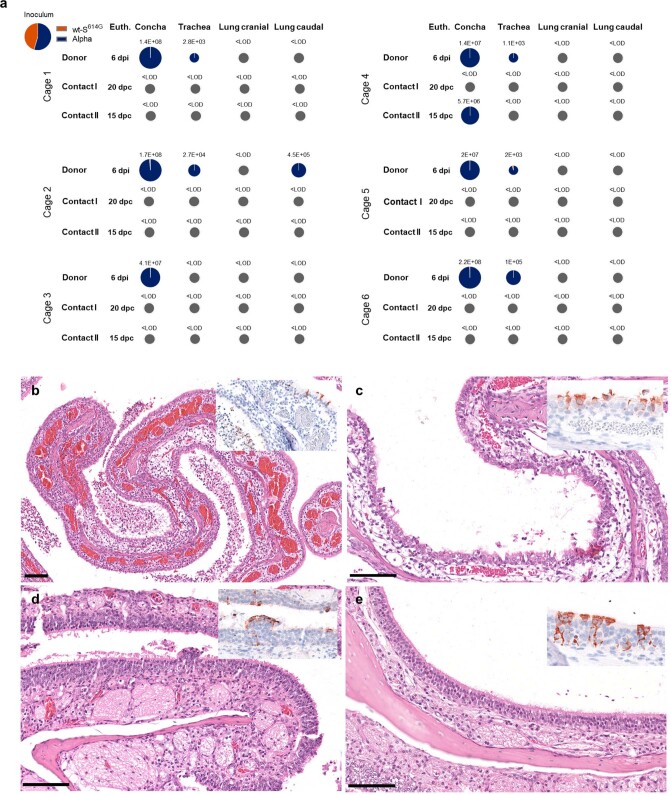
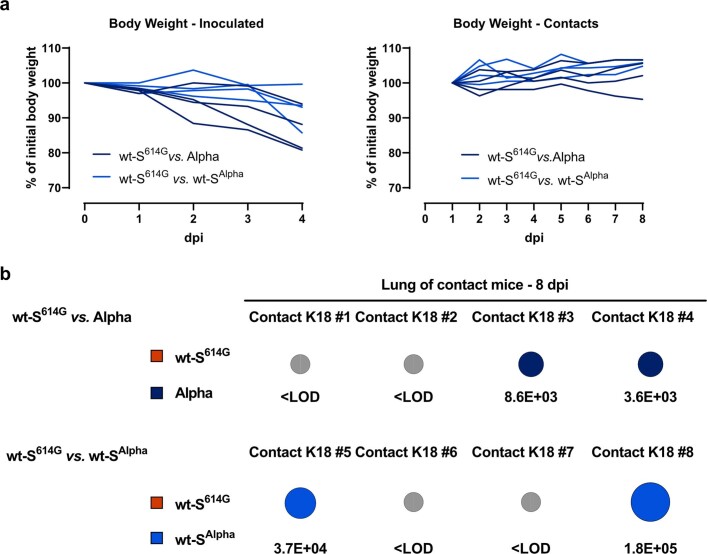
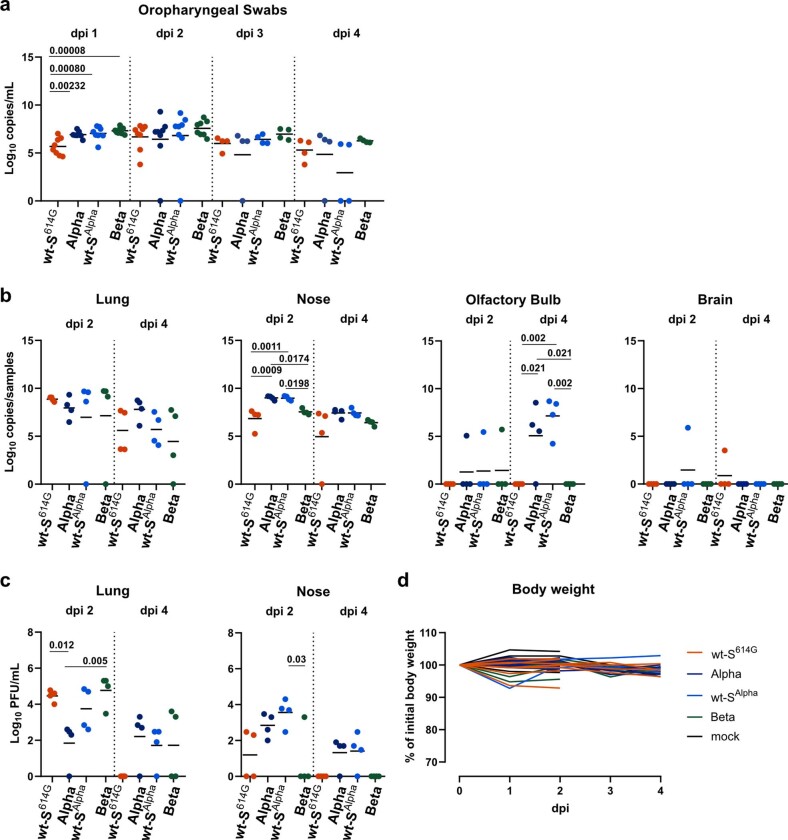
Emerging variants of concern (VOCs) are driving the COVID-19 pandemic1,2. Experimental assessments of replication and transmission of major VOCs and progenitors are needed to understand the mechanisms of replication and transmission of VOCs3. Here we show that the spike protein (S) from Alpha (also known as B.1.1.7) and Beta (B.1.351) VOCs had a greater affinity towards the human angiotensin-converting enzyme 2 (ACE2) receptor than that of the progenitor variant S(D614G) in vitro. Progenitor variant virus expressing S(D614G) (wt-S614G) and the Alpha variant showed similar replication kinetics in human nasal airway epithelial cultures, whereas the Beta variant was outcompeted by both. In vivo, competition experiments showed a clear fitness advantage of Alpha over wt-S614G in ferrets and two mouse models-the substitutions in S were major drivers of the fitness advantage. In hamsters, which support high viral replication levels, Alpha and wt-S614G showed similar fitness. By contrast, Beta was outcompeted by Alpha and wt-S614G in hamsters and in mice expressing human ACE2. Our study highlights the importance of using multiple models to characterize fitness of VOCs and demonstrates that Alpha is adapted for replication in the upper respiratory tract and shows enhanced transmission in vivo in restrictive models, whereas Beta does not overcome Alpha or wt-S614G in naive animals.


Conflict of interest statement

The authors declare no competing interests.

Figures

Fig. 1
Fig. 1. Competitive replication and transmission of Beta and wt-S614G in Syrian hamsters.
Six donor hamsters were each inoculated with a median tissue culture infectious dose (TCID50) of 104.25, determined by back titration and comprising a mixture of wt-S614G (orange) and Beta (green) at a 1:3.8 ratio, determined by quantitative PCR with reverse transcription (RT–qPCR). Donor, contact 1 and contact 2 hamsters were co-housed sequentially as shown in Extended Data Fig. 2a. Nasal washes were performed daily from 1–9 dpi and then every 2 days until 21 dpi. Pie charts show the ratio of variants detected in nasal washes at the indicated dpi. Pie chart sizes are proportional to the total number of viral genome copies per ml, as shown above or below each chart. Grey pies indicate values below the limit of detection (LOD; <103 viral genome copies per ml). Hamster silhouettes are coloured according to the dominant variant (>66%) detected in the last positive sample from each animal. Daggers indicate that the animal reached the humane endpoint; double daggers indicate a hamster that died during inhalation anaesthesia at 3 and 4 dpi. This required changes in the group composition in cage 6—the donor hamster was kept until 7 dpi and was co-housed in two different pairs: donor–contact 1a and donor–contact 1b. Source data
Fig. 2
Fig. 2. Competitive replication and transmission of Alpha and wt-S614G in Syrian hamsters.
Six donor hamsters were each inoculated with a TCID50 of 104.3, determined by back titration and comprising a mixture of wt-S614G and Alpha at a 1:1.6 ratio, determined by RT–qPCR. Donor, contact 1 and contact 2 hamsters were co-housed sequentially as shown in Extended Data Fig. 2a. Nasal washes were performed daily from 1–9 dpi and then every 2 days until 21 dpi. Pie charts show the ratio of variants detected in nasal washes at the indicated dpi. Pie chart sizes are proportional to the total number of viral genome copies per ml, as shown above or below each chart. Grey pies indicate values below the LOD. Hamster silhouettes are coloured to indicate the dominant variant (>66%) detected in the last positive sample from each hamster; a silhouette with two colours indicates that there is no dominant variant. Daggers indicate that the hamster reached the humane endpoint. Source data
Fig. 3
Fig. 3. Replication and transmission of SARS-CoV-2 Alpha and wt-S614G in ferrets.
Six donor ferrets were each inoculated with a TCID50 of 105.9, determined by back titration and comprising a mixture of wt-S614G and Alpha at a 1:1.2 ratio, determined by RT–qPCR. Donor, contact 1 and contact 2 ferrets were co-housed sequentially as shown in Extended Data Fig. 2b. Pie charts show the ratio of variants detected in nasal washes at the indicated dpi. Pie chart sizes are proportional to the total number of viral genome copies per ml, as shown above or below each chart. Grey pies indicate values below the LOD. Viral genome copies were below the LOD at 18 and 20 dpi (not shown). Ferret silhouettes are coloured to indicate the dominant SARS-CoV-2 variant (>66%) detected in the last positive sample from each ferret. Source data
Fig. 4
Fig. 4. Replication of Alpha, wt-SAlpha, and wt-S614G in hACE2-K18Tg mice.
a, b, Two groups of four donor hACE2-K18Tg mice were inoculated with 1 × 104 PFU, determined by back titration and comprising a mixture of wt-S614G (orange) and Alpha (dark blue) at a 3:1 ratio (a), or a mixture of wt-S614G and wt-SAlpha (light blue) at a 1:1 ratio (b). Pie charts show the ratio of variants detected in each sample at the indicated dpi. Pie chart sizes are proportional to the total number of viral genome copies per ml (swabs) or per sample (tissues), as shown below each chart. Grey pies indicate values below the LOD. Mouse silhouettes are coloured to indicate the dominant SARS-CoV-2 variant (>66%) in the last positive swab sample from the corresponding mouse; a silhouette with two colours indicates that there is no dominant variant. K18 nos. 1 to 8 denote individual hACE-K18Tg donor mice. Source data
Fig. 5
Fig. 5. Replication of Alpha, wt-SAlpha, and Beta in competition with wt-S614G in hACE2-KI mice.
ad, Groups of hACE2-KI male (a, c, d) and female (b) mice were inoculated with 1 × 104 PFU, determined by back titration and comprising a mixture of wt-S614G and Alpha at a 3:1 ratio (a, b), a mixture of wt-S614G and wt-SAlpha at a 1:1 ratio (c), and a mixture of wt-S614G and Beta at a 1:1.6 ratio (d). Pie charts show the ratio of variants detected in each sample at the indicated dpi. Pie chart sizes are proportional to the total number of viral genome copies per ml (swabs) or per sample (tissues), as shown below each chart. Grey pies indicate values below the LOD. Mouse silhouettes are coloured to indicate the dominant SARS-CoV-2 variant (>66%) in the last positive swab sample from the corresponding mouse. KI nos. 1 to 24 denote individual hACE2-KI mice. Source data
Extended Data Fig. 1
Extended Data Fig. 1. ACE2 receptor binding and replication kinetics of SARS-CoV-2 VOC in vitro.
(a) Affinity between spike (S614G, SAlpha, and SBeta) protein trimers and hACE2 dimers determined by Bio-layer interferometry. (b) Viral replication kinetics of SARS-CoV-2 Alpha, Beta, and wt-S614G (MOI 0.02) at 33 °C and 37 °C in primary human nasal airway epithelial cell (AEC) cultures. (c) Viral replication kinetics of pairwise competition assays in primary nasal AEC cultures at 33 °C (MOI 0.005). (b, c) Data are presented as individual points with mean (line) and standard deviation; (b) n = 2 (Alpha and Beta), n = 4 (wt-S614G), (c) n = 3 independent biological replicates. (c) P-values were determined by two-way ANOVA and Tukey Honest Significant Differences (HSD) post-hoc test. (d) Affinity between spike (S614G, SAlpha) protein trimers with hamster ACE2 determined by Bio-layer interferometry. (a, d) ACE2 with IgG1 Fc tag were loaded on anti-human IgG Fc biosensors and binding kinetics were conducted using indicated concentrations of spike trimers. Data is representative of 3 independent experiments. Source data
Extended Data Fig. 2
Extended Data Fig. 2. Experimental workflow of competitive transmission experiments in Syrian hamsters and ferrets.
(a) Timeline of the hamster experiments. Six intranasally inoculated donor hamsters each were co-housed with one naïve contact hamster (1 dpi), building six respective donor-contact I pairs. At 4 dpi, the donor hamsters were euthanized and the initial contact hamsters I were co-housed with one additional hamster (Contact II). (b) Timeline of the ferret experiment. The scheme was generated with BioRender (https://biorender.com/).
Extended Data Fig. 3
Extended Data Fig. 3. Competitive transmission between Alpha and Beta in Syrian hamsters.
Six donor hamsters were each inoculated with 105.06 TCID50 determined by back titration and composed of a mixture of Alpha (dark blue) and Beta (green) at 1.8:1 ratio determined by RT-qPCR. Donor hamsters, contact I and II hamsters were co-housed sequentially as shown in Extended Data Fig. 2a. Nasal washings were performed daily from 1–9 dpi and afterwards every two days until 21 dpi. Pie chart colors illustrate the ratio of variants detected in nasal washings at the indicated dpi. Pie chart sizes are proportional to the total viral genome copies reported above or below respective pies. Grey pies indicate values below the LOD (<103 viral genome copies per sample). Hamster silhouettes are colored according to the dominant variant (>66%) detected in the latest sample of each animal. † indicate that the corresponding animal reached the humane endpoint. Source data
Extended Data Fig. 4
Extended Data Fig. 4. Clinical features of hamsters and ferrets.
(ac) Syrian hamsters were inoculated with comparable genome equivalent mixture of either wt-S614G and Beta (a), Alpha and Beta (b), or wt-S614G and Alpha (c). In hamsters, body weight was monitored daily until 13 dpi, afterwards every two days until 21 dpi and plotted relative to bodyweight of day 0. The dotted line indicates the humane endpoint criterion of 20% body weight loss from initial bodyweight at which hamsters were promptly euthanized for animal welfare reasons. (d, e) Ferrets were inoculated intranasally with an equal mixture of wt-S614G and Alpha. Body weight (d) and temperature (e) were monitored daily in ferrets until 12 dpi, and afterwards every 2 days. Grey dotted lines in e indicate the physiologic range for body temperature in ferrets. Source data
Extended Data Fig. 5
Extended Data Fig. 5. Viral genome load in upper (URT) and lower (LRT) respiratory tract tissues of Syrian hamsters in the competitive transmission experiment between SARS-CoV-2 VOCs.
(a–c) Syrian hamsters were inoculated with comparable genome equivalent mixture of either wt-S614G and Beta (a), Alpha and Beta (b), or wt-S614G and Alpha (c). Absolute quantification was performed by RT–qPCR analysis of tissue homogenates of donor, contact I and contact II hamsters in relation to a set of defined standards. Tissue samples were collected at euthanasia (Euth.). Pie chart colors illustrate the ratio of variants detected in each sample at the indicated dpi or days post contact (dpc). Pie chart sizes are proportional to the total viral genome copies reported below. Grey pies indicate values below the LOD (<103 viral genome copies per sample). Source data
Extended Data Fig. 6
Extended Data Fig. 6. Indirect ELISA against the RBD of SARS-CoV-2.
Sera of donor hamsters (a, b, c) and ferrets (d) inoculated with the indicated SARS-CoV-2 VOC mixtures and sera of contact I and II animals were collected at their respective experimental endpoints . All sera were tested for specific reactivity against the SARS-CoV-2 RBD‐SD1 domain (wt-S amino acids 319-519). Source data
Extended Data Fig. 7
Extended Data Fig. 7. Viral genome load in upper (URT) and lower (LRT) respiratory tract tissue of ferrets in the competitive transmission experiment between SARS-CoV-2 Alpha and wt-S614G.
(a) Absolute quantification was performed by RT–qPCR analysis of tissue homogenates of donor, contact I and contact II ferrets in relation to a set of defined standards. Tissue samples were collected at euthanasia (Euth.). Pie chart colors illustrate the ratio of variants detected in each sample at the indicated dpi or dpc. Pie chart sizes are proportional to the total viral genome copies reported below. Grey pies indicate values below the LOD (<103 viral genome copies per sample). (be) Representative micrographs of hematoxylin and eosin staining of 3 μm sections of nasal conchae of donor ferrets (n = 6) 6 dpi with wt-S614G and Alpha. Micrographs are representative of 5 consecutive tissue samples of each animal. Insets show immunohistochemistry staining of SARS-CoV-2 with anti-SARS nucleocapsid antibody with hematoxylin counterstain. The respiratory (b, c) and olfactory (d, e) nasal mucosa exhibited rhinitis with varying severity. Lesion-associated antigen was found in ciliated cells of the respiratory epithelium (b, c) and in sustentacular cells of the olfactory epithelium (d, e) in all donor animals (n = 6) at 6 dpi. Scale bars are 100 μm. Source data
Extended Data Fig. 8
Extended Data Fig. 8. Bodyweight and transmission in hACE2-K18Tg mice.
hACE2-K18Tg mice inoculated with a mixture of wt-S614G and Alpha, or wt-S614G and wt-SAlpha. (a) Relative body weight of individual donor mice (n = 4 mice/group; left panel), and contact mice (n = 4 mice/group; right panel). (b) Pie chart colors illustrate the ratio of wt-S614G (orange) with Alpha (dark blue), or with wt-SAlpha (light blue) in corresponding experiments in lung homogenates of contact mice at 7 dpc (i.e., 8 dpi of donor mice). Pie chart sizes are proportional to the total viral genome copies reported below. Grey pies indicate values below the LOD (<103 viral genome copies per sample). Source data
Extended Data Fig. 9
Extended Data Fig. 9. Replication of VOC in hACE2-KI mice.
(ad) Groups hACE2-KI male mice were inoculated intranasally with 104 PFUs of SARS-CoV-2 wt-S614G, Alpha, wt-SAlpha and Beta (n = 8 mice/group). Genome copy numbers in daily oropharyngeal swabs (a) and in tissues (b), and virus titers (c) in tissues were determined at indicated dpi. Data were log10 transformed and presented as individual values and mean. * p<0.05, **p<0.01 by one-way ANOVA with Tukey’s multiple comparisons test comparing the four groups. (d) Relative body weight of individual hACE2-KI mice overtime relative to weight at infection (n = 8 mice/group until 2 dpi, and n = 4 mice/group from 3 dpi). Source data
Extended Data Fig. 10
Extended Data Fig. 10. Genome sequences of used SARS-CoV-2 variants.
Colors of the variants represent respective viruses in the different experiments. Grey lines indicate positions of known mutations of each virus strain.

Similar articles

Cited by

References

    1. Harvey WT, et al. SARS-CoV-2 variants, spike mutations and immune escape. Nat. Rev. Microbiol. 2021;19:409–424. doi: 10.1038/s41579-021-00573-0. - DOI - PMC - PubMed
    1. Tao K, et al. The biological and clinical significance of emerging SARS-CoV-2 variants. Nat. Rev. Genet. 2021;22:757–773. doi: 10.1038/s41576-021-00408-x. - DOI - PMC - PubMed
    1. Zhou B, et al. SARS-CoV-2 spike D614G change enhances replication and transmission. Nature. 2021;592:122–127. doi: 10.1038/s41586-021-03361-1. - DOI - PubMed
    1. Korber B, et al. Tracking changes in SARS-CoV-2 spike: evidence that D614G increases infectivity of the COVID-19 virus. Cell. 2020;182:812–827.e819. doi: 10.1016/j.cell.2020.06.043. - DOI - PMC - PubMed
    1. Plante JA, et al. Spike mutation D614G alters SARS-CoV-2 fitness. Nature. 2021;592:116–121. doi: 10.1038/s41586-020-2895-3. - DOI - PMC - PubMed

Publication types

MeSH terms

Substances

Supplementary concepts