Comparative Study
. 2022 Feb;602(7896):321-327.
doi: 10.1038/s41586-021-04345-x. Epub 2021 Dec 22.

Local and systemic responses to SARS-CoV-2 infection in children and adults

Collaborators, Affiliations
Comparative Study

Local and systemic responses to SARS-CoV-2 infection in children and adults

Masahiro Yoshida et al. Nature. 2022 Feb.

Abstract

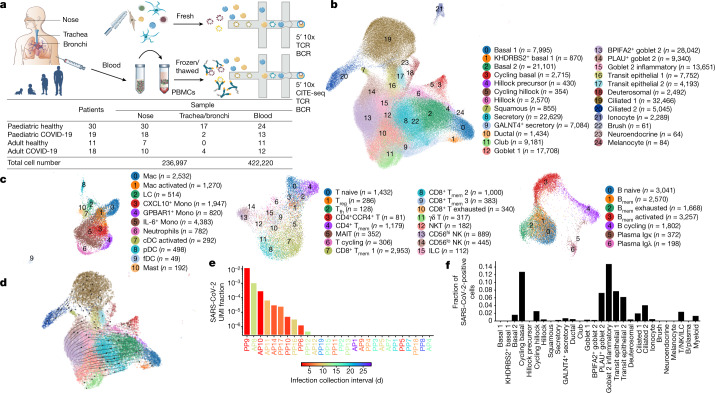
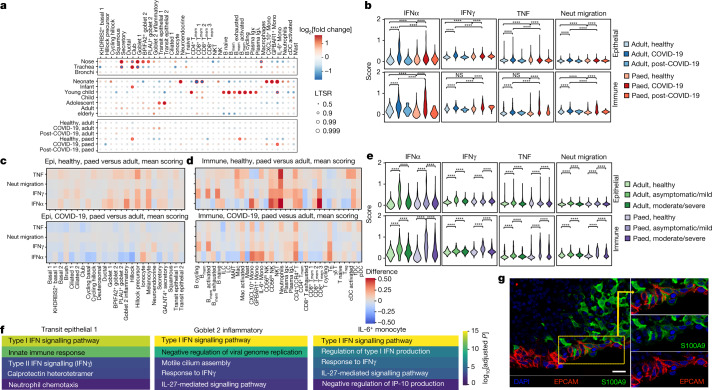
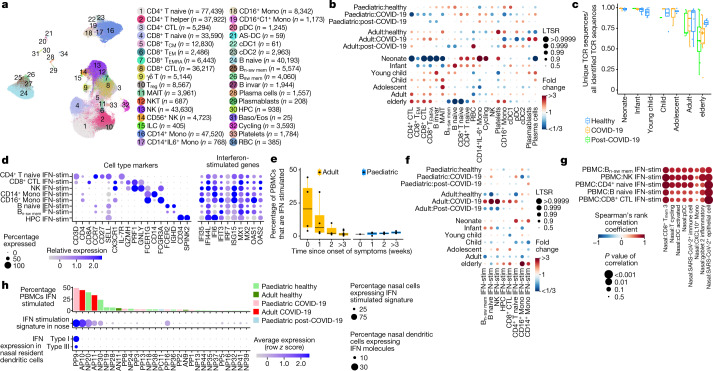
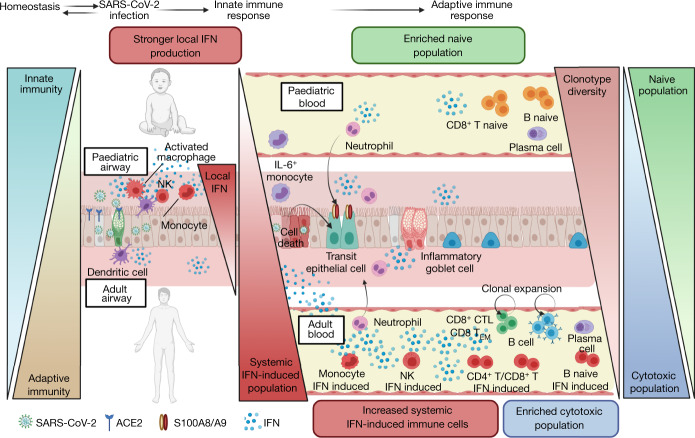
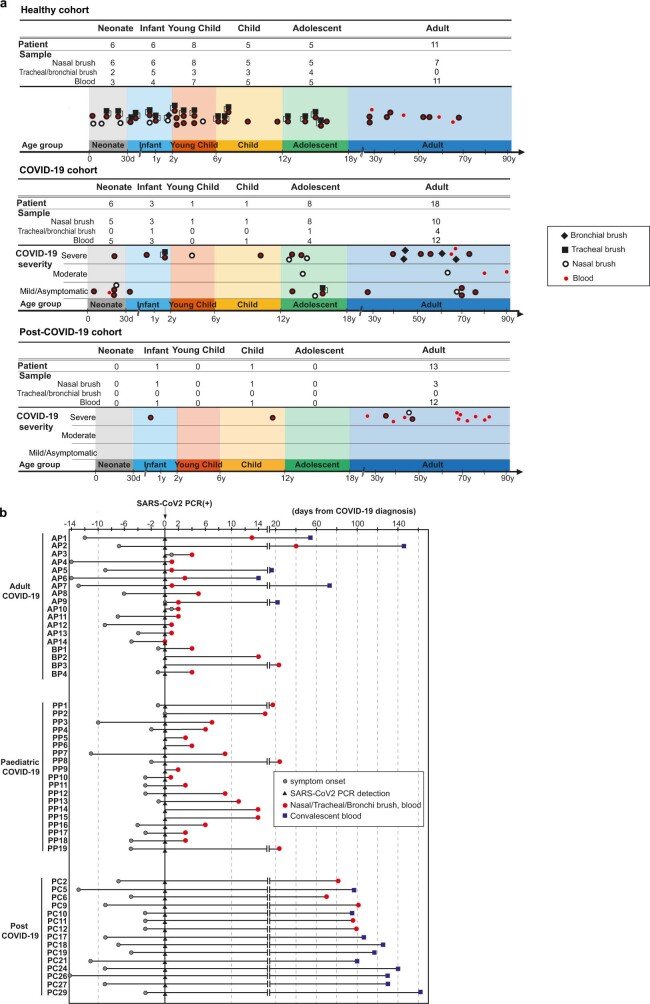
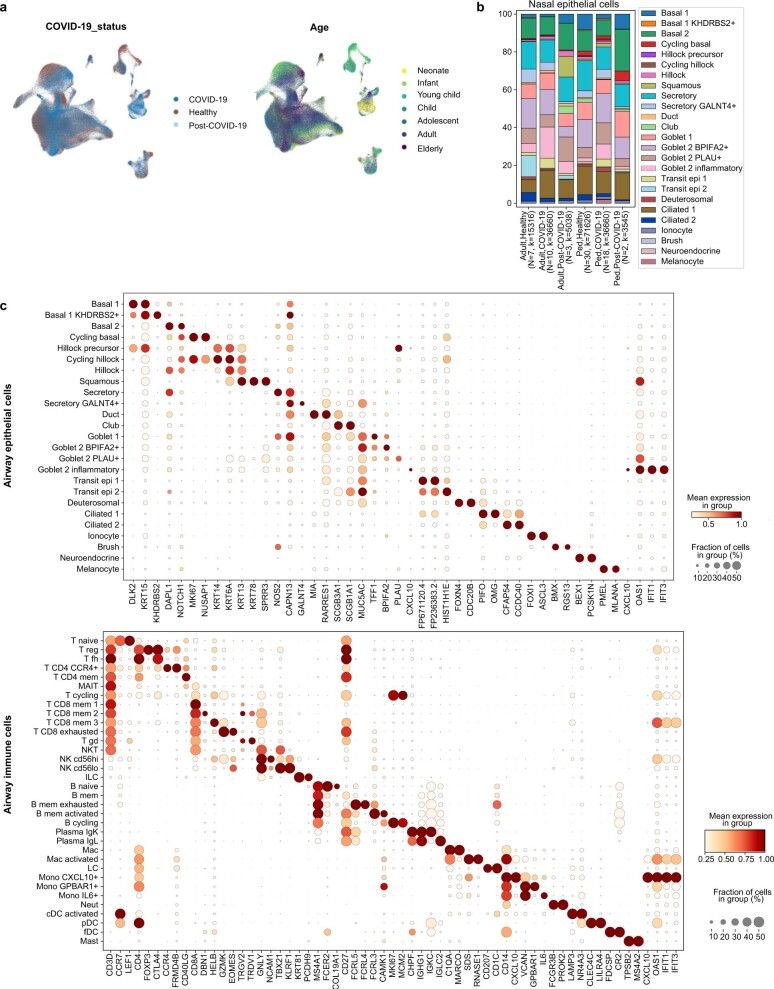
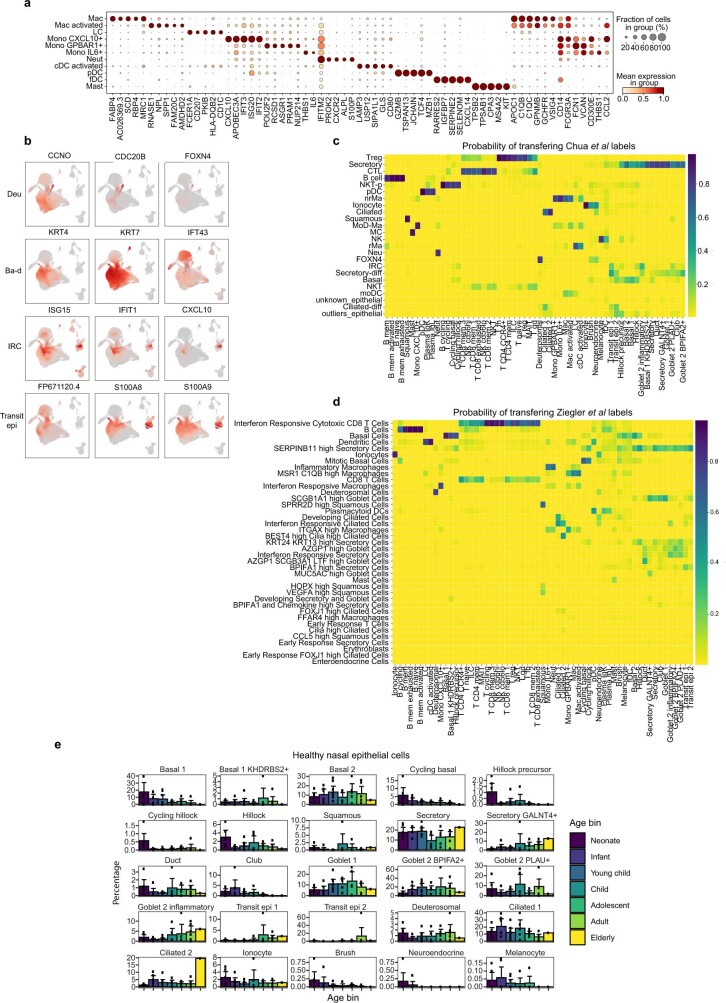
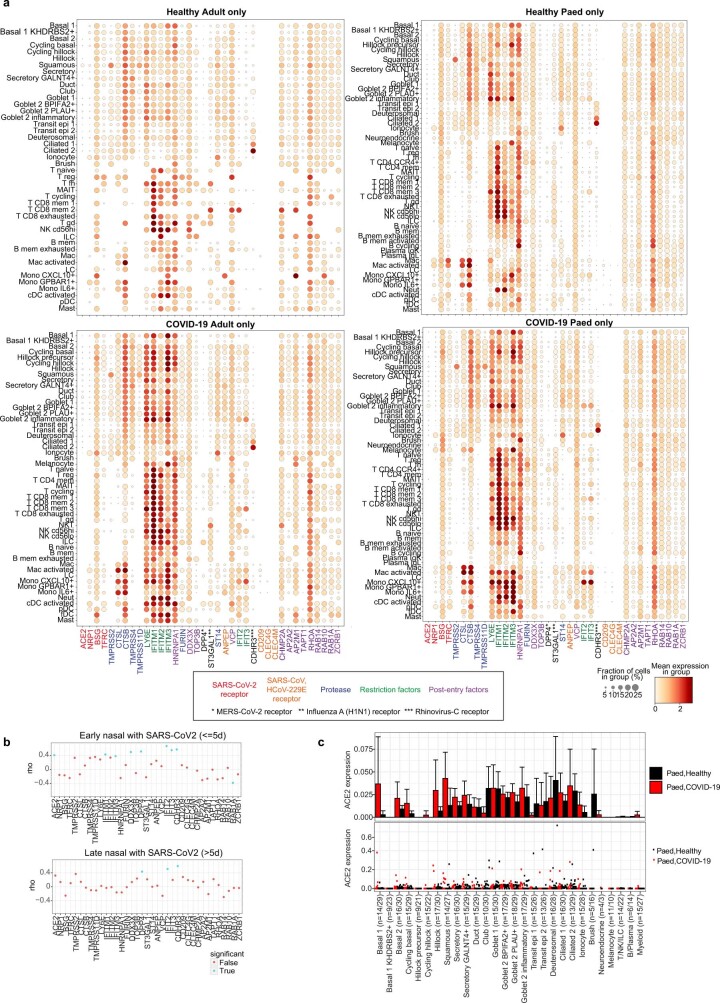
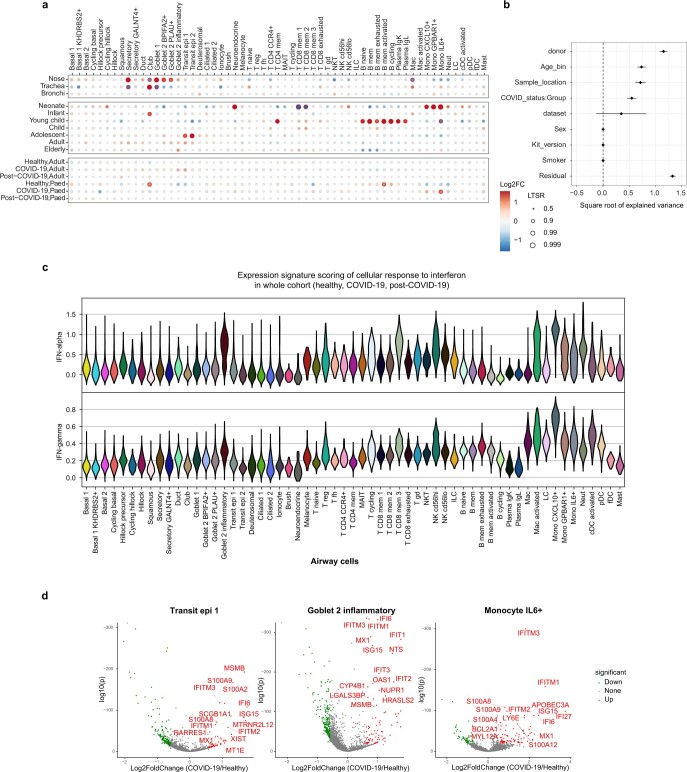
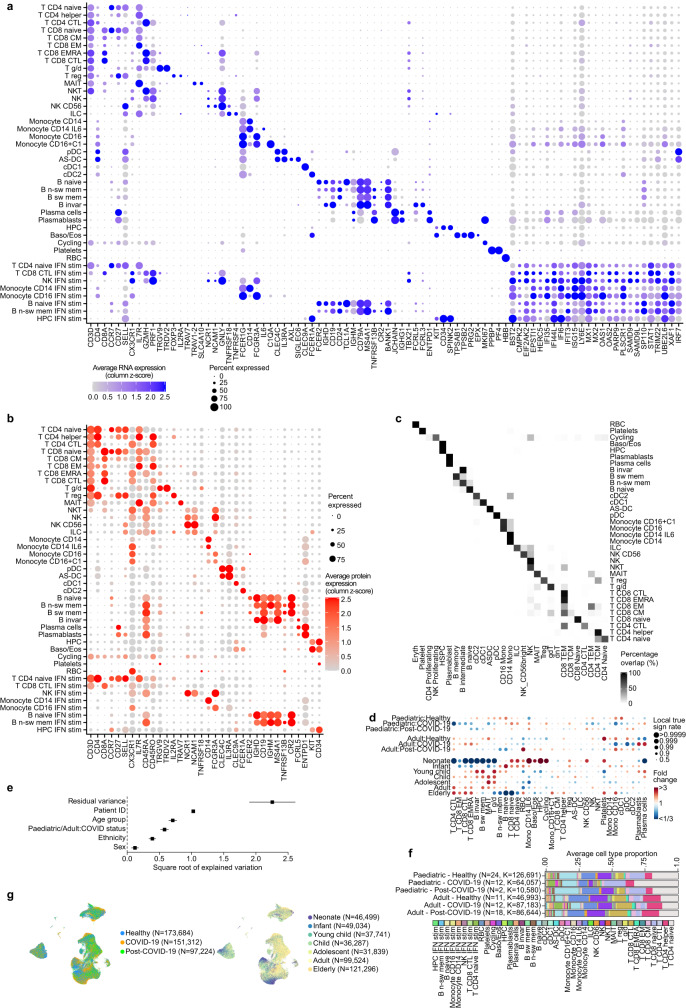
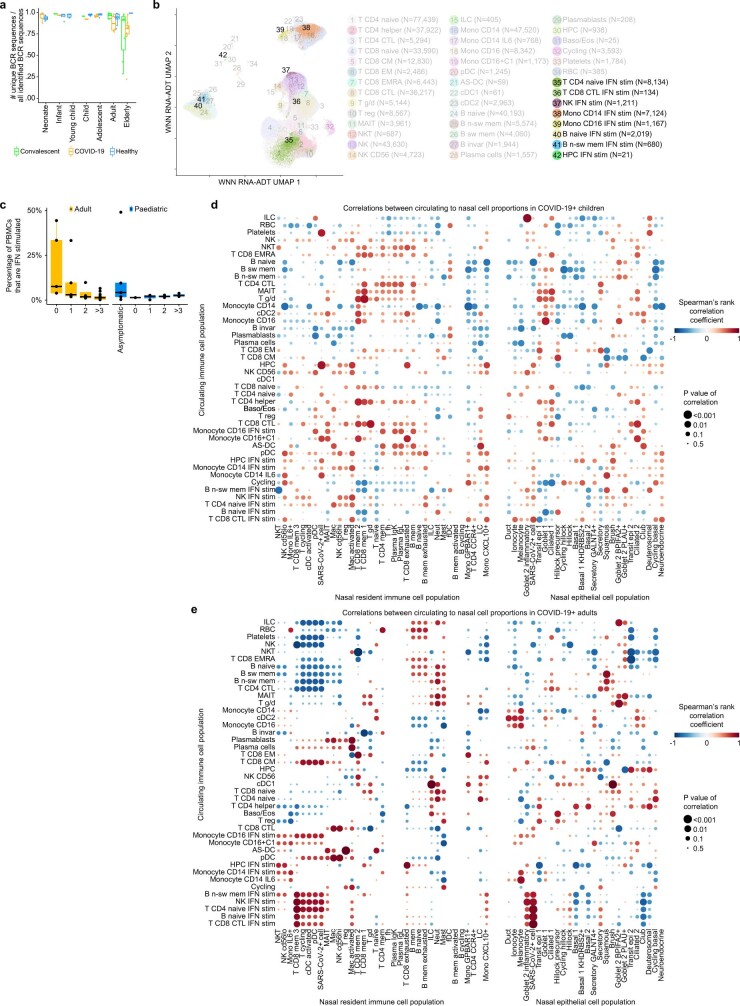
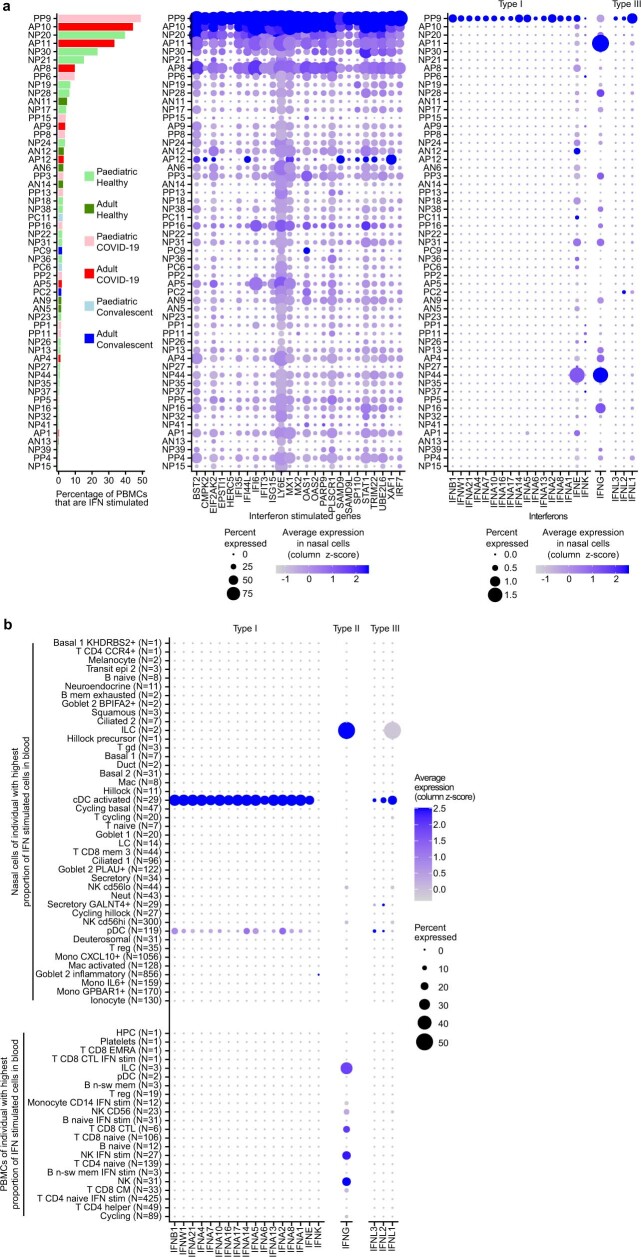
It is not fully understood why COVID-19 is typically milder in children1-3. Here, to examine the differences between children and adults in their response to SARS-CoV-2 infection, we analysed paediatric and adult patients with COVID-19 as well as healthy control individuals (total n = 93) using single-cell multi-omic profiling of matched nasal, tracheal, bronchial and blood samples. In the airways of healthy paediatric individuals, we observed cells that were already in an interferon-activated state, which after SARS-CoV-2 infection was further induced especially in airway immune cells. We postulate that higher paediatric innate interferon responses restrict viral replication and disease progression. The systemic response in children was characterized by increases in naive lymphocytes and a depletion of natural killer cells, whereas, in adults, cytotoxic T cells and interferon-stimulated subpopulations were significantly increased. We provide evidence that dendritic cells initiate interferon signalling in early infection, and identify epithelial cell states associated with COVID-19 and age. Our matching nasal and blood data show a strong interferon response in the airways with the induction of systemic interferon-stimulated populations, which were substantially reduced in paediatric patients. Together, we provide several mechanisms that explain the milder clinical syndrome observed in children.


Conflict of interest statement

In the past three years, S.A.T. has worked as a consultant for Genentech, Roche and Transition Bio, and is a remunerated member of the Scientific Advisory Boards of Qiagen, GlaxoSmithKline and Foresite Labs and an equity holder of Transition Bio. P.M. is a Medical Research Council-GlaxoSmithKline (MRC-GSK) Experimental Medicine Initiative to Explore New Therapies (EMINENT) clinical training fellow with project funding, has served on an advisory board for SOBI, outside the submitted work, and receives co-funding by the National Institute for Health Research (NIHR) University College London Hospitals Biomedical Research Centre (UCLH BRC).

Figures

Fig. 1
Fig. 1. Experimental outline and overview of results.
a, Visual overview of the experimental design, numbers of patients, samples taken and single cells sequenced. b, c, Uniform manifold approximation and projection (UMAP) visualization of annotated airway epithelial cells (b) and immune cells (c), with the cell numbers per cell type shown in parentheses. Bmem, memory B cells; cDCs, conventional dendritic cells; fDCs, follicular dendritic cells; ILCs, innate lymphoid cells; LCs, Langerhans cells; Mac, macrophages; MAIT, mucosal-associated invariant T cells; Mono, monocytes; NKT, natural killer T cells; pDCs, plasmacytoid dendritic cells; Tfh, T follicular helper cells; Tmem, memory T cells; Treg, regulatory T cells. A full list of abbreviations is provided in the Supplementary Note. d, Airway epithelial cells in the same UMAP as a with RNA velocity of major epithelial cell types. e, The fraction of SARS-CoV-2 viral unique molecular identifiers (UMI) (where ≥10 were detected per donor) relative to total UMI per donor, before filtering out of ambient RNA, in descending order coloured by infection collection interval (days). This was calculated as the days between sample collection and estimated onset of infection, based on the first symptom onset or a positive SARS-CoV-2 RT–qPCR test, whichever was reported first for symptomatic patients, and the latter for asymptomatic patients. f, The fraction of airway cells with detected SARS-CoV2 mRNA in each cell type (with immune cells in broad categories) in patients with COVID-19 with detected viral RNA (≥5 viral UMI per donor following filtering out ambient RNA). n = 9.
Fig. 2
Fig. 2. Differences in airway epithelial and immune cells between paediatric and adult patients with COVID-19.
a, The fold change in and statistical significance of major airway cell type proportions across location of sampling, age group and COVID-19 status, estimated by fitting Poisson generalized linear mixed models taking into account other technical and biological variables (Methods). The red circles indicate local true sign rate (LTSR) > 0.95. Paed, paediatric. b, Comparison of the expression signature of cellular response to IFNα, IFNγ, TNF signalling and neutrophil migration signalling across COVID-19 status and age groups. Neut, neutrophil. c, d, Heat maps comparing these expression signatures in healthy paediatric versus adult individuals, and in paediatric versus adult patients with COVID-19 in epithelial cells (c) (the colours indicate difference in scoring) and in immune cells (d). e, Comparison of expression signatures across COVID-19 severity and age groups. f, Representative five enriched Gene Ontology terms in genes that are upregulated in COVID-19 samples in transit epithelial 1 cells, goblet 2 inflammatory cells and IL-6+ monocytes. g, Immunohistochemistry confocal microscopy image showing S100A9 expression (green) by epithelial cells (EPCAM, magenta) in the nasal epithelium. Nuclei were stained with DAPI (blue). Scale bar, 20 μm. One representative section out of four technical replicates is shown. For b, e, pairwise comparisons were performed using two-sided Wilcoxon rank-sum tests; NS, P > 0.05; ****P < 2.2 × 10−16.
Fig. 3
Fig. 3. Differences in immune response between paediatric and adult patients with COVID-19.
a, UMAP visualization of 422,220 PBMCs incorporating both protein- and RNA-expression data. AS-DC, AXL+SIGLEC6+ dendritic cells; Baso/Eos, basophil/eosinophil; CM, central memory; CTL, cytotoxic T lymphocytes; EM, effector memory; EMRA, effector memory re-expressing CD45RA; invar, invariant; n-sw, non-switched; RBCs, red blood cells; sw, switched. b, The fold changes in the proportions of immune cell types across age group and disease status, taking into account confounding factors (Methods). Only cell types that change with a local true sign rate of >0.90 in the disease status groups are shown (all of the cell types are shown in Extended Data Fig. 6d, e). This analysis does not include the cells analysed in f. c, The fraction of unique TCR sequences in different age groups. d, Cell-type-marker expression alongside IFN-stimulated genes. The colour is scaled to all other cell types (Extended Data Fig. 6a). HPC, haematopoietic progenitor cell. e, The percentage of IFN-stimulated PBMCs of each symptomatic patient with COVID-19, grouped by the weeks since the onset of symptoms. f, Dot plot as in b showing the IFN-stimulated subpopulations (IFN-stim) across age and disease status. g, Correlation analysis comparing the blood and nose, using a Spearman rank-order correlation coefficient between relative proportion of PBMC subtypes (y axis) and nasal cell types (x axis) (Extended Data Fig. 7d, e.) h, IFN stimulation in PBMCs and nasal cells, and nasal IFN production in individuals with matched nasal and PBMC data (detailed gene expression dynamics are shown in Extended Data Fig. 8). Dots in c, e represent independent patient samples. For e, the box plots show the median (centre line), the first and third quartiles (box limits), and the whiskers extend to the lowest and highest values within 1.5 × interquartile range. All cell type abbreviations are provided in the Supplementary Note.
Fig. 4
Fig. 4. The local and systemic response to SARS-CoV-2 infection in children and adults.
Schematic of the difference in the airway and systemic immune response to SARS-CoV-2 infection between children and adults, reflecting the maturation of the immune landscape throughout childhood to adulthood. The key points are (1) immune cell proportions display strong maturation patterns throughout healthy childhood and adulthood, with a notable innate to adaptive immunity switch. (2) In the airways, the local innate IFN response to SARS-CoV-2 is stronger in paediatric airway immune cells compared with adult airway immune cells. (3) In the blood, the systemic innate IFN response to SARS-CoV-2 is stronger in adults, with a notable increase in IFN-stimulated subpopulations, whereas the adaptive immune response is characterized by expanded cytotoxic populations in adults compared with naive populations in children. (4) Epithelial cells with an inflammatory gene expression (S100A8/S100A9) are found enriched in patients with COVID-19. (5) Clonotype diversity decreases with age. The figure was generated using BioRender.com.
Extended Data Fig. 1
Extended Data Fig. 1. Overview of patient cohort.
(a) Overview of samples taken in our healthy, COVID-19 and post-COVID-19 cohorts. COVID-19 severity was classified as asymptomatic, mild (symptomatic without oxygen requirement or respiratory support), moderate (requiring oxygen without respiratory support) or severe (requiring non-invasive or invasive ventilation). Post-COVID-19 patients were sampled 3 months after recovering from severe COVID-19. (b) Timeline of sample collections from COVID-19 positive (18 adults and 19 paediatric) and post-COVID-19 (13 adults and 2 paediatric) patients enrolled in our study. Sample collections are shown relative to symptom onset and a SARS-CoV-2 positive RT–qPCR test, to which all patients are aligned.
Extended Data Fig. 2
Extended Data Fig. 2. Airway single-cell metadata, proportions and cell type markers.
(a) UMAP visualization of annotated airway scRNA-seq dataset from Fig. 1b coloured by COVID-19 status and age groups. (b) Bar plot comparing nasal epithelial cell type compositions across COVID-19 status and age groups. (c) Dot plots showing marker genes for annotated airway epithelial and immune cell types, with fraction of expressing cells and average expression within each cell type indicated by dot size and colour, respectively.
Extended Data Fig. 3
Extended Data Fig. 3. Supplementary information for airway cell type annotation.
(a) Detailed marker genes for distinct airway myeloid populations in our data set listing marker genes that are unique to each of the defined populations, whilst markers that are common to closely related myeloid cell types are shown on the right side of the panel. (b) Comparison of annotated cell types to published data sets. Marker genes for the three populations identified as differentiating to ciliated cells and markers of transit epithelial cells (Transit epi 1 and 2). Deu; deuterosomal, Ba-d; basal differentiating, IRC; interferon responsive cell. (c, d) Logistic regression based label transfer for the data sets in (c) Chua et al and (d) Ziegler et al. (e) Bar chart showing changes in nasal epithelial cell type proportions observed across age within our paediatric and adult healthy cohorts. Error bars indicate two times standard error of the mean.
Extended Data Fig. 4
Extended Data Fig. 4. Expression of viral entry-associated genes in the airways.
(a) Dot plots showing cell type expression of viral entry-associated genes within the upper airways of healthy adults (n = 7), healthy children (n = 30), COVID-19 adults (n = 10) and COVID-19 children (n = 18) respectively, included genes linked to SARS-CoV-2, SARS-CoV, MERS-CoV, Rhinovirus-C and Influenza A infections. The fraction of expressing cells and average expression within each cell type is indicated by dot size and colour, respectively. (b) Spearman correlation between the fraction of cells with detected viral RNA and the average expression of entry factors, as in (a), across cell types within the airways of COVID-19 patients samples (with viral reads ≥ 5) within 5 days of a positive SARS-CoV-2 qPCR test (Early) and those sampled longer than 5 days prior to onset of symptoms or positive SARS-CoV-2 qPCR test, whichever was longer (Late). Dots in blue indicate p < 0.05. (c) Expression of ACE2 in paediatric airway cells in each cell type averaged by donor (upper) and in each donor (lower) and coloured by COVID-19 status. Error bars indicate two times standard error of the mean across donors. Numbers in brackets indicate numbers of COVID-19 donors/healthy donors.
Extended Data Fig. 5
Extended Data Fig. 5. Airway cell type proportion analysis, interferon responses and differential gene expression.
(a) Dot plot showing fold change and statistical significance of all airway cell type proportions across location of sampling, age group and COVID-19 status, respectively, estimated by fitting Poisson generalized linear mixed models taking into account other technical and biological variables (see Methods). (b) Feature importance plot depicting the variance accounted for by each of the clinical and technical factors in our statistical analysis of cell type proportions within our airway scRNA-seq dataset. Factors were donor (patient), patients age (Age_bin), sample location (nasal, tracheal, bronchial), COVID-19 status group (COVID-19 positive, negative or post-COVID-19), dataset (UK cohort or Chicago Cohort) sex, 10x chromium 5′ single-cell sequencing kit version (kit_version) smoking status (non-smoker, ex-smoke or current), date and other factors (residual). Note: Error bars were not able to be generated for sex, Kit_version and smoker. 97 samples contributed to the estimation of variances and their standard errors. (c) Response to interferon by airway cell type. Scores of GO term gene signatures for the terms: response to type 1 interferon (GO:0035455 or GO:0034340) and interferon-gamma (GO:0034341) across cell types. Scores were calculated with Scanpy as the average expression of the signature genes subtracted with the average expression of randomly selected genes from bins of corresponding expression values. (d) Differential gene expression contrasting COVID-19 and non-COVID-19 samples in transit epithelial 1 cells, inflammatory goblet 2 cells, and mono IL-6 cells.
Extended Data Fig. 6
Extended Data Fig. 6. Expression of cell type markers and immune compartment dynamics.
(a) Expanded dot plot from Fig. 3d showing the RNA expression of cell type marker genes and interferon-stimulated genes. (b) Dotplot showing the cell surface protein expression of cell type marker proteins. In both a and b the size of the dot is scaled to the percentage of cells that have at least one count for each gene or protein, and the colour is scaled to the z-score normalized expression of each gene or protein. (c) Comparison of our manual cell type PBMC annotation vs an automated annotation performed by Azimuth. (d) Fold changes of immune cell type proportions across age group and disease status. Age and disease specific changes were deconvoluted by fitting Poisson generalized linear mixed models taking into account other confounders such as sex and ethnicity. (e) Feature importance plot showing the variance that can be explained by the different features that were included in the Poisson linear mixed model that was fitted on the cell type proportions in the PBMC data. 80 samples contributed to the estimation of variances and their standard errors. (f) Bar plots showing the average immune cell proportions in PBMC samples. Cell types are colour coded and grouped based on their age group and disease status. N denotes the amount of samples in each group, while K denotes the amount of cells per group. (g) UMAPs as in Fig. 3a in which the COVID-19 status (left panel) and the age group (right panel) is visualized for each cell.
Extended Data Fig. 7
Extended Data Fig. 7. Immune cell population dynamics.
(a) Fractions of unique BCR sequences show the differences in immune repertoire diversity over age and disease. (b) UMAP visualization as in Fig. 3a showing the annotated interferon-stimulated subpopulations in clusters 35−42. (c) Boxplot showing the percentage of PBMCs that are interferon-stimulated in asymptomatic or symptomatic COVID-19 patients, grouped by the weeks since the onset of symptoms, and separated for adults (left) and children (right).(d) Dotplot of Spearman correlations between nasal and blood cell type proportions in paediatric COVID-19 patients and (e) in adult COVID-19 patients. In both d and e, cell type proportions in the nose (x-axis) are compared to the blood (y-axis). Correlations shown in Fig. 3g present a zoom in of the adult panel. Rows and columns in both dotplots are clustered by hierarchical clustering on the combined matrices. The size of the dots is scaled by the significance of each correlation. Colour is scaled by the Spearman rank-correlation coefficient. If a blood - nose cell type combination shows a positive correlation, this is indicative that if the blood cell type changes in proportion, the nasal cell type changes accordingly, and vice versa. Dots in a and c represent independent patient samples. Box plots were drawn with the centre line as the median of the data distribution, the hinges as the first and third quartiles, and with the whiskers extending to the lowest and highest values that were within 1.5 × interquartile range of the upper or the lower hinge.
Extended Data Fig. 8
Extended Data Fig. 8. Interferon expression in COVID-19 patient with highest amount of interferon-stimulated blood cells.
(a) Ranked barplot and matched dotplots as in Fig. 3h, but showing the expression of all genes that make up the interferon-stimulated gene signature (middle) and the expression of all interferons (right) in all cells, instead of averaged signatures gene expression signatures in specific cell types. (b) Dotplot related to Fig. 3h showing the expression of all interferons in all nasal resident (top) and circulating (bottom) cell types that were present in this individual. The size of the dot is scaled to the percentage of cells that have at least one count for each gene or protein, and the colour is scaled to the z-score normalized expression of each gene or protein.
Extended Data Fig. 9
Extended Data Fig. 9. Metagenomic analysis of patient sample reads that were not mapped to the human genome.
(a) Dotplot showing the amount of cells that harbour reads aligned to archaea, bacteria, eukaryota (including human reads that initially did not align to the human transcriptome by STARsolo) and viruses. (b) Dotplot showing the amount of cells that harbour reads to a selection of disease-relevant bacteria and viruses. Apart from SARS-CoV-2 and non-specific signal found in most samples, we did not detect any pathogens that were highly abundant in samples of interest.

References

    1. Swann OV, et al. Clinical characteristics of children and young people admitted to hospital with covid-19 in United Kingdom: prospective multicentre observational cohort study. Brit. Med. J. 2020;370:m3249. doi: 10.1136/bmj.m3249. - DOI - PMC - PubMed
    1. Castagnoli R, et al. Severe acute respiratory syndrome coronavirus 2 (SARS-CoV-2) infection in children and adolescents: a systematic review. JAMA Pediatr. 2020;174:882–889. doi: 10.1001/jamapediatrics.2020.1467. - DOI - PubMed
    1. Ledford H. Deaths from COVID ‘incredibly rare’ among children. Nature. 2021;595:639–639. doi: 10.1038/d41586-021-01897-w. - DOI
    1. Hoffmann M, et al. SARS-CoV-2 cell entry depends on ACE2 and TMPRSS2 and is blocked by a clinically proven protease inhibitor. Cell. 2020;181:271–280. doi: 10.1016/j.cell.2020.02.052. - DOI - PMC - PubMed
    1. Pang L, et al. Influence of aging on deterioration of patients with COVID-19. Aging. 2020;12:26248–26262. doi: 10.18632/aging.202136. - DOI - PMC - PubMed

Publication types

MeSH terms