. 2022 Feb;41(8):1178-1189.
doi: 10.1038/s41388-021-02084-x. Epub 2021 Dec 22.

MiR-138 is a potent regulator of the heterogenous MYC transcript population in cancers

Affiliations

MiR-138 is a potent regulator of the heterogenous MYC transcript population in cancers

Ng Desi et al. Oncogene. 2022 Feb.

Abstract

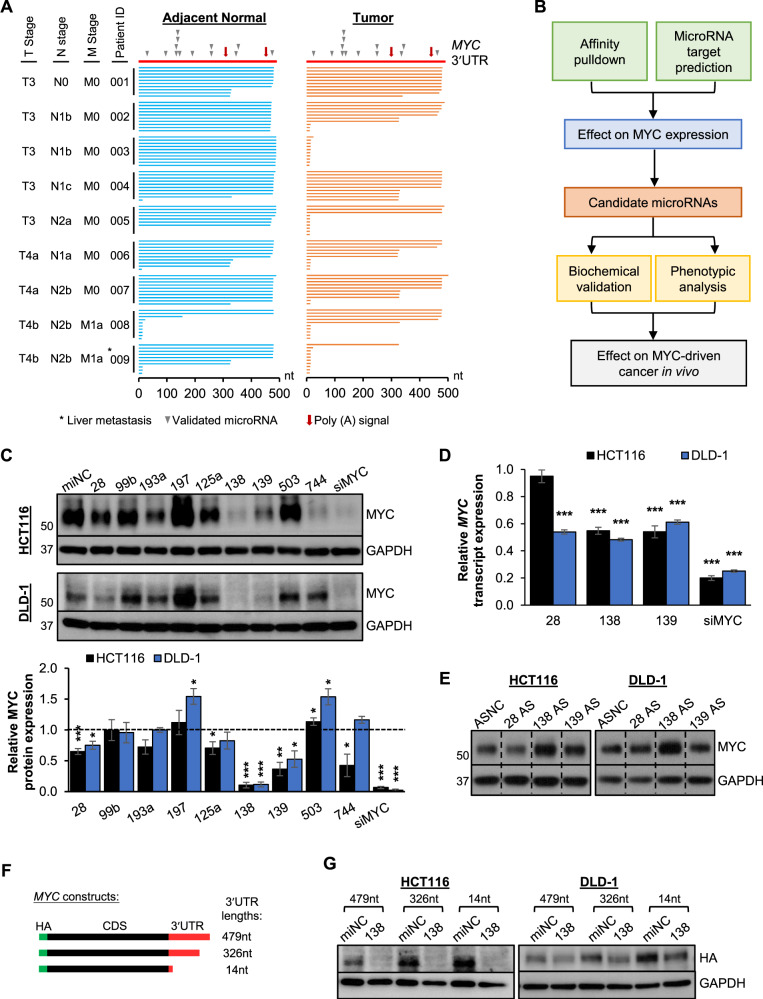
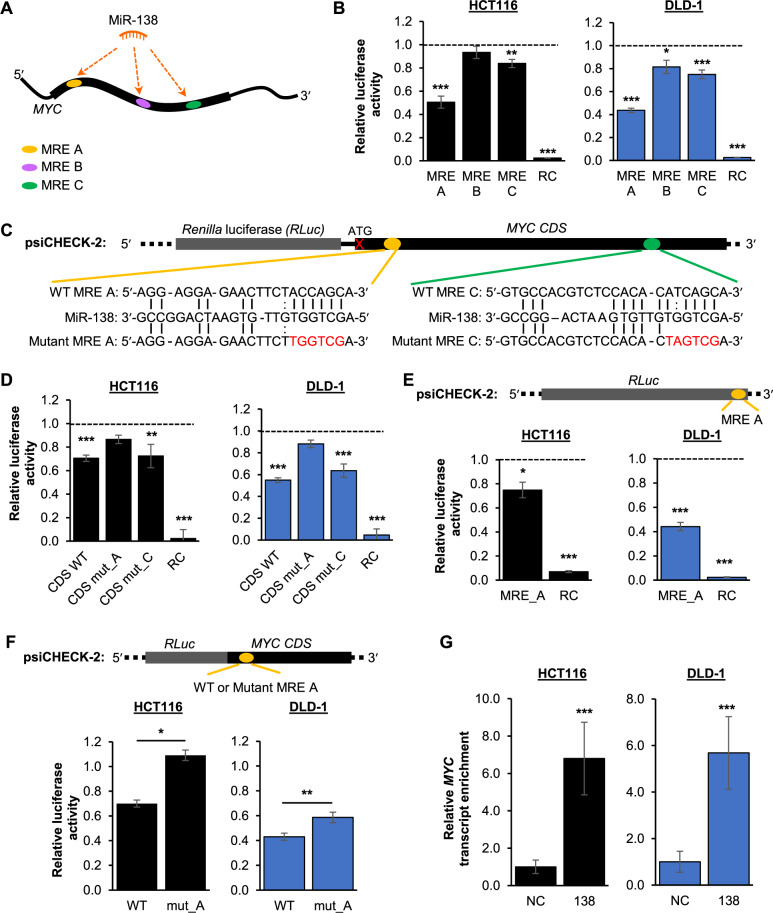
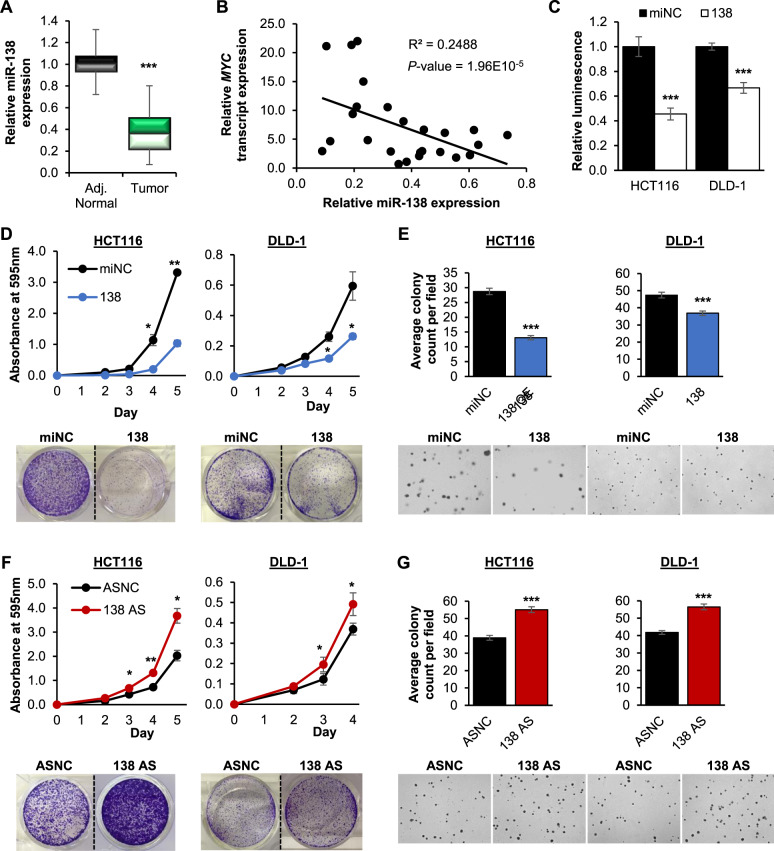
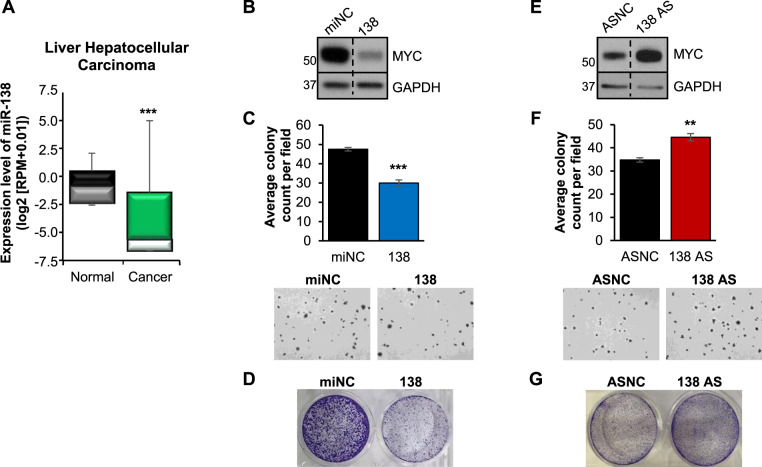
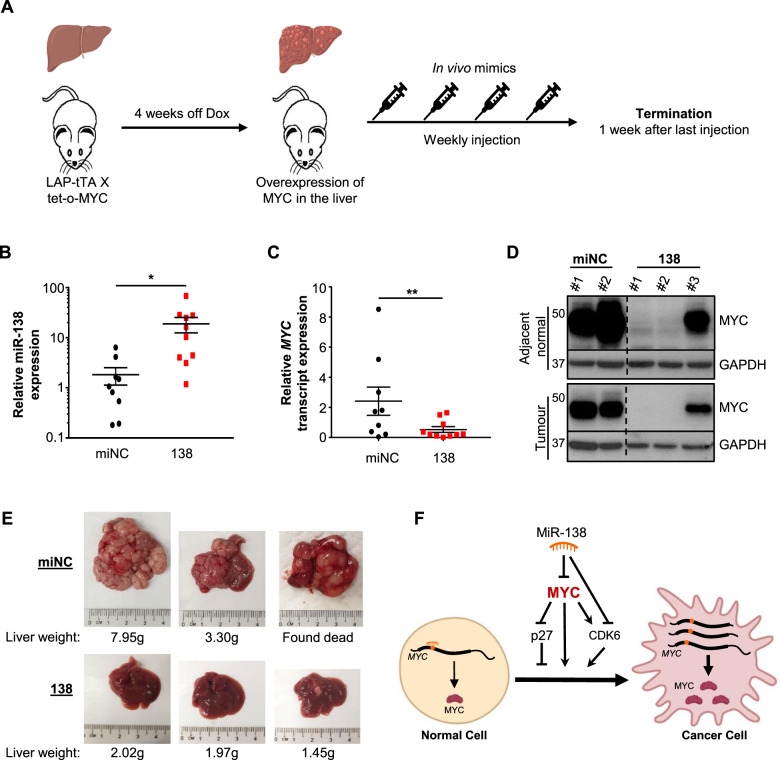
3'UTR shortening in cancer has been shown to activate oncogenes, partly through the loss of microRNA-mediated repression. This suggests that many reported microRNA-oncogene target interactions may not be present in cancer cells. One of the most well-studied oncogenes is the transcription factor MYC, which is overexpressed in more than half of all cancers. MYC overexpression is not always accompanied by underlying genetic aberrations. In this study, we demonstrate that the MYC 3'UTR is shortened in colorectal cancer (CRC). Using unbiased computational and experimental approaches, we identify and validate microRNAs that target the MYC coding region. In particular, we show that miR-138 inhibits MYC expression and suppresses tumor growth of CRC and hepatocellular carcinoma (HCC) cell lines. Critically, the intravenous administration of miR-138 significantly impedes MYC-driven tumor growth in vivo. Taken together, our results highlight the previously uncharacterized shortening of the MYC 3'UTR in cancer, and identify miR-138 as a potent regulator of the heterogenous MYC transcript population.


Conflict of interest statement

The authors declare no competing interests.

Figures

Fig. 1
Fig. 1. Identification of potential MYC CDS-targeting miRNAs.
A Schematic representation of MYC 3′UTR isoforms detected by 3′ RACE in nine pairs of CRC tumor and adjacent normal patient samples (N = 9). B Flowchart outlining the workflow to identify and functionally characterize miRNAs that target the MYC CDS. MiRNAs were identified via affinity pulldown by MS2-tagged RNA Affinity Purification (MS2-TRAP) and miRNA target prediction by RNA22. C Western blot (top panel) and densitometry quantification (bottom panel) of MYC protein expression upon the overexpression of candidate miRNAs in HCT116 and DLD-1 cell lines. D RT-qPCR analysis of MYC transcript expression upon the overexpression of miR-28-5p, miR-138 and miR-139-3p in HCT116 and DLD-1 cell lines. E Western blot analysis of MYC protein expression upon miRNA inhibition by antisense miRNA inhibitors (AS) in HCT116 (left panel) and DLD-1 (right panel). F Schematic illustrating the HA-tagged MYC constructs with different 3′UTR lengths. G Western blot analysis of HA-tagged MYC protein expression upon miR-138 overexpression (138) in HCT116 (left panel) and DLD-1 (right panel). Mean ± SEM; N ≥ 3. *P < 0.05; **P < 0.01; ***P < 0.001.
Fig. 2
Fig. 2. Validation of miR-138 as a MYC CDS-targeting miRNA.
A Schematic representation of predicted miR-138 MREs on the MYC transcript. The thick line indicates the MYC CDS, while the thin lines indicate the UTRs. B Effect of miR-138 overexpression on the luciferase activity of the respective MRE-reporter constructs in HCT116 (left panel) and DLD-1 (right panel) cell lines. RC denotes the reverse complement of miR-138 which was used as positive control. C Schematic representation of the ATG-less MYC CDS cloned into the psiCHECK-2 vector. Location and sequences of the wild-type (WT) and mutant MREs A (yellow oval) and C (green oval) are depicted. Red font indicates the mutated nucleotides. The cross indicates the absence of the start codon ATG. D Effect of miR-138 overexpression on the luciferase activity of the MYC CDS reporter constructs with mutated MREs (CDS mut) compared to the wild-type CDS reporter (CDS WT) in HCT116 (left panel) and DLD-1 (right panel) cell lines. E Effect of miR-138 overexpression on the luciferase activity of the Renilla luciferase (RLuc) gene fused with MRE A in HCT116 (left panel) and DLD-1 (right panel) cell lines. Top panel illustrates the modification of RLuc gene construct. F Effect of miR-138 overexpression on the luciferase activity of the RLuc and MYC CDS fusion reporter construct with mutated MRE A (mut_A) compared to the wild-type MYC CDS (WT) in the HCT116 (left panel) and DLD-1 (right panel) cell lines. The top panel illustrates the fusion gene construct. G RT-qPCR analysis of MYC transcript enrichment upon biotinylated miR-138 pulldown in HCT116 (left panel) and DLD-1 (right panel) cell lines. (B, D, E and F) Mean ± SEM; N ≥ 3. G Mean ± STD; N ≥ 3. *P < 0.05; **P < 0.01; ***P < 0.001.
Fig. 3
Fig. 3. MiR-138 regulates MYC target gene expression.
A Western blot (left panel) and densitometry quantification (right panel) showing the protein expression of MYC target genes upon the overexpression of miR-138 (138) in HCT116 and DLD-1 cell lines. B RT-qPCR analysis of CDK4, CDK6 and p27 transcript enrichment upon biotinylated miR-138 pulldown in HCT116 and DLD-1 cell lines. C The sequences of the wild-type (WT) and mutant miR-138 MREs on the CDK6 transcript (top panel) and the effect of miR-138 overexpression on the luciferase activity of the MRE-reporter constructs (bottom panel) in HCT116 (left panel) and DLD-1 (right panel) cell lines. RC denotes the reverse complement of miR-138 which was used as positive control. D Western blot (top panel) and densitometry quantification (bottom panel) of p27 protein expression upon the knockdown of MYC in HCT116 and DLD-1 cell lines. Mean ± SEM; N ≥ 3. *P < 0.05; **P < 0.01; ***P < 0.001.
Fig. 4
Fig. 4. MiR-138 possesses tumor-suppressive properties in CRC.
A RT-qPCR quantification of miR-138 expression in tumor and adjacent normal samples from CRC patients (N = 25). B Correlation between miR-138 and MYC transcript expression in tumor samples of CRC patients (N = 25). C CellTiter-Glo® assay examining the effect of miR-138 overexpression on the cell viability of HCT116 and DLD-1 cells. D, E Effect of miR-138 overexpression (138) on anchorage-dependent (D) and anchorage-independent (E) growth of HCT116 (left panel) and DLD-1 (right panel) cells. F, G Effect of miR-138 inhibition (138 AS) on anchorage-dependent (F) and anchorage-independent growth (G) of HCT116 (left panel) and DLD-1 (right panel) cells. The representative images of anchorage-dependent and -independent growth are shown at the bottom panels. C, E and G Mean ± SEM; N ≥ 3. D and F Mean ± STD; N ≥ 3. *P < 0.05; **P < 0.01; ***P < 0.001.
Fig. 5
Fig. 5. MiR-138 downregulates MYC expression and inhibits growth in liver cancer.
A MiR-138 expression in hepatocellular carcinoma (HCC) [50 normal versus 370 cancer] based on the TCGA dataset) [33]. B, C Effect of miR-138 overexpression (138) on MYC protein level (B) and the anchorage-independent growth (C) of HepG2 cells. Representative images of the anchorage-independent growth are shown at the bottom panel. D Representative image of anchorage-dependent growth of HepG2 cells upon miR-138 overexpression (138). E, F Effect of miR-138 inhibition (138 AS) on MYC protein level (E) and the anchorage-independent growth (F) of HepG2 cells. Representative images of the anchorage-independent growth are shown at the bottom panel. G Representative image of anchorage-dependent growth of HepG2 cells upon miR-138 inhibition (138 AS). Mean ± SEM; N ≥ 3. **P < 0.01; ***P < 0.001.
Fig. 6
Fig. 6. MiR-138 suppresses MYC-driven carcinogenesis in vivo.
A Schematic showing the timeline of the intravenous miR-138 mimic injection into transgenic mice. B, C RT-qPCR analyses of miR-138 (B) and MYC transcript (C) expression in the liver upon miNC and miR-138 mimic injection [9 miNC versus 10 miR-138 mimics injection]. D Representative Western blot analysis of MYC protein levels upon miNC and miR-138 mimic injection. E Representative images of the mouse livers upon miNC (top panel) and miR-138 (bottom panel) injection. (E – I) Samples were harvested one week after the final mimic injection. F Schematic diagram summarizing the effects of miR-138 on MYC and cancer development. Orange circle denotes miR-138 MRE. Mean ± SEM. *P < 0.05; **P < 0.01.

References

    1. Sandberg R, Neilson JR, Sarma A, Sharp PA, Burge CB. Proliferating cells express mRNAs with shortened 3’ untranslated regions and fewer microRNA target sites. Science. 2008;320:1643–7. - PMC - PubMed
    1. Mayr C, Bartel DP. Widespread shortening of 3’UTRs by alternative cleavage and polyadenylation activates oncogenes in cancer cells. Cell. 2009;138:673–84. - PMC - PubMed
    1. Misiewicz-Krzeminska I, Sarasquete ME, Vicente-Duenas C, Krzeminski P, Wiktorska K, Corchete LA, et al. Post-transcriptional Modifications Contribute to the Upregulation of Cyclin D2 in Multiple Myeloma. Clin Cancer Res. 2016;22:207–17. - PubMed
    1. Akman BH, Can T, Erson-Bensan AE. Estrogen-induced upregulation and 3’-UTR shortening of CDC6. Nucleic Acids Res. 2012;40:10679–88. - PMC - PubMed
    1. Nesbit CE, Tersak JM, Prochownik EV. MYC oncogenes and human neoplastic disease. Oncogene. 1999;18:3004–16. - PubMed