. 2022 Feb;18(2):152-160.
doi: 10.1038/s41589-021-00917-0. Epub 2021 Dec 22.

Temperature-responsive optogenetic probes of cell signaling

Affiliations

Temperature-responsive optogenetic probes of cell signaling

William Benman et al. Nat Chem Biol. 2022 Feb.

Abstract

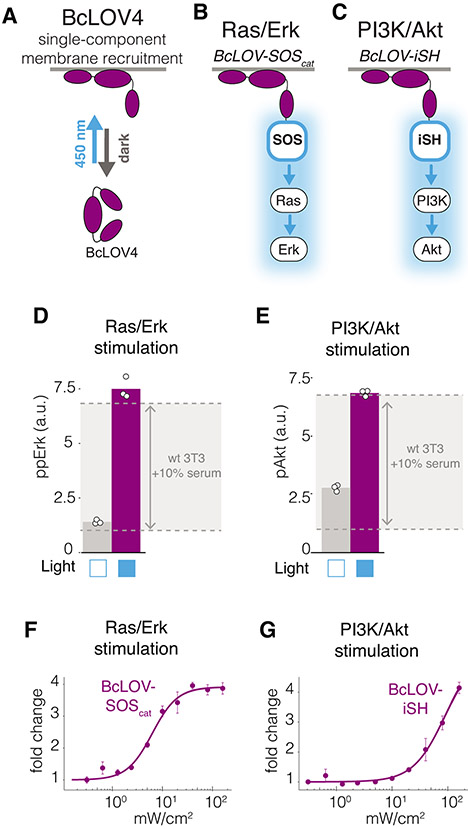
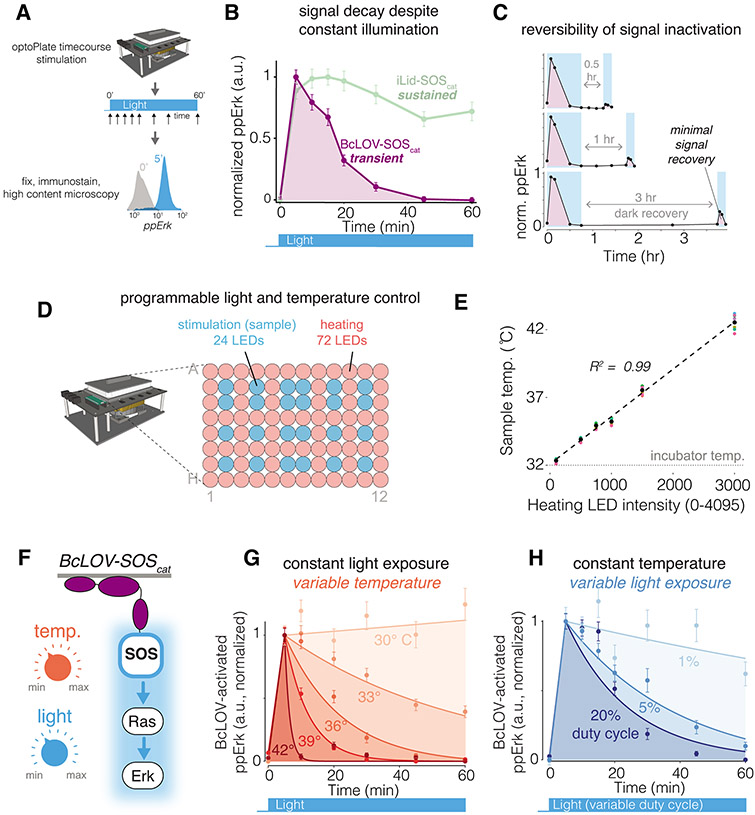
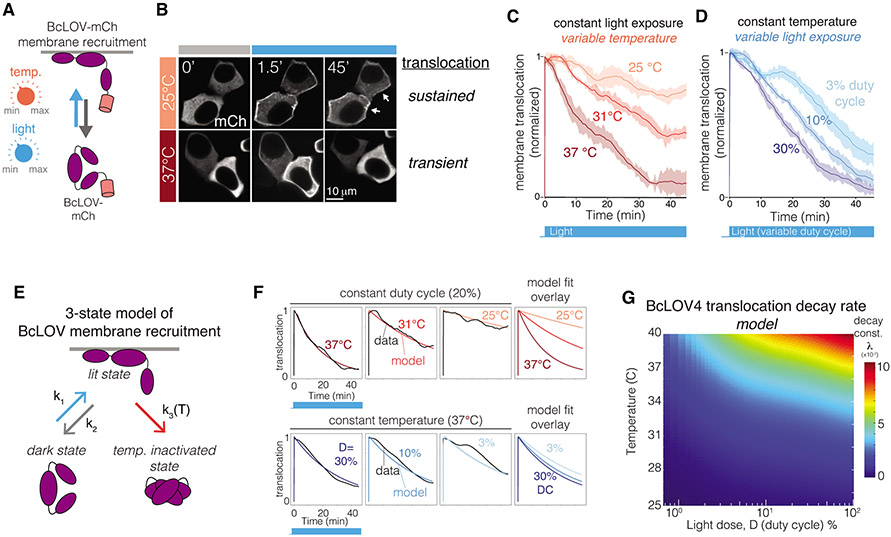
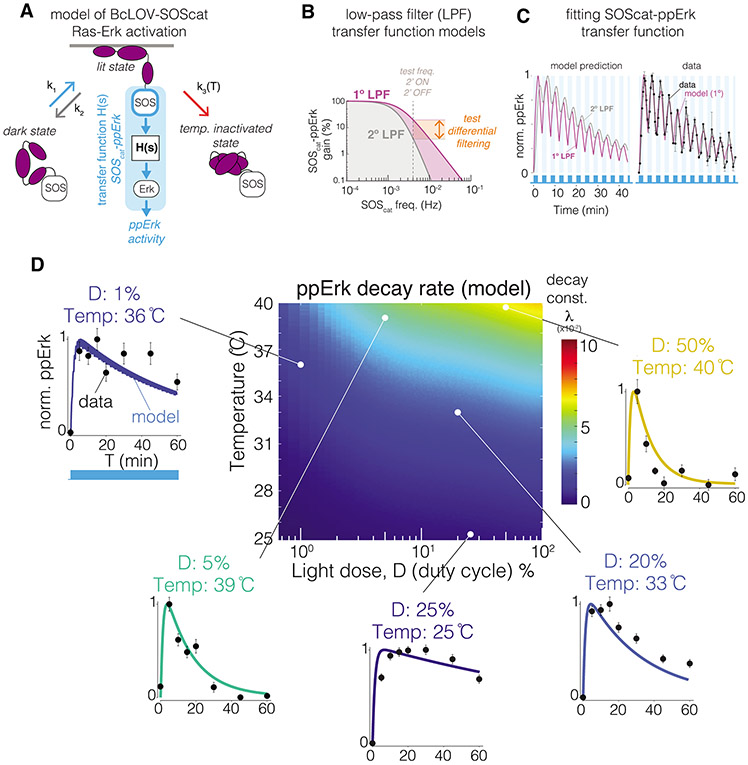
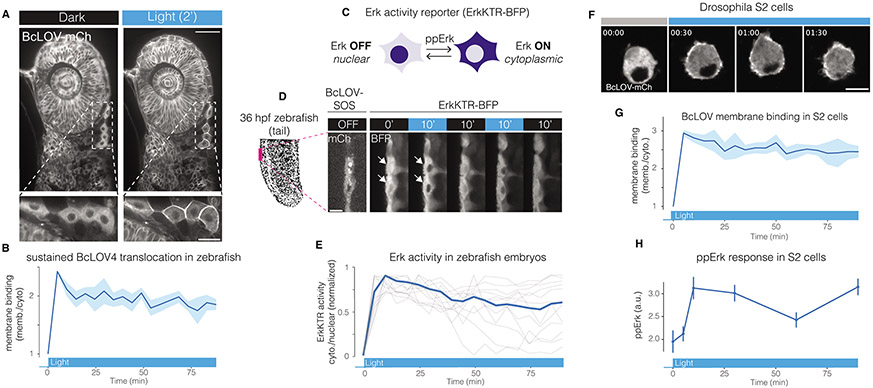
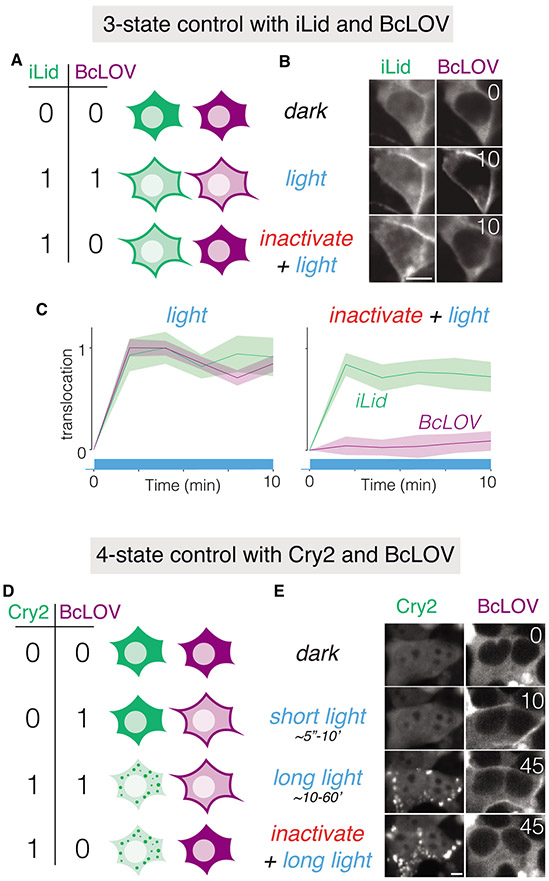
We describe single-component optogenetic probes whose activation dynamics depend on both light and temperature. We used the BcLOV4 photoreceptor to stimulate Ras and phosphatidyl inositol-3-kinase signaling in mammalian cells, allowing activation over a large dynamic range with low basal levels. Surprisingly, we found that BcLOV4 membrane translocation dynamics could be tuned by both light and temperature such that membrane localization spontaneously decayed at elevated temperatures despite constant illumination. Quantitative modeling predicted BcLOV4 activation dynamics across a range of light and temperature inputs and thus provides an experimental roadmap for BcLOV4-based probes. BcLOV4 drove strong and stable signal activation in both zebrafish and fly cells, and thermal inactivation provided a means to multiplex distinct blue-light sensitive tools in individual mammalian cells. BcLOV4 is thus a versatile photosensor with unique light and temperature sensitivity that enables straightforward generation of broadly applicable optogenetic tools.


Figures

Figure 1.
Figure 1.. Single-component BcLOV4 fusions allow control of Ras and PI3K signaling.
A) BcLOV4 binds the cell membrane when exposed to blue light. The three BcLOV4 domains represent the LOV, DUF, and RGS domains, as previously described B) Light-induced membrane recruitment of BcLOV4 fused to the SOScat catalytic domain will induce Ras/Erk signaling. C) Analogous recruitment of the iSH domain will induce PI3K/Akt signaling. D,E) Five minutes of blue light stimulation (160 mW/cm2 at 20% duty cycle) increases intracellular ppErk levels in cells that express BcLOV-SOScat (D) and increases pAkt in cells that express BcLOV-iSH (E). Grey zone indicates the change in ppErk or pAkt in wild-type cells that were stimulated with 10% calf serum for 10 minutes. Data represent means of three biologically independent replicates, each representing the mean signal intensity from ~2000-4000 single cells. F,G) Light intensity dose-response of (F) ppErk fold-change induction in BcLOV-SOScat-expressing cells or (G) pAkt fold-change induction in BcLOV-iSH cells at 100% duty cycle after 5 minutes of illumination. Data represent means +/− SD of three biologicially independent replicates, each representing the mean signal intensity from ~300-500 single cells. All stimulation in A-G was achieved using the optoPlate-96. All stimulation and environmental conditions for all figures can be found in Supplementary Table 1.
Figure 2.
Figure 2.. BcLOV-induced signaling dynamics depend on experimental temperature and light exposure.
A) Schematic of experimental protocol. B) Sustained stimulation of BcLOV-SOScat (160 mW/cm2 at 20% duty cycle) reveals that ppErk signal decays rapidly after an initial signal increase, whereas activation of iLID-SOScat remains sustained. C) Recovery (dark) periods of up to 3 hr after signal decay do not permit recovery of activatible BcLOV-SOScat, suggesting that BcLOV4 inactivation is effectively irreversible. D) BcLOV-SOScat signal dynamics were examined under variable light and temperature conditions. E) Schematic for how the optoPlate-96 was repurposed to allow independent control of experimental light and temperature conditions. For more information, see Supplementary Figure 7. F) Steady-state sample temperature was a linear function of the intensity of the 72 heater LEDs (precise intensity-temperature relationship should be determined empirically for each individual optoPlate). See Methods. G) At a given light exposure level (here, 160 mW/cm2 at 20% duty cycle), BcLOV-SOScat signal decays more rapidly at higher temperatures. H) At a given temperature (here, 36°C), BcLOV-SOScat decay increases with increased light exposure (variable duty cycles of 160 mW/cm2 light). Data points in B/C/G/H represent the mean +/− SEM of ~1000-4000 individual cells. Traces in G/H are exponential decay functions fit to data points at each temperature and duty cycle, as described in the Methods section. Data are normalized between the min and max of each trace. Normalization was performed separately for each temperature and duty cycle to highlight the change in the rate of BcLOV-SOScat inactivation rather than absolute signal. Absolute signal traces can be found in Supplementary Figure 8.
Figure 3.
Figure 3.. BcLOV4 membrane translocation dynamics depend on temperature and light exposure.
A) BcLOV-mCh membrane recruitment was quantified at various temperatures and light exposures using live cell imaging. B) Representative images of membrane recruitment at low and high temperatures. Activation at 25 °C permitted sustained membrane recruitment while recruitment at 37 °C was transient (stimulation performed at 1.45 W/cm2 and 3% duty cycle). Image brightness was adjusted at each time point for clarity to account for photobleaching. C) Quantification of membrane recruitment at various temperatures (1.45 W/cm2 at 3% duty cycle) reveals a temperature-dependent decay of membrane translocation. D) Quantification of membrane recruitment at various light exposures (at 36 °C and 1.45 W/cm2) shows light-dependent decay of BcLOV-mCh translocation. Each trace is the mean membrane fluorescence +/− SEM of three biologically independent samples, with each replicate representing the mean of ~100 cells. See Supplemental Figure 10 for unnormalized traces and quantification workflow. E) Schematic of a 3-state model of BcLOV4 membrane translocation. F) Fitting the model to live-cell translocation data provides parameter values for k1, k2, and k3(T). G) Heat map depicts the decay rate of BcLOV4 membrane localization as a function of temperature and light exposure. Decay rates were calculated by simulating sustained illumination over a range of duty cycles and temperatures and fitting the modeled decay rate to a single exponential decay. Color indicates the decay constant λ (1 divided by the time to reach 37% of maximum signal). Larger λ indicates faster decay. See Supplementary Figure 10, 13, and Methods for imaging and model details.
Figure 4.
Figure 4.. Modeling predicts BcLOV-SOScat-induced ppErk dynamics and reveals dynamic filtering properties of Ras/Erk signaling.
A) A model of ppErk activation was developed by integrating the BcLOV4 membrane translocation model with a transfer function model that describes the input/output response of SOScat membrane localization (input) to ppErk activation (output). B) Filtering properties of a 1° vs 2° low pass filter (LPF). 1° LPFs attenuate high frequency inputs less than 2° low pass filters. C) A 1° LPF with 2 mHz cutoff frequency best describes ppErk dynamics when stimulated with fast 2’ON/2’OFF BcLOV-SOScat oscillations. Data points are the mean +/− SD of three biologically independent replicates, with each replicate representing the mean of ~1000-2000 cells. D) Heat map depicts the predicted Erk activation dynamics resulting from BcLOV4 membrane translocation dynamics over the indicated light and temperature conditions. Plots show model predictions of Erk activation at the indicated experimental conditions, and data points show experimental results. Datapoints represent means +/− SEM of ~1000-4000 cells. Unnormalized plots are presented in Supplementary Figure 14. See Methods for model details.
Figure 5.
Figure 5.. BcLOV4 and BcLOV-SOScat in zebrafish embryos and Drosophila cells.
A) Blue-light induced membrane translocation of BcLOV-mCherry in a zebrafish embryo (24 hours post fertilization [hpf]). Scale bar = 50 μm, inset scale bar = 20 μm. B) BcLOV-mCh translocation is sustained over 90 min in zebrafish embryos. Data represent mean +/− SD of 10 cells. C) Schematic of ErkKTR activity. ErkKTR is nuclear when Erk signaling is off and translocates to the cytoplasm when Erk is activated. D) The Ras/Erk pathway can be reversibly stimulated over multiple cycles in zebrafish embryos (24 hpf) that co-express express BcLOV-SOScat and ErkKTR-BFP, as measured by ErkKTR-BFP translocation. White arrows highlight nuclei where ErkKTR translocation is evident. Scale bar = 10 μm. E) Sustained illumination of BcLOV-SOScat permits sustained elevated Erk activity in 24 hpf zebrafish embryos. Plot shows ErkKTR cytoplasmic/nuclear ratios of 12 single cells (light grey; blue trace represents mean) measured over two experiments. Trajectories are normalized between 0 and 1 to permit comparison between experiments. For (A-E) stimulation was performed using 1.45 W/cm2 488 nm light at 1.5% duty cycle. F) BcLOV-mCh membrane translocation in Drosophila S2 cells stimulated with blue light (1.45 W/cm2 at 3% duty cycle) for 90 min. Scale bar = 10 μm. G) Quantification of (F) shows sustained membrane translocation in S2 cells. Data represent mean +/− SD of 10 cells. H) Sustained stimulation of BcLOV-SOScat in S2 cells shows sustained elevated ppErk levels over 90 min, measured by immunofluorescence. Data is the mean +/− SD of three biologically independent samples, with each replicate representing the mean of ~100-200 cells.. Stimulation was performed at (160 mW/cm2 at 20% duty cycle). All experiments shown in Figure 5 were performed at room temperature.
Figure 6.
Figure 6.. BcLOV4 temperature sensitivity enables orthogonal multiplexing of multiple blue-light sensitive tools in single cells.
A) Schematic of how coexpression of BcLOV4 and iLID/sspB can allow blue light control of 3 separate cell states. B) Coexpression in of BcLOV-mCh and iLid/sspB-GFP in HEK 293T cells demonstrates 3-state control using blue light with or without temperature inactivation. Light stimulation was performed at 37 °C using 1 s of blue light (1.45 W/cm2) every 30 seconds for 10 minutes in the presence or absence of prior BcLOV inactivation. Prior inactivation was achieved by illuminating with these same light settings for 1 hour. C) Quantification of light-induced membrane binding (activation) of BcLOV4 and iLID in the absence (left) or presence (right) of prior heat inactivation. Traces are the normalized mean +/− SEM of three biologically independent replicates, with each replicate representing the mean of ~100 cells. D) Schematic of how co-expression of BcLOV4 and Cry2 can allow blue-light control of 4 separate cell states. E) Co-expression of BcLOV-GFP and Cry2-mCh in HEK 293T cells demonstrates 4-state control. “Short light” (10 min) and “long light” (45 min) exposure were both achieved using 100 ms of light (1.45 W/cm2) every 30 s at 30 °C. To achieve the Cry2-ONLY state (bottom row), images were acquired after BcLOV was inactivated using 1 s of blue light (1.45 W/cm2) every 30 seconds for 45 min at 37 °C. Scale bars = 10 μM. See Methods and Supplementary Table 1 for full illumination conditions. Time is given in minutes. The multiplexing experiments depicted are representative of two independent experiments for each pair of optogenetic proteins.

Comment in

  • Optogenetics in the hot seat.
    Wilson MZ. Wilson MZ. Nat Chem Biol. 2022 Feb;18(2):118-119. doi: 10.1038/s41589-021-00928-x. Nat Chem Biol. 2022. PMID: 34937908 No abstract available.

References

    1. Christie JM, Salomon M, Nozue K, Wada M & Briggs WR LOV (light, oxygen, or voltage) domains of the blue-light photoreceptor phototropin (nph1): binding sites for the chromophore flavin mononucleotide. Proc. Natl. Acad. Sci. U. S. A 96, 8779–8783 (1999). - PMC - PubMed
    1. Schwerdtfeger C & Linden H VIVID is a flavoprotein and serves as a fungal blue light photoreceptor for photoadaptation. EMBO J. 22, 4846–4855 (2003). - PMC - PubMed
    1. Dietler J et al. A Light-Oxygen-Voltage Receptor Integrates Light and Temperature. J. Mol. Biol 433, 167107 (2021). - PubMed
    1. Hunt SM, Elvin M, Crosthwaite SK & Heintzen C The PAS/LOV protein VIVID controls temperature compensation of circadian clock phase and development in Neurospora crassa. Genes Dev. 21, 1964–1974 (2007). - PMC - PubMed
    1. Gutiérrez-Medina B & Candia CNH Aggregation kinetics of the protein photoreceptor Vivid. Biochim. Biophys. Acta: Proteins Proteomics 140620 (2021). - PubMed

Methods References

    1. Fukaya T, Lim B & Levine M Enhancer Control of Transcriptional Bursting. Cell 166, 358–368 (2016). - PMC - PubMed
    1. Santos MG, Jorge SAC, Brillet K & Pereira CA Improving heterologous protein expression in transfected Drosophila S2 cells as assessed by EGFP expression. Cytotechnology 54, 15–24 (2007). - PMC - PubMed
    1. Villefranc JA, Amigo J & Lawson ND Gateway compatible vectors for analysis of gene function in the zebrafish. Dev. Dyn 236, 3077–3087 (2007). - PMC - PubMed
    1. Lamprecht MR, Sabatini DM & Carpenter AE CellProfiler™: free, versatile software for automated biological image analysis. Biotechniques 42, 71–75 (2007). - PubMed
    1. Wickham H, François R, Henry L & Müller K dplyr: a grammar of data manipulation. R package version 0.8. 0.1 Retrieved January 13, 2020 (2019).

Publication types