. 2022 Jan;23(1):135-145.
doi: 10.1038/s41590-021-01078-x. Epub 2021 Dec 22.

Surface phenotypes of naive and memory B cells in mouse and human tissues

Affiliations

Surface phenotypes of naive and memory B cells in mouse and human tissues

Nadine M Weisel et al. Nat Immunol. 2022 Jan.

Abstract

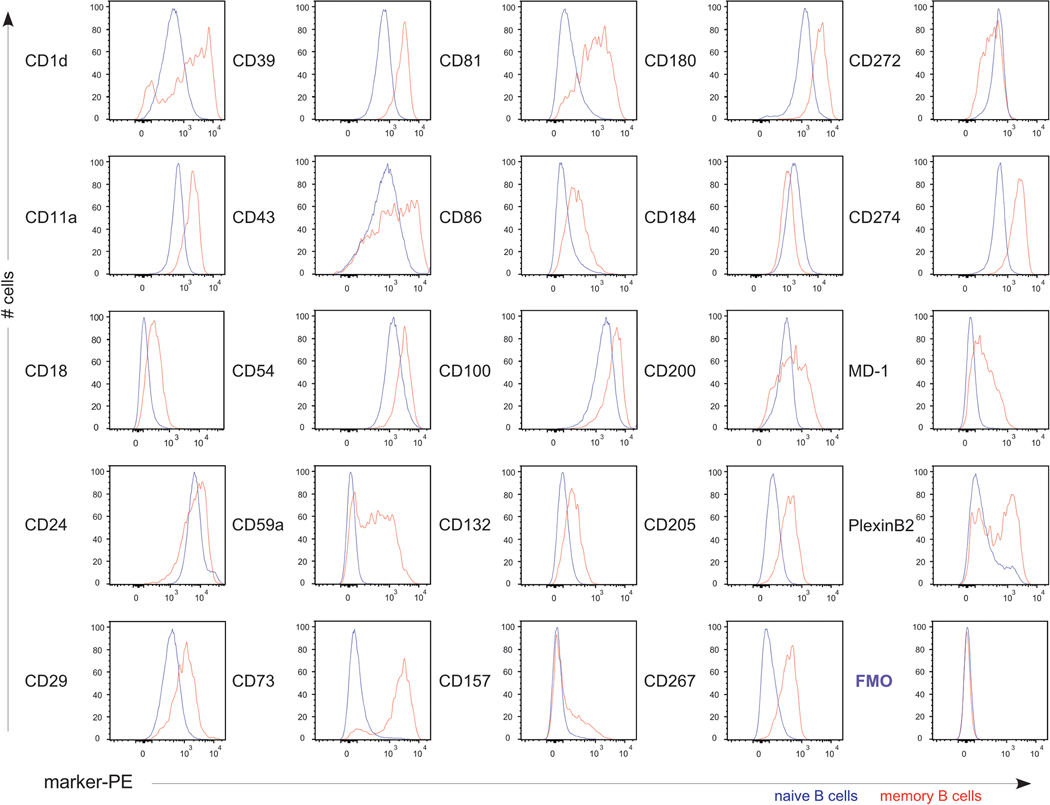
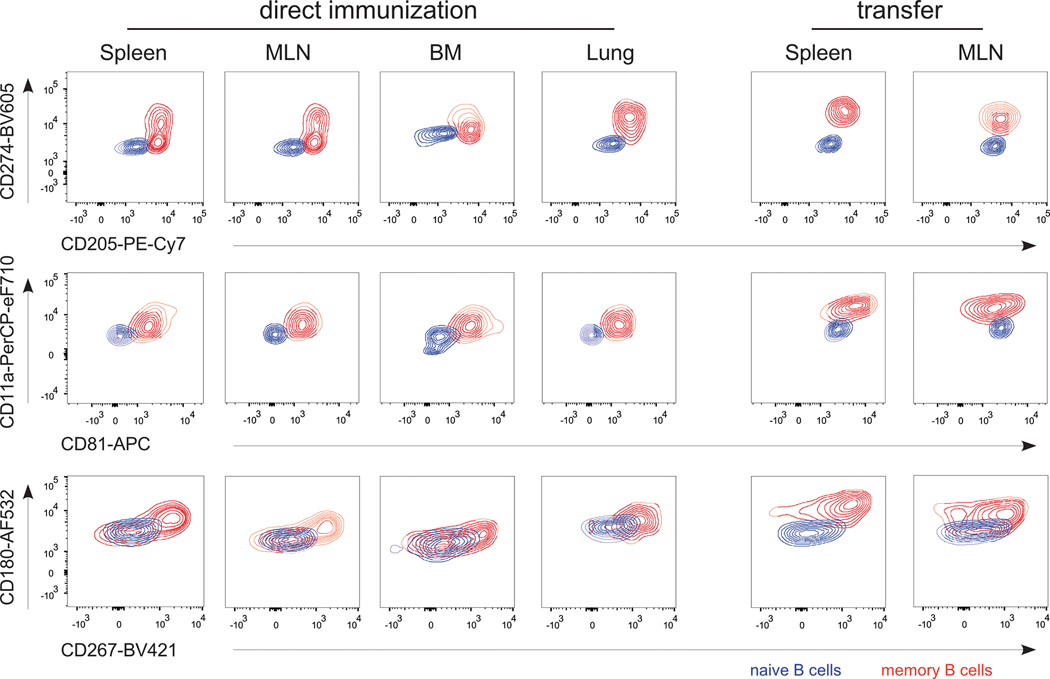
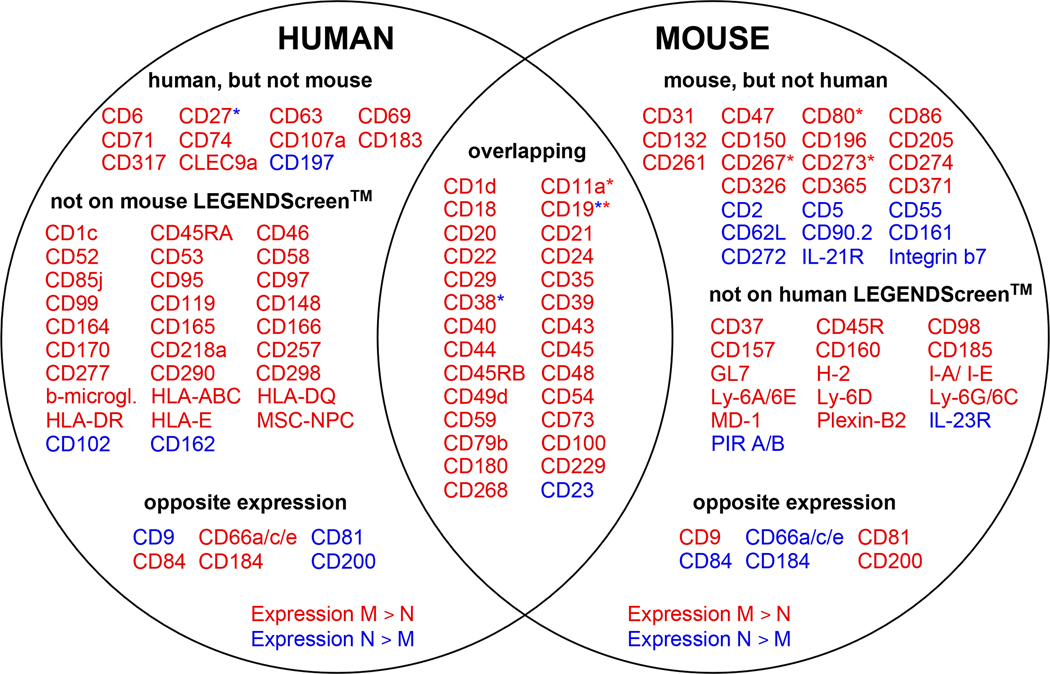
Memory B cells (MBCs) protect the body from recurring infections. MBCs differ from their naive counterparts (NBCs) in many ways, but functional and surface marker differences are poorly characterized. In addition, although mice are the prevalent model for human immunology, information is limited concerning the nature of homology in B cell compartments. To address this, we undertook an unbiased, large-scale screening of both human and mouse MBCs for their differential expression of surface markers. By correlating the expression of such markers with extensive panels of known markers in high-dimensional flow cytometry, we comprehensively identified numerous surface proteins that are differentially expressed between MBCs and NBCs. The combination of these markers allows for the identification of MBCs in humans and mice and provides insight into their functional differences. These results will greatly enhance understanding of humoral immunity and can be used to improve immune monitoring.


Conflict of interest statement

Competing Interests Statement

Authors declare that they have no competing financial interest.

Figures

Extended Data Fig. 1
Extended Data Fig. 1. Differentially expressed surface markers on human and murine naive and memory B cells, in support of Fig. 3.
Differentially regulated surface markers as in Fig. 3 are sorted based on the ratio of the mean fluorescence intensity (MFI) of MBC to NBC. a, MFI ratio of MBC to NBC in humans (mean of three donors 182, 185, and 186). b, MFI ratio MBC to NBC in mice. Red and blue dots depict higher expression on MBC or NBC, respectively. Plot was built using ggplot2 (version 3.2.1) in R (version 3.6.1).
Extended Data Fig. 2
Extended Data Fig. 2. Validation of differentially regulated surface markers on murine naive and memory B cells, in support of Figs. 3 and 4.
Histograms of flow cytometric expression of 24 depicted surface markers on MBC (red) and NBC (blue). MBC were identified as CD45.2+ NIP+ CD19+ live singlets on splenocytes of transfer recipients (7 females, 39 wks old, 31 wks post immunization plus 3 males, 34 wks old, 23 wks post immunization) and splenic B cells of CD45.1 naive B1–8i+/− Balb/cJ mice (3 males 11 wks old plus 2 males, 9 weeks old) were mixed into the staining to serve as NBC, identified by their CD45 allotype mark. Cells were stained with “Murine Stain 3” (Supplementary Tables 5 and 6). The fluorescence minus one control FMO for the PE-channel is shown in the bottom ri ht histo ram.
Extended Data Fig. 3
Extended Data Fig. 3. Validation of differentially regulated surface markers on human naive and memory B cells in support of Figs. 3 and 4.
Cryopreserved human splenocytes were stained with either “Stain 2”, “Stain 3”, “Stain 4” or “Stain 5” (Supplementary Tables 3 and 4) for flow cytometric analysis. Shown are histograms of the expression of 16 depicted surface markers on MBC (CD19+ CD2J+, red) and NBC (CD19+ CD27, blue). All markers were validated on 3 individual donor spleens listed in the tables below the histo rams.
Extended Data Fig.4
Extended Data Fig.4. Combinations of surface markers that allow for the identification of murine MBC and NBC in the C57BLl6 background in support of Fig. 5.
Direct immunization (left panel): Single cell suspensions of indicated tissues from 3 male C57BLl6 wt (CD45.2, 12 wks old, 4 wks post immunization) mice were analyzed at day 28 post i.p. immunization with 100l-1g NP-KLH. 5 × 10⁶ cells were mixed with 1 × 10⁶ cells of corresponding tissues of 1 naive male C57BLl6 CD45.1 congenic mouse (8 wks old) to allow for the simultaneous identification of MBC and their comparable naive counterparts in a single staining tube. MBC and NBC were identified as described in Supplementary Fig. 8a and displayed data are concatenated of 3 individual samples. OTII adoptive transfer system (right panel): Single cell suspensions of indicated tissues from 5 individual OTII adoptive transfer recipients (males, 12 wks old, 4 wks post immunization) were analyzed at day 28 post i.p. immunization with 50l-1g NP-CGG. 5 × 10⁶ cells were mixed with 1 × 10⁶ cells of corresponding tissues of 1 male naive C57BLl6 wt (CD45.2) mouse (7 wks old) to allow for the simultaneous identification of MBC and their comparable naive counterparts in a single staining tube. Cells were stained with “Murine Stain 5” (Supplementary Tables 5 and 6). MBC (red) and NBC (blue) were identified as described in Supplementary Fig. 8b and displayed data are concatenated of 5 individual samples. Shown are contour plots of pairwise combinations of CD2051 CD274, CD811 CD11 a and CD2671 CD180 as in Fig. 5, which can be used to distinguish MBC and NBCs across tissues. MLN, mesenteric lymph nodes; BM, Bone Marrow.
Extended Data Fig. 5
Extended Data Fig. 5. Differentially regulated surface markers on naive versus memory B cells across human tissues, in support of Fig. 6.
Single cell suspensions of spleen (SP), blood (B), bone marrow (BM), lymph node (LN), intestinal tissue (Gut) and tonsil (T) were stained for flow cytometric analysis using “Stain 2” and “Stain 4” (Supplementary Tables 3 and 4). The left panel shows the summary of the differences in MFI between CD19+ CD27+ B cells and CD19+ CD27 B cells (Δ MFI) for the depicted surface markers. For CD74 and CD119 spleen (n=23 in red), blood (n=7 in blue), BM (n=9 in magenta), LN (n=6 in green), gut (n=3 in brown) and tonsil (n=2 in black) samples were analyzed. For CD218a spleen (n=21 in red), blood (n=10 in blue), BM (n=10 in magenta), LN (n=8 in green), gut (n=8 in brown) and tonsil (n=2 in black) samples were analyzed. For CD370 spleen (n=21 in red), blood (n=10 in blue), BM (n=10 in magenta), LN (n=8 in green), gut (n=8 in brown) and tonsil (n=2 in black) samples were analyzed. The right panel shows example histograms for depicted surface markers of CD19+ CD27 B cells (blue) and CD19+ CD27+ B cells (red) across tissues of donor D260. Stars indicate significant differences in ΔMFI of indicated tissues compared to spleen using the unpaired two-tailed t-test with Welch’s correction. *** p< 0.001, **** p< 0.0001. Exact significant p-values for comparison between spleen and the indicated tissue for each marker are for CD74: all tissues p<0.0001; for CD119 blood, bone marrow and gut p<0.0001, lymph node p=0.0006 and tonsil p=0.1112; for CD218a: blood and bone marrow p<0.0001, gut p=0.0001, tonsil p=0.1047 and CD370: blood, lymph node, gut and tonsil p=0.0002 and bone marrow p=0.0003.
Extended Data Fig. 6
Extended Data Fig. 6. Expression of surface markers CD11a and CD200 on human splenic MBC and NBC separated by Ig isotype in support of Fig. 7.
Splenic single cell suspensions were stained for depicted markers (“Stain 5”, Supplementary Tables 3 and 4). Overlayed histograms for expression of CD11a (upper panel) or CD200 (lower panel) of either total CD27 and CD27+ (first row), or specific Ig isotypes for CD27 overlayed with total CD27+ (row 2 CD27 IgM/D; row 3 CD27 IgG; row 4 CD27 IgA) are shown for 6 individual donors (D192, D215, D228, D333, D365, D388). CD19+ CD27+ MBC are in red and CD19+ CD27 NBC are in blue. The last rows of each panel show a summary of the CD27 isotypes analyzed (IgM/D green; IgG blue; IgA orange) in direct comparison with the total CD27 B cells (red).
Figure 1:
Figure 1:. Discovery of differentially regulated surface markers between memory and naive B cells by murine LEGENDScreen analysis.
a, Overview of experimental procedures. We used an established murine transfer system that generates large numbers of MBC in response to hapten NP-carrier immunization , . Splenocytes of 28 NP-immune transfer recipients (15 females and 13 males at 17 weeks post immunization) were harvested, pooled and subjected to flow cytometric staining with Abs listed in Supplementary Tables 5 and 6 “Murine Stain 1” to allow for the simultaneous identification of NBC and NP-specific MBC. Cells were then transferred to LEGENDScreen plates with each well containing a single commercially available surface marker in PE (see Methods). Images are from BioRender software (https://app.biorender.com). b, Flow cytometric detection of NP-reactive MBC (red gate) and NBC (blue gate) and their expression of CD81-PE as an example. Gating strategy is in Supplementary Fig. 1.
Figure 2:
Figure 2:. Discovery of differentially regulated surface markers between memory and naive B cells by human LEGENDScreen analysis.
a, Overview of experimental procedures of VPD barcoding and flow cytometric staining of splenocytes of 3 different donors with “Stain LS” (Supplementary Tables 3 and 4). Image is from BioRender software (https://app.biorender.com). b, Gating strategy for the flow cytometric detection of NBC (CD19+ CD27) and MBC (CD19+ CD27+). Shown are histograms of the LEGENDScreen-encoded surface marker CD21 derived PE-signals as example data for NBC and MBC of each individual donor, as distinguished by their differential VPD-fluorescence. Arrows indicate subsequent gating of populations and numbers next to outlined areas indicate percentages of cells in gated populations. Gating strategy is in Supplementary Fig. 2.
Figure 3:
Figure 3:. Venn diagram of highly expressed surface markers on human and mouse naive and memory B cells.
Markers depicted showed an MFI greater than 10 times the respective FMO stain for NBC and MBC. Markers that reached this cut-off only on one of the latter populations are included. Markers in red are expressed higher on MBC (ratio M/N > 1,1), markers in blue are higher on NBC (ratio M/N < 0,9). In total there are 28 overlapping markers between both species. Blue (human) and red (mouse) asterisks depict markers that were detected by the master “gating” stain during LEGENDScreen assays, rather than by the LEGENDScreen PE-labeled antibody. M, MBC; N, NBC.
Figure 4:
Figure 4:. Summary of marker expression revealed by human and mouse LEGENDScreen analysis.
a, Marker expression pattern of all analyzed human and mouse surface markers summarized in pie diagrams (also see Supplementary Table 1). The markers shown as “expressed” had an MFI greater than 10 times the respective FMO for NBC and/ or MBC. Markers in red have higher expression on MBC, markers in blue are higher on NBC. Markers in green show a ratio M/N between 0,9 and 1,1. Markers in grey didńt reach an MFI of 10 times FMO on any cells and were therefore categorized as “not or low expressed”. b, Venn diagram of markers that were more highly expressed on MBC and the overlap between species. c, Venn diagram as in (b) for markers more highly expressed on NBC. d, Heatmap of differentially expressed markers in humans and mice. Markers are sorted and grouped into four color categories based on the Venn Diagram in Fig. 3. Circle color shows the log2 MFI fold-change (FC) between MBC and NBC. Markers with more than 2 log2 fold-change values are set as 2. Circle size represents the overall level of expression as log2 fold change of MFI of the cell type with higher expression (either memory or naive) vs. FMO of that cell type. Heatmap was built using ggplot2 (version 3.2.1) in R (version 3.6.1).
Figure 5:
Figure 5:. Combinations of surface markers that allow for the identification of murine MBC.
Single cell suspensions of indicated tissues from 3 male adoptive transfer recipients (22 wks old; 13.5 wks post immunization) with defined CD45.2+ NP+ CD19+ MBC populations (Fig. 1) were mixed with cells isolated from respective tissues of 1 male naive CD45.1 B1–8i+/− mice (14 wks old). This allowed for the simultaneous identification of MBC and their comparable naive counterparts in a single staining tube. Cells were stained for indicated surface markers with “Murine Stain 2” (Supplementary Tables 5 and 6), and MBC (red) were identified as viability fixable dyeneg, CD45.2+, NP+, CD19+ B cells and NBC (blue) were identified as viability fixable dyeneg, CD45.1+, CD19+ B cells. To avoid confounding by marginal zone B cells, which are only present in spleen, splenic NBC were gated as follicular B cells (CD21/35low). Shown are contour plots of pairwise combinations of CD274/ CD205, CD11a/ CD81 or CD180/ CD267, which combinations can be used to distinguish MBC and NBCs across tissues. MLN, mesenteric lymph nodes; BM, Bone Marrow; LP, lamina propria; PP, Peyeŕs Patches.
Figure 6:
Figure 6:. Differentially regulated surface markers on naive and memory B cells across human tissues and donors.
Single cell suspensions of spleen (SP), blood (B), bone marrow (BM), lymph node (LN), intestinal tissue (Gut) and tonsil (T) were stained for flow cytometric analysis using “Stain 2”, “Stain 3”, “Stain 4” and “Stain 5” (Supplementary Tables 3 and 4). The left panel shows the summary of the differences in MFI between CD19+ CD27+ B and CD19+ CD27 B cells (Δ MFI) for the depicted surface markers. For CD11a spleen (n=11 in red), blood (n=9 in blue), BM (n=3 in magenta), LN (n=3 in green), gut (n=10 in brown) and tonsil (n=2 in black) samples were analyzed. For CD24 spleen (n=5 in red), blood (n=3 in blue), BM (n=3 in magenta), LN (n=3 in green), gut (n=4 in brown) and tonsil (n=2 in black) samples were analyzed. For CD54 spleen (n=9 in red), blood (n=9 in blue), BM (n=3 in magenta), LN (n=3 in green), gut (n=9 in brown) and tonsil (n=2 in black) samples were analyzed. For CD180 spleen (n=5 in red), blood (n=3 in blue), BM (n=3 in magenta), LN (n=3 in green), gut (n=4 in brown) and tonsil (n=2 in black) samples were analyzed. For CD200 spleen (n=25 in red), blood (n=10 in blue), BM (n=10 in magenta), LN (n=9 in green), gut (n=9 in brown) and tonsil (n=2 in black) samples were analyzed. The right panel shows example histograms for depicted surface markers of CD19+ CD27 B cells (blue) and CD19+ CD27+ B cells (red) across tissues of donor D256 or D260 for CD200-BUV737 respectively. The histograms of staining with anti-CD200-BV605 across tissues were obtained with cells from D256 and serve as example of CD200 expression revealed in a fluorochrome brighter than BUV737 (“Stain 3”; Supplementary Tables 3 and 4). Stars indicate significant differences in ΔMFI of indicated tissues compared to spleen using the unpaired two-tailed t-test with Welchś correction. * p< 0.05, ** p< 0.01, *** p< 0.001, **** p< 0.0001. Exact significant p-values for comparison between spleen and the indicated tissue for each marker are for CD11a: blood p=0.0022; bone marrow and gut p<0.0001; lymph node p=0.0013 and tonsil p=0.0006; for CD54: tonsil p=0.0485 and CD180: blood p=0.0249; lymph node p=0.0302, gut p=0.0230 and tonsil p=0.0110.
Figure 7:
Figure 7:. Combinations of surface markers that allow for the identification of human memory B cells across tissues.
Human spleen, blood, bone marrow (BM), lymph node (LN), tonsil and gut single cell suspensions were stained for depicted markers (“Stain 3”, Supplementary Tables 3 and 4). Contour plots of combinations of CD200/ CD11a, CD200/ CD54, CD81/ CD24, CD24/ CD11a, CD180/ CD54 or CD180/ CD24 are shown for 3 individual donor tissues (D256, D290, D337). CD19+ CD27+ B cells are in red and CD19+ CD27 B cells are in blue.
Figure 8:
Figure 8:. Pathway enrichment analysis of differentially regulated markers between MBC and NBC revealed by LEGENDScreen analysis.
The top 10 enriched pathways from MsigDB (canonical and Gene Ontology Biological Process (GOBP)) and CHEA (a database of transcription factor targets inferred from functional genomics) from enrichR are shown as part of a network. In total 30 pathways for human (pink nodes) and murine (gray nodes) are shown each. Significantly enriched (FDR P-values <0.2) pathways are indicated by bordered nodes. Canonical terms are shown as circles, GOBP terms are shown as triangles and CHEA as diamond nodes. CHEA annotations are aggregated at different levels of granularity (see Methods for details). For example, “IRF8 GC.B” corresponds to IRF8 targets in GC B-cells and “IRF8” corresponds to a merged set of IRF8 targets based on assays from any cell-type. Common enriched pathways between human and murine are show in the center of the network. Connections (edges) among pathways are shown if there are >33% shared genes between the connected nodes. Bolder edge lines represent higher fractions of genes shared between the pathway genesets. Enrichment was calculated based on one-sided Fisher’s Exact test (with all panel markers as background) followed by Storey’s Q-value false discovery rate (FDR) correction.

References

    1. Gry M et al. Correlations between RNA and protein expression profiles in 23 human cell lines. BMC Genomics 10, 365 (2009). - PMC - PubMed
    1. Chan JK, Ng CS & Hui PK A simple guide to the terminology and application of leucocyte monoclonal antibodies. Histopathology 12, 461–480 (1988). - PubMed
    1. Weisel F & Shlomchik M Memory B Cells of Mice and Humans. Annu Rev Immunol 35, 255–284 (2017). - PubMed
    1. Akkaya M, Kwak K & Pierce SK B cell memory: building two walls of protection against pathogens. Nat Rev Immunol 20, 229–238 (2020). - PMC - PubMed
    1. Cyster JG & Allen CDC B Cell Responses: Cell Interaction Dynamics and Decisions. Cell 177, 524–540 (2019). - PMC - PubMed

Publication types

LinkOut - more resources